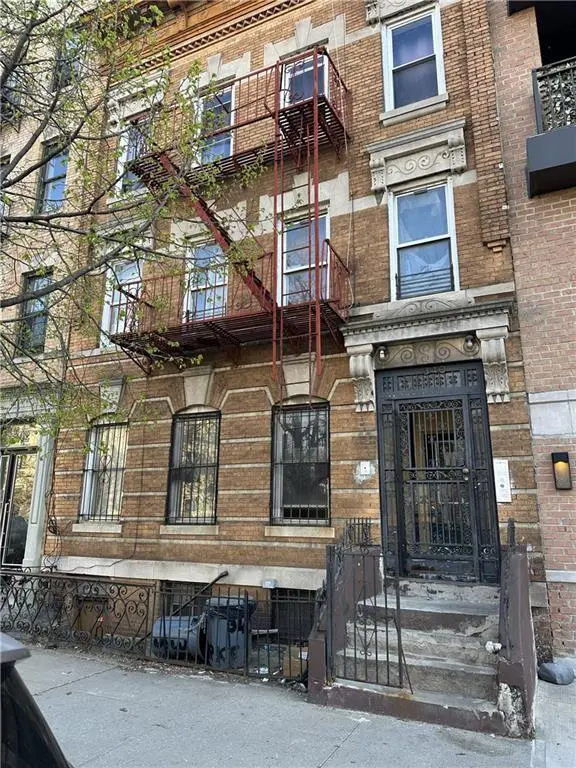
340 St. Marks Ave Unit 3F · New York, NY
Flood risk 1/10 · Minimal
- FEMA flood zone
- X (unshaded)
- Chance of flooding over 30 yrs
- 0.0%
- Est. flood insurance / yr
- $507 – $1,088
Fire risk 1/10 · Minimal
- Est. fire insurance / yr
- $691 – $1,283
Heat risk 6/10 · Moderate
- Hot days now (above 99°F)
- 7 days/yr
- Hot days in 30 yrs
- 15 days/yr
Wind risk 6/10 · Moderate
- Chance of severe wind over 30 yrs
- 27.0%
Air-quality risk 4/10 · Minor
- Unhealthy air days now
- 5 days/yr
- Unhealthy air days in 30 yrs
- 7 days/yr
Risk factors via First Street. Map © Google.
Why this score? — see what drove the D grade
The composite is a weighted blend of 9 inputs, each scored 0–100. Each bar is that input's sub-score; the figure is the points it added to the 100-point composite (weight × sub-score).
- Cash flow +8.0/30.0
- Appreciation +7.8/10.0
- ARV discount +7.5/15.0
- Schools +5.0/10.0
- Livability +3.8/5.0
- Rent growth +3.6/5.0
- 1% rule +2.5/10.0
- Condition / age +2.5/5.0
- DSCR +2.1/10.0
$800,000
🖨 Deal sheet (PDF) 📄 Offer letter ✓ Due diligence
Listing remarks
THIS NEWLY LISTED 3 BRM COOP IN T5HE HEART OF PROSPECT HEIGHT WITH A LITTLE TLC THIS 3 FL WALK UP COULD BE YOUR DREAM HOME. IN THE CENTER OF A IMPRESSIVE DESIRABLE NEIBORHOOD .
Key facts
- Listed 59 days
Property features AI
Finance
- Other: Co-op shares: 1.00; Building has a flip tax
- Financial info: No financing offered (listed as None)
- HOA & community: Monthly maintenance fee of $300; Managed by Brooklyn Real Property; Pets are allowed (cats and dogs, no weight limit); Fee includes assessment
Exterior
- Parking: No parking
- Security: Intercom door
- Utilities: Gas service; Municipal water; Municipal sewer; Hot water via coil in boiler
- Home design: Residential building; Unit located on third floor
- Construction: Building details not provided
- Exterior features: Residential property within a 6-unit building; Located on the 3rd floor
Interior
- Kitchen: Microwave; Refrigerator; Stove
- Bedrooms: Two bedrooms on the first floor; Primary bedroom with double-door closets; Second bedroom on the first floor (features stall shower)
- Flooring: Tile floors
- Bathrooms: Stall shower in one bedroom (no additional bathroom count provided)
- Heating & cooling: Gas heating; Baseboard heat delivery; One AC unit
- Interior features: Intercom door; Microwave; Refrigerator; Stove; Tile floors; One AC unit
- Laundry & utility: Hot water coil in boiler
Neighborhood map
What this means for you Summary
Snapshot
- This is a 2-bed/1.0-bath condo listed at $800k.
Deal economics
- At list price, monthly cash flow is $-816 ($-10k/yr) — negative.
- To cash-flow at today's rent, offer at most $682k (14.8% below list).
- To meet the 1% rule (rent ≥ 1% of price), the offer needs to be $597k (25.4% below list).
- Recommended offer: $597k (25.4% below list) — sets the bar for 1% rule.
- Cap rate 5.1% vs local median 2.6% in New York — top-decile yield for the area; either an underpriced asset or a hidden risk that comps aren't pricing in. Stress-test before assuming the spread holds.
Location & tenants
- Location reads 75/100 on livability (#268 in NY, #4,188 nationally) — a middle-class / working-renter tenant base. Strengths: amenities A+, commute A+, health & safety A; Watch: crime F, cost of living F.
- Zoned schools: Elm Tree Elementary School (math 27% / reading 52%, grade F, #1,444 of 2,108 statewide, top 71%, 806 students, 94% FRL); Jhs 383 Philippa Schuyler (math 32% / reading 67%, grade C, #280 of 729 statewide, top 40%, 822 students, 85% FRL); Midwood High School (math 94% / reading 96%, grade A+, #83 of 1,100 statewide, top 8%, 4,062 students, 73% FRL).
- Market conditions: Rents rising fast (+4.4%/yr); 146 active listings in the ZIP; 15 comparable units currently listed for rent nearby; rentals leasing fast (median 5d on market — plan ~1-2 weeks tenant-placement turnaround); high-income renter base; 10,063 units permitted in Kings County in 2024 (9,789 in 5+ unit buildings).
- At $5,965/mo this rent would consume 53% of the median local household income ($135k/yr) (locally 3722% of renters already pay >50% of income on rent) — very limited rent-growth headroom before tenants either downsize or default.
Forward outlook
- In year one you build about $50k of equity ($6k loan paydown + $44k appreciation (5.5% local appreciation)).
- Kings County population projected at +13% by 2050 — modest demand growth; plan on rents tracking national, not racing it.
- By year 2, paydown + projected appreciation supports a ~$80k cash-out refi (75% LTV) — recoverable capital for the next deal without selling this one.
Negotiation context
- It's been on market 59 days — a 3% lower offer ($776k) is reasonable based on typical stale-listing flexibility.
Risks & watch-outs
- Climate carrying-cost: major wind risk, 27% chance of damaging wind over 30y; extreme-heat days projected 7→15/yr by 2055 (HVAC capex compounding) — expect insurance premiums to compound above CPI over the hold.
Questions for the listing agent
- What do current leases actually rent for vs. the listed asking? Can we see a recent rent roll and the last 12 months of T-12 income?
- It's been on market 59 days. Have you received any prior offers? Is the seller open to a 25% concession, seller financing, or rate buy-down credit?
- Any open or pending special assessments — roof, HVAC, plumbing, elevator, façade? What's the per-unit balance and payoff schedule, and is the seller paying it off at close or rolling it to the buyer?
- Is there a deadline driving the sale (1031 exchange, divorce, estate, relocation)? That informs how much negotiation room exists.
- Schools are B-rated — typically a magnet for longer-tenancy family renters. What's the average tenant stay here, and is there a school-zone premium baked into asking?
- Crime grade is F in this area — have there been break-ins, vandalism, or insurance claims at this property in the last 3 years? What carrier currently insures it and at what premium?
- The area grade is low — what's the realistic commute time and amenity access for the typical tenant pool here? Any planned neighborhood developments (good or bad) we should know about?
- What's the average days-on-market for RENTAL listings here right now (not sales)? A rising rental-DOM trend means longer vacancies and softer asking-rent achievability than the comps imply.
- What's the recent tenant-quality profile in this submarket — average credit score on applications, eviction rate, late-payment / NSF rate, and stable-employment percentage? A property-management company in the area should have these aggregated.
- How much new apartment / multifamily construction is in the pipeline within 1–3 miles? Heavy new supply (>2% of stock underway) typically softens rents 12–24 months out; light construction supports rent growth.
Investment metrics
- 1% rule
- 0.75% ✗
- Cap rate
- 5.07%
- Cash-on-cash
- -4.37%
- DSCR
- 0.81
- GRM
- 11.2
CMA / ARV
No comps found within radius.
Projected returns pro-forma
5.55% appreciation · 4.4% rent growth · sell at horizon
- IRR
- 11.2%
- Equity multiple
- 1.74×
- Total profit
- $166,416
- Equity at exit
- $480,378
- IRR
- 12.7%
- Equity multiple
- 3.48×
- Total profit
- $554,905
- Equity at exit
- $852,327
Cash invested: $224,000 (down + closing). Projections, not guarantees.
Landlord ↔ Tenant lean methodology
- Overall (CITY)
- 0 Strongly Tenant-Friendly
- State New York
- 15 Strongly Tenant-Friendly · D+10
- County
- — inherits STATE
- City New York
- 0 Strongly Tenant-Friendly · D+34
ZIP-level market 11238
- Home prices YoY
- 1.5%
- Rents YoY
- 4.4%
- Active inventory
- 146
- Price-to-rent
- 11.2×
Monthly cashflow live
- Estimated rent
- $5,965 high interval (Pro) →
- Mortgage (P&I)
- −$4,195
- Tax est. 1.5%
- −$1,000 /mo · $12,000/yr
- Insurance
- −$333
- HOA
- −$0
- Lot rent
- −$0
- Vacancy / Maint / Mgmt
- −$1,253
- Net cashflow
- $-816
Break-even live
Sensitivity live
| Price | -10% $-263 | -5% $-540 | +0% $-816 | +5% $-1,093 | +10% $-1,369 |
|---|---|---|---|---|---|
| Rent | -10% $-1,287 | -5% $-1,052 | +0% $-816 | +5% $-581 | +10% $-345 |
| Rate | -1.0pp $-413 | -0.5pp $-613 | base $-816 | +0.5pp $-1,024 | +1.0pp $-1,234 |
UW: 25.0% down · 7.5% · 30yr · 1.5% tax · 5.0% vac · 8.0% maint · 8.0% mgmt
Financing live
Cash to close
- Down payment
- $200,000
- Closing costs
- $24,000
- Reserves months
- —
- Total cash needed
- —
Loan-product check · same deal, 3 products live
Conventional
25% down · 7.5% · 30yr
- Down + closing
- —
- Monthly P&I
- —
- Monthly cashflow
- —
- DSCR
- —
- Eligible?
- —
Personal DTI + credit; lowest rate.
DSCR
20% down · 8.5% · 30yr
- Down + closing
- —
- Monthly P&I
- —
- Monthly cashflow
- —
- DSCR
- —
- Eligible?
- —
No personal income docs; deal must DSCR.
Hard money
10% down · 12.0% · 12mo
- Down + closing
- —
- Monthly P&I
- —
- Monthly cashflow
- —
- DSCR
- —
- Eligible?
- —
Short-term bridge; refi at stabilization.
Rent comps 15 comps
| Address | Beds | Baths | Sqft | Rent | $/sqft | DOM | Units | Dist |
|---|---|---|---|---|---|---|---|---|
| 755 Washington Ave Brooklyn, NY | 1.0 | 1.0 | 700 | $1,800 | $2.57 | 23d | 1 | 0.20mi |
| 545 Vanderbilt Ave Brooklyn, NY | 2.0 | 1.0 | 600 | $6,280 | $10.47 | 5d | 3 | 0.41mi |
| 475 Clermont Ave Brooklyn, NY | 2.0 | 1.0–2.0 | 807 | $6,596 | $8.17 | 1d | 6 | 0.49mi |
| 762 Park Pl Unit 3B Brooklyn, NY | 3.0 | 2.0 | 1114 | $5,400 | $4.85 | 27d | 1 | 0.66mi |
| 461 Dean St Brooklyn, NY | 1.0 | 1.0 | 781 | $5,320 | $6.81 | 7d | 5 | 0.69mi |
| 800 Park Pl Unit 3R Brooklyn, NY | 2.0 | 2.0 | 1300 | $6,995 | $5.38 | 27d | 1 | 0.72mi |
| 151 S Elliott Pl Brooklyn, NY | 1.0–2.0 | 1.0–2.0 | 655 | $6,380 | $9.74 | 4d | 2 | 0.79mi |
| 655 Union St #1846 Brooklyn, NY | 1.0–2.0 | 1.0–2.0 | 727 | $7,810 | $10.74 | 5d | 2 | 1.01mi |
| 1437 Pacific St Brooklyn, NY | 2.0 | 1.0 | 1000 | $3,200 | $3.20 | 27d | 1 | 1.05mi |
| 333 Schermerhorn St Brooklyn, NY | 1.0 | 1.0 | 585 | $6,782 | $11.58 | 1d | 15 | 1.14mi |
| 540 Fulton St #1729 Brooklyn, NY | 3.0 | 1.0–2.0 | 750 | $7,563 | $10.08 | 27d | 4 | 1.22mi |
| 196 Willoughby St Brooklyn, NY | 2.0 | 1.0–2.0 | 717 | $7,921 | $11.05 | 0d | 9 | 1.32mi |
| 1619 Pacific St Brooklyn, NY | 2.0 | 2.0 | 1300 | $3,300 | $2.54 | 4d | 1 | 1.42mi |
| 72 Van Buren St Brooklyn, NY | 3.0 | 1.0 | 1000 | $1,180 | $1.18 | 27d | 1 | 1.43mi |
| 214 Duffield St Brooklyn, NY | 3.0 | 1.0–2.0 | 956 | $6,427 | $6.72 | 1d | 1 | 1.48mi |
HOA detail condo
- Monthly dues
- $0 · $0/yr
- Assessments
- None detected in remarks — confirm with the listing agent.
Listing history 15 events
-
2026-06-22days on market $800,000 Active 59 DOM
-
2026-06-21days on market $800,000 Active 58 DOM
-
2026-06-18days on market $800,000 Active 55 DOM
-
2026-06-17days on market $800,000 Active 54 DOM
-
2026-06-16days on market $800,000 Active 53 DOM
-
2026-06-15days on market $800,000 Active 52 DOM
-
2026-06-13days on market $800,000 Active 50 DOM
-
2026-06-10days on market $800,000 Active 46 DOM
-
2026-06-08days on market $800,000 Active 45 DOM
-
2026-06-08days on market $800,000 Active 44 DOM
-
2026-06-04days on market $800,000 Active 41 DOM
-
2026-06-03days on market $800,000 Active 40 DOM
-
2026-06-01days on market $800,000 Active 38 DOM
-
2026-05-31days on market $800,000 Active 37 DOM
-
2026-04-23$800,000 Active
ⓘ Source: listings_history table (triggers on properties + properties_extension) + one-shot
backfill from property_details.listing_events for pre-trigger history.
Climate risk First Street
- Flood 1/10 Low FEMA zone X (unshaded) · 0% chance over 30 yrs
- Wildfire 1/10 Low
- Heat 6/10 Major 7 d/yr ≥99°F today · 15 d/yr by 30 yrs out
- Wind 6/10 Major 27% chance of damaging wind over 30 yrs
- Air quality 4/10 Moderate 5 unhealthy d/yr today · 7 by 30 yrs out
Nearby sold comps map
Loading sold comps map…
Walkable amenities ~0.75 mi
Loading nearby amenities…
Taxation est. · year 1
- Rental income
- $71,580
- − Mortgage interest
- −$44,812
- − Property taxes
- −$12,000
- − Insurance
- −$4,000
- − Repairs & maintenance
- −$5,726
- − Management
- −$5,726
- − Depreciation
- −$23,273
- Taxable loss
- −$23,958
- Est. tax savings @ 24.0%
- +$5,750
- After-tax cash flow
- $-4,045/yr
For passive investors: Depreciation is non-cash, so a rental often shows a tax loss while cash-flowing — sheltering income. Rental losses are passive: they offset passive income freely, and up to $25,000/yr can offset ordinary (W-2) income if you actively participate and your MAGI is under $100k (phasing out to $0 by $150k); unused losses carry forward. On sale, claimed depreciation is recaptured at up to 25%, and gains may owe capital-gains tax (a 1031 exchange can defer both). Figures are a year-1 estimate at your 24.0% rate — not tax advice; consult a CPA.
Schools (NCES district)
No district data.
Livability — New York
- Score
- 75/100
- State rank
- #268
- US rank
- #4188
Category grades
Schools grade is shown separately in the Schools card above.
Census & demographics
- Census place
- New York, NY
- County
- Kings County · 2,614,986 people
- City population
- 7,731,280
- Metro
- New York-Newark-Jersey City, NY-NJ-PA
- Population (ZIP)
- 58,345
- Household income
- $134,523
- Rent vs Own
- Severe rent burden
- 3722.0
Population outlook (Kings County) Hauer SSP2
- Today (2025)
- 2,847,441 people
- By 2030
- 2,937,006 · +3.1%
- By 2040
- 3,095,491 · +8.7%
- By 2050
- 3,228,968 · +13.4%
- By 2075
- 3,321,723 · +16.7%
- By 2100
- 3,111,387 · +9.3%
Race, ethnicity, and origin ACS 2023
- Neighborhood character
- Diverse neighborhood (Simpson 0.70)
- Race & ethnicity
- White 47% Black 23% Hispanic / Latino 15% Two or more races 13% Asian 7%
- Hispanic origin (detail)
- Mexican 2% Puerto Rican 3% Dominican 3%
- Common ancestry
- Romanian 3% Slovak 2% Italian 2%
- Foreign-born
- 20% · Canada, China, South Korea
- Languages at home
- 79% English-only · Spanish 9% Other Indo-European 3% French/Haitian/Cajun 2%
Political lean MEDSL · Kings
- 2024 margin
- Solid D (+44.0) · D 72.0% · R 28.0%
- 2008→2024 swing
- -15.5pp toward R · 2008: 59.4pp · 2024: 44.0pp
- All cycles
- 2024: D+44.0 2020: D+54.8 2016: D+61.8 2012: D+63.9 2008: D+59.4
Not yet ingested
- Civics
- —
Market trends
- HPI YoY
- ▲ 5.55%
- Current HPI
- 368.1523
- Rent YoY
- ▲ 4.40%
- Metro
- New York-Newark-Jersey City, NY-NJ-PA
- State GDP YoY
- ▲ 2.60%
- F500 in state
- 92
Industry mix (Fortune 500 HQ in NY)
| Industry | F500 HQs | Revenue |
|---|---|---|
| Financial Services | 10 | $950B |
|
||
| Consumer Goods | 9 | $162B |
|
||
| Insurance | 4 | $225B |
|
||
| Telecommunications | 2 | $144B |
|
||
| Pharmaceuticals | 2 | $112B |
|
||
| Media / Entertainment | 2 | $69B |
|
||
Price history
1 event — show timeline
- 2026-04-23 Listed $800,000 BNYMLS
Cash-flow waterfall
monthlySold comps — $/sqft
last 12 mo · ≤1 miLoading sold comps…