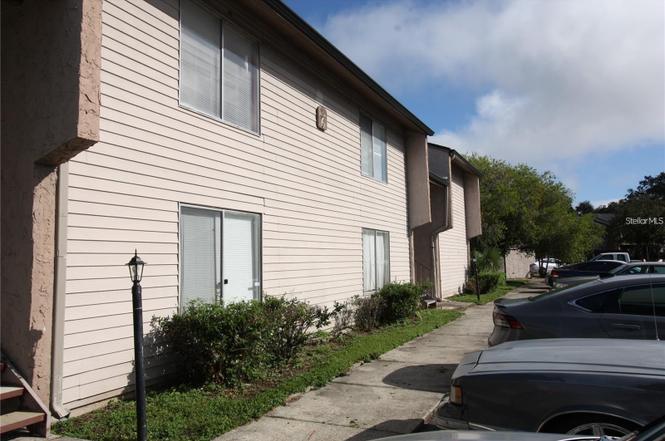
2117 Lyme Bay Dr #604 · Orlando, FL
Flood risk No data
- FEMA flood zone
- —
- Chance of flooding over 30 yrs
- —
- Est. flood insurance / yr
- —
Fire risk No data
- Est. fire insurance / yr
- —
Heat risk No data
- Hot days now (above threshold)
- —
- Hot days in 30 yrs
- —
Wind risk No data
- Chance of severe wind over 30 yrs
- —
Air-quality risk No data
- Unhealthy air days now
- —
- Unhealthy air days in 30 yrs
- —
Risk factors via First Street. Map © Google.
Why this score? — see what drove the C+ grade
The composite is a weighted blend of 9 inputs, each scored 0–100. Each bar is that input's sub-score; the figure is the points it added to the 100-point composite (weight × sub-score).
- Cash flow +22.8/30.0
- 1% rule +10.0/10.0
- ARV discount +7.5/15.0
- DSCR +7.3/10.0
- Livability +4.3/5.0
- Schools +4.1/10.0
- Condition / age +2.5/5.0
- Rent growth +2.4/5.0
- Appreciation +0.0/10.0
$70,000
🖨 Deal sheet 📄 Offer letter ✓ Due diligence
Listing remarks
Investor option or update and move in. One bedroom one full bath. . inside laundry in interior closet. .This condo presents a unique investment opportunity, capable of generating potential income. Its prime location is just minutes away from Universal Studios, downtown Orlando, shopping malls, restaurants, grocery stores, and major roads, including I4. Water and sewer covered by HOA fees. Great opportunity to buy and custom refit to your tastes.
Key facts
- Custom refit
- Prime location
- Inside laundry
Tags
Property features AI
Finance
- Other:
- Financial info: Total annual fees $4,200; No lease restrictions noted
- HOA & community: Monthly condo fee $350 (includes pool, structure maintenance, grounds maintenance, pest control, sewer and water); Clubhouse; Pool; Sidewalks
Exterior
- Parking:
- Security:
- Utilities: Public water; Public sewer; Public utilities
- Home design: Condominium; Residential property; One story (single-level unit); Northeast facing
- Construction: Block construction; Shingle roof; Slab foundation; Built as part of building number 2117
- Exterior features: Balcony; Sidewalk; Sliding doors; Asphalt road access
Interior
- Kitchen: Dishwasher; Range; Refrigerator; Electric water heater
- Bedrooms: 1 bedroom (located on 2nd floor)
- Flooring: Ceramic tile
- Bathrooms: 1 full bathroom
- Heating & cooling: Central heating; Central air conditioning
- Interior features: Eat-in kitchen; Kitchen/family room combo; Window treatments; Blinds; Inside utility
- Laundry & utility: Washer; Dryer; Laundry closet
Neighborhood map
What this means for you Summary
Snapshot
- This is a 1-bed/1.0-bath condo listed at $70k.
Deal economics
- At list price, monthly cash flow is $121 ($1k/yr) — positive.
- The deal already cash-flows at list — no discount required.
- Meets the 1% rule at list price ($1k rent vs $70k).
- Recommended offer: $64k (9.0% below list) — sets the bar for market timing.
- Cap rate 8.4% vs local median 3.0% in Orlando — top-decile yield for the area; either an underpriced asset or a hidden risk that comps aren't pricing in. Stress-test before assuming the spread holds.
Location & tenants
- Location reads 86/100 on livability (#12 in FL, #360 nationally) — a professional / high-income tenant draw. Strengths: amenities A+, commute A+, housing A+.
- Orange (suburban): math 46% / reading 51% proficiency, ranked #43 of 73 in FL (top 59%) — families likely to look elsewhere, expect single-tenant / working-renter base with shorter leases.
- Market conditions: Rents soft (-0.5%/yr); 222 active listings in the ZIP; 27 comparable units currently listed for rent nearby; rentals at typical pace (median 15d on market — plan ~3-4 weeks tenant-placement turnaround); 8,053 units permitted in Orange County in 2024 (3,133 in 5+ unit buildings).
- This rent runs 31% of the median local income ($47k/yr) — at the standard rent-burdened threshold; future hikes will face affordability resistance.
Forward outlook
- Local home prices are declining (-3.0%/yr); year-one equity from $484 of loan paydown is wiped out by about $2k of value loss. Plan a longer hold.
- Orange County population projected at +52% by 2050 — long-run rental-demand tailwind backs the buy-and-hold thesis.
Negotiation context
- It's been on market 112 days — a 9% lower offer ($64k) is reasonable based on typical stale-listing flexibility.
- 7 sale attempts since 3y ago; this cycle's ask has dropped $28k (29%) from the opening price — seller is motivated, your offer sets the floor, not the list.
- Current owner paid $20k; list at $70k implies a 250% gain — meaningful room to come down on a strong offer.
Risks & watch-outs
- Watch-outs: HOA is 29% of rent.
Questions for the listing agent
- It's been on market 112 days. Have you received any prior offers? Is the seller open to a 9% concession, seller financing, or rate buy-down credit?
- Built in 1975 — when were the roof, HVAC, electrical panel, plumbing, and water heater last replaced?
- What does the HOA fee cover, when was the last increase, and are there any pending special assessments or reserve-fund shortfalls?
- Any open or pending special assessments — roof, HVAC, plumbing, elevator, façade? What's the per-unit balance and payoff schedule, and is the seller paying it off at close or rolling it to the buyer?
- Why hasn't it sold? Are there any deal-killer items the seller is aware of (foundation, flood, title, zoning, code violations)?
- Is there a deadline driving the sale (1031 exchange, divorce, estate, relocation)? That informs how much negotiation room exists.
- Schools are B-rated — typically a magnet for longer-tenancy family renters. What's the average tenant stay here, and is there a school-zone premium baked into asking?
- What's the average days-on-market for RENTAL listings here right now (not sales)? A rising rental-DOM trend means longer vacancies and softer asking-rent achievability than the comps imply.
- What's the recent tenant-quality profile in this submarket — average credit score on applications, eviction rate, late-payment / NSF rate, and stable-employment percentage? A property-management company in the area should have these aggregated.
- How much new apartment / multifamily construction is in the pipeline within 1–3 miles? Heavy new supply (>2% of stock underway) typically softens rents 12–24 months out; light construction supports rent growth.
Investment metrics
- 1% rule
- 1.75% ✓
- Cap rate
- 8.37%
- Cash-on-cash
- 7.42%
- DSCR
- 1.33
- GRM
- 4.8
CMA / ARV
No comps found within radius.
Projected returns pro-forma
-3.0% appreciation · 0.0% rent growth · sell at horizon
- IRR
- -10.2%
- Equity multiple
- 0.64×
- Total profit
- $-6,967
- Equity at exit
- $10,437
- IRR
- -9.6%
- Equity multiple
- 0.54×
- Total profit
- $-9,005
- Equity at exit
- $6,052
Cash invested: $19,600 (down + closing). Projections, not guarantees.
Landlord ↔ Tenant lean methodology
- Overall (STATE)
- 87 Strongly Landlord-Friendly
- State Florida
- 87 Strongly Landlord-Friendly · R+3
- County
- — inherits STATE
- City
- — inherits STATE
ZIP-level market 32839
- Home prices YoY
- -20.1%
- Rents YoY
- -0.5%
- Active inventory
- 222
- Price-to-rent
- 4.8×
Monthly cashflow live
- Estimated rent
- $1,224 high interval (Pro) →
- Mortgage (P&I)
- −$367
- Tax from tax record
- −$99 /mo · $1,189/yr
- Insurance
- −$29
- HOA
- −$350
- Vacancy / Maint / Mgmt
- −$257
- Net cashflow
- $121
Break-even live
UW: 25.0% down · 7.5% · 30yr · 1.5% tax · 5.0% vac · 8.0% maint · 8.0% mgmt
Financing live
Cash to close
- Down payment
- $17,500
- Closing costs
- $2,100
- Reserves months
- —
- Total cash needed
- —
Loan-product check · same deal, 3 products live
Conventional
25% down · 7.5% · 30yr
- Down + closing
- —
- Monthly P&I
- —
- Monthly cashflow
- —
- DSCR
- —
- Eligible?
- —
Personal DTI + credit; lowest rate.
DSCR
20% down · 8.5% · 30yr
- Down + closing
- —
- Monthly P&I
- —
- Monthly cashflow
- —
- DSCR
- —
- Eligible?
- —
No personal income docs; deal must DSCR.
Hard money
10% down · 12.0% · 12mo
- Down + closing
- —
- Monthly P&I
- —
- Monthly cashflow
- —
- DSCR
- —
- Eligible?
- —
Short-term bridge; refi at stabilization.
Rent comps 27 comps
| Address | Beds | Baths | Sqft | Rent | $/sqft | DOM | Units | Dist |
|---|---|---|---|---|---|---|---|---|
| 4028 Billingsgate Rd Orlando, FL | 1.0 | 1.0 | 670 | $1,200 | $1.79 | 7d | 1 | 0.04mi |
| 4255 Barwood Dr Orlando, FL | 1.0–3.0 | 1.0–2.5 | 1071 | $1,185 | $1.11 | 4d | 1 | 0.19mi |
| 4308 Lakeway Dr Unit E Orlando, FL | 1.0 | 1.0 | 642 | $1,200 | $1.87 | 23d | 1 | 0.45mi |
| 2636 Lemon Tree Ln #2636 Orlando, FL | 1.0 | 1.0 | 642 | $1,050 | $1.64 | 23d | 1 | 0.50mi |
| 1717 Holden Ave Orlando, FL | 1.0–3.0 | 1.0–2.5 | 980 | $1,049 | $1.07 | 1d | 26 | 0.54mi |
| 4746 Rio Grande Ave Orlando, FL | 1.0–3.0 | 1.0–2.0 | 920 | $1,146 | $1.25 | 1d | 40 | 0.63mi |
| 3024 Rio Grande Ave Orlando, FL | 1.0–3.0 | 1.0–2.0 | 1058 | $1,099 | $1.04 | 23d | 1 | 0.66mi |
| 5028 Park Central Dr #2133 Orlando, FL | 1.0 | 1.0 | 605 | $1,350 | $2.23 | 23d | 1 | 0.69mi |
| 5028 Park Central Dr #2131 Orlando, FL | 1.0 | 1.0 | 605 | $1,290 | $2.13 | 3d | 1 | 0.69mi |
| 5017 City St #1923 Orlando, FL | 1.0 | 1.0 | 724 | $1,500 | $2.07 | 23d | 1 | 0.69mi |
| 2203 Yankee Pl #427 Orlando, FL | 1.0 | 1.0 | 605 | $1,325 | $2.19 | 4d | 1 | 0.76mi |
| 2210 Yankee Pl #316 Orlando, FL | 1.0 | 1.0 | 535 | $1,375 | $2.57 | 23d | 1 | 0.77mi |
| 2210 Yankee Pl #334 Orlando, FL | 1.0 | 1.0 | 535 | $1,195 | $2.23 | 14d | 1 | 0.77mi |
| 4715 Rio Grande Ave Unit 2 Orlando, FL | 1.0 | 1.0 | 750 | $1,195 | $1.59 | 21d | 1 | 0.77mi |
| 1916 Lake Atriums Cir Orlando, FL | 1.0 | 1.0 | 593 | $1,172 | $1.98 | 23d | 4 | 0.81mi |
| 1902 Honour Rd Unit 1902-23 Orlando, FL | 1.0 | 1.0 | 650 | $1,200 | $1.85 | 23d | 1 | 0.81mi |
| 1916 Honour Rd #1 Orlando, FL | 1.0 | 1.0 | 650 | $1,100 | $1.69 | 23d | 1 | 0.82mi |
| 1908 Lake Atriums Cir Orlando, FL | 1.0 | 1.0 | 593 | $1,124 | $1.90 | 23d | 3 | 0.84mi |
| 1940 Lake Atriums Cir Orlando, FL | 1.0 | 1.0 | 593 | $1,225 | $2.07 | 23d | 4 | 0.85mi |
| 1972 Lake Atriums Cir Orlando, FL | 1.0–2.0 | 1.0–2.0 | 695 | $1,150 | $1.65 | 4d | 2 | 0.87mi |
| 1964 Lake Atriums Cir Orlando, FL | 1.0 | 1.0 | 655 | $1,225 | $1.87 | 7d | 3 | 0.89mi |
| 1964 Lake Atriums Cir Orlando, FL | 1.0 | 1.0 | 526 | $1,250 | $2.38 | 10d | 2 | 0.89mi |
| 1980 Lake Fountain Dr Orlando, FL | 1.0–2.0 | 1.0–2.0 | 870 | $1,199 | $1.38 | 2d | 19 | 0.96mi |
| 2437 Americana Blvd Orlando, FL | 2.0 | 1.0–2.0 | 895 | $1,836 | $2.05 | 2d | 16 | 1.03mi |
| 4937 Waterway Ct Orlando, FL | 1.0–2.0 | 1.0–2.0 | 775 | $970 | $1.25 | 1d | 62 | 1.08mi |
| 1019 26th St Orlando, FL | 2.0 | 1.0 | 720 | $1,500 | $2.08 | 23d | 1 | 1.20mi |
| 1968 Lake Heritage Cir Orlando, FL | 1.0–3.0 | 1.0–2.0 | 960 | $1,030 | $1.07 | 1d | 29 | 1.39mi |
HOA detail condo
- Monthly dues
- $350 · $4,200/yr
- Likely covers
- watersewer
- Assessments
- None detected in remarks — confirm with the listing agent.
Listing history 33 events
-
2026-06-18days on market $70,000 Active 112 DOM
-
2026-06-17days on market $70,000 Active 111 DOM
-
2026-06-16days on market $70,000 Active 110 DOM
-
2026-06-15days on market $70,000 Active 109 DOM
-
2026-06-13days on market $70,000 Active 107 DOM
-
2026-06-13days on market $70,000 Active 106 DOM
-
2026-06-09days on market $70,000 Active 103 DOM
-
2026-06-08days on market $70,000 Active 102 DOM
-
2026-06-07days on market $70,000 Active 101 DOM
-
2026-06-04days on market $70,000 Active 98 DOM
-
2026-06-03days on market $70,000 Active 97 DOM
-
2026-06-02days on market $70,000 Active 96 DOM
-
2026-06-02days on market $70,000 Active 95 DOM
-
2026-05-31days on market $70,000 Active 94 DOM
-
2026-03-19price $70,000
-
2026-02-26$98,500 Active
-
2025-11-21historical
-
2025-04-22$94,000 Active
-
2025-03-21historical
-
2025-01-31$97,800 Active
-
2024-07-31historical
-
2024-06-06status Active
-
2024-05-31historical
-
2023-11-28status Active
-
2023-11-08status Pending
-
2023-09-24price $92,600
-
2023-09-06price $86,000
-
2023-08-16price $92,800
-
2023-08-16$93,800 Active
-
2023-08-16historical
-
2023-08-10$92,800 Active
-
2001-08-17soldstatus $20,000
-
1977-09-01soldstatus $17,900
ⓘ Source: listings_history table (triggers on properties + properties_extension) + one-shot
backfill from property_details.listing_events for pre-trigger history.
Tax reassessment forecast FL · Resets to sale price
- Current annual tax
- $1,189 · $99/mo
- Projected year-2 tax
- $1,189 · $99/mo
- Expected delta
- $0/yr ($0/mo · 0.0%)
ⓘ Screening estimate from a state-policy table — verify with the county assessor before closing.
Nearby sold comps map
Loading sold comps map…
Walkable amenities ~0.75 mi
Loading nearby amenities…
Taxation est. · year 1
- Rental income
- $14,682
- − Mortgage interest
- −$3,921
- − Property taxes
- −$1,189
- − Insurance
- −$350
- − Repairs & maintenance
- −$1,175
- − Management
- −$1,175
- − HOA
- −$4,200
- − Depreciation
- −$2,036
- Taxable income
- $636
- Est. tax owed @ 24.0%
- −$153
- After-tax cash flow
- $1,302/yr
For passive investors: Depreciation is non-cash, so a rental often shows a tax loss while cash-flowing — sheltering income. Rental losses are passive: they offset passive income freely, and up to $25,000/yr can offset ordinary (W-2) income if you actively participate and your MAGI is under $100k (phasing out to $0 by $150k); unused losses carry forward. On sale, claimed depreciation is recaptured at up to 25%, and gains may owe capital-gains tax (a 1031 exchange can defer both). Figures are a year-1 estimate at your 24.0% rate — not tax advice; consult a CPA.
Schools (NCES district)
- District
- Orange
- NCES district ID
- 1201440
- Math proficiency
- 46% ▼ -9.00%
- Reading proficiency
- 51% ▼ -2.00%
- Median HH income
- $49,350
- Composite
- 41.47/100
- National rank
- #3461
- State rank
- #43 of 73 in FL
Livability — Orlando
- Score
- 86/100
- State rank
- #12
- US rank
- #360
Category grades
Schools grade is shown separately in the Schools card above.
Census & demographics
- County
- Orange County · 1,471,359 people
- City population
- 964,969
- Metro
- Orlando-Kissimmee-Sanford, FL
- Population (ZIP)
- 53,242
- Household income
- $47,313
- Rent vs Own
- Severe rent burden
- 5337.0
Population outlook (Orange County) Hauer SSP2
- Today (2025)
- 1,618,226 people
- By 2030
- 1,787,404 · +10.5%
- By 2040
- 2,125,621 · +31.4%
- By 2050
- 2,454,016 · +51.6%
- By 2075
- 3,173,711 · +96.1%
- By 2100
- 3,607,781 · +122.9%
Race, ethnicity, and origin ACS 2023
- Neighborhood character
- Diverse neighborhood (Simpson 0.69)
- Race & ethnicity
- Hispanic / Latino 39% Black 35% Two or more races 17% White 16% Asian 4%
- Hispanic origin (detail)
- Mexican 5% Puerto Rican 14% Cuban 2% Dominican 3%
- Common ancestry
- Hispanic 8% Estonian 1% Lithuanian 1%
- Foreign-born
- 30% · Canada, Jamaica, Vietnam
- Languages at home
- 51% English-only · Spanish 33% French/Haitian/Cajun 9% Other Indo-European 2%
Political lean MEDSL · Orange
- 2024 margin
- D (+13.6) · D 56.1% · R 42.5% · Other 1.3%
- 2008→2024 swing
- -5.0pp toward R · 2008: 18.6pp · 2024: 13.6pp
- All cycles
- 2024: D+13.6 2020: D+23.1 2016: D+24.6 2012: D+18.2 2008: D+18.6
Not yet ingested
- Civics
- —
Market trends
- HPI YoY
- ▼ -89.65%
- Current HPI
- 357.4828
- Rent YoY
- ▼ -0.50%
- Metro
- Orlando-Kissimmee-Sanford, FL
- State GDP YoY
- ▲ 3.28%
- F500 in state
- 36
Industry mix (Fortune 500 HQ in FL)
| Industry | F500 HQs | Revenue |
|---|---|---|
| Industrial Technology | 2 | $29B |
|
||
| Insurance | 2 | $17B |
|
||
| Retail | 1 | $60B |
|
||
| Technology Distribution | 1 | $58B |
|
||
| Homebuilding | 1 | $35B |
|
||
| Technology Manufacturing | 1 | $35B |
|
||
Price history
+291.1% since first listed19 events — show timeline
- 2026-03-19 Price Changed $70,000 Stellar MLS as Distributed by MLS Grid
- 2026-02-26 Listed $98,500 Stellar MLS as Distributed by MLS Grid
- 2025-11-21 Listing Removed — Stellar MLS as Distributed by MLS Grid
- 2025-04-22 Listed $94,000 Stellar MLS as Distributed by MLS Grid
- 2025-03-21 Listing Removed — Stellar MLS as Distributed by MLS Grid
- 2025-01-31 Listed $97,800 Stellar MLS as Distributed by MLS Grid
- 2024-07-31 Listing Removed — Stellar MLS as Distributed by MLS Grid
- 2024-06-06 Relisted — Stellar MLS as Distributed by MLS Grid
- 2024-05-31 Listing Removed — Stellar MLS as Distributed by MLS Grid
- 2023-11-28 Relisted — Stellar MLS as Distributed by MLS Grid
- 2023-11-08 Pending — Stellar MLS as Distributed by MLS Grid
- 2023-09-24 Price Changed $92,600 Stellar MLS as Distributed by MLS Grid
- 2023-09-06 Price Changed $86,000 Stellar MLS as Distributed by MLS Grid
- 2023-08-16 Price Changed $92,800 Stellar MLS as Distributed by MLS Grid
- 2023-08-16 Listing Removed — Stellar MLS as Distributed by MLS Grid
- 2023-08-16 Listed $93,800 Stellar MLS as Distributed by MLS Grid
- 2023-08-10 Listed $92,800 Stellar MLS as Distributed by MLS Grid
- 2001-08-17 Sold (Public Records) $20,000 Public Records
- 1977-09-01 Sold (Public Records) $17,900 Public Records
Property tax history
+16.0%/yrLatest (2025): $1,189 · -0.1% YoY. Source: county tax records.
Cash-flow waterfall
monthlySold comps — $/sqft
last 12 mo · ≤1 miLoading sold comps…