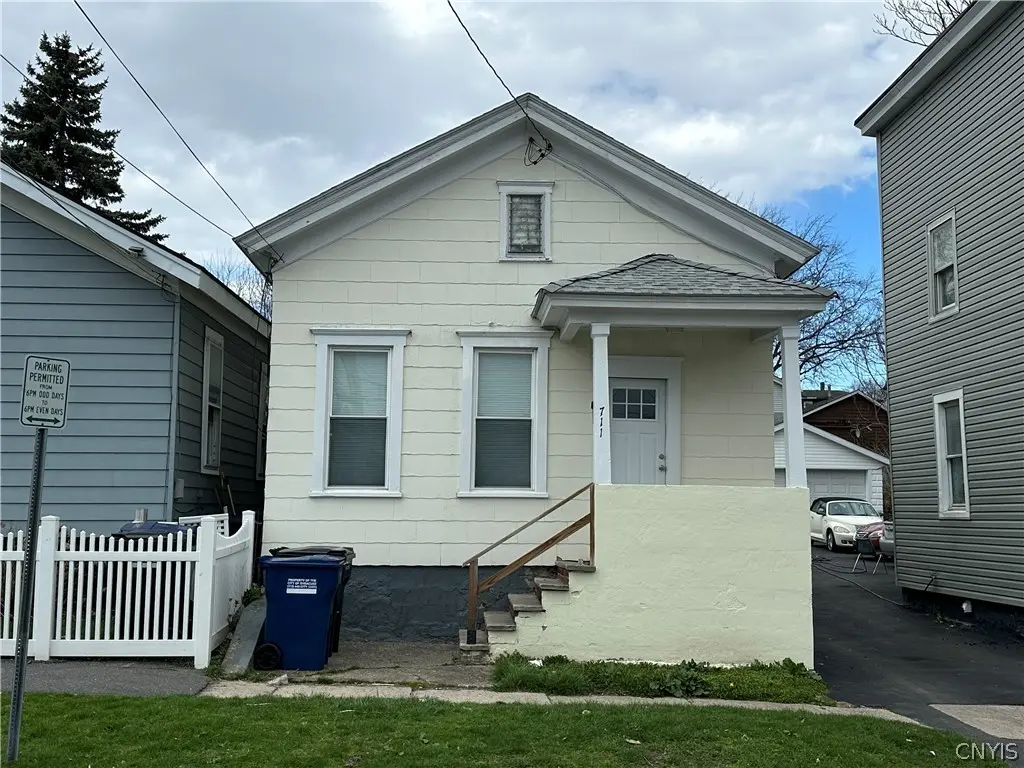
711 E Division St · Syracuse, NY
Flood risk 1/10 · Minimal
- FEMA flood zone
- X (unshaded)
- Chance of flooding over 30 yrs
- 0.0%
- Est. flood insurance / yr
- $473 – $860
Fire risk 1/10 · Minimal
- Est. fire insurance / yr
- $691 – $1,283
Heat risk 3/10 · Minor
- Hot days now (above 95°F)
- 7 days/yr
- Hot days in 30 yrs
- 16 days/yr
Wind risk 1/10 · Minimal
- Chance of severe wind over 30 yrs
- —
Air-quality risk 2/10 · Minimal
- Unhealthy air days now
- 0 days/yr
- Unhealthy air days in 30 yrs
- 1 days/yr
Risk factors via First Street. Map © Google.
Why this score? — see what drove the B+ grade
The composite is a weighted blend of 9 inputs, each scored 0–100. Each bar is that input's sub-score; the figure is the points it added to the 100-point composite (weight × sub-score).
- Cash flow +30.0/30.0
- ARV discount +10.7/15.0
- DSCR +10.0/10.0
- Appreciation +10.0/10.0
- 1% rule +7.8/10.0
- Livability +3.9/5.0
- Rent growth +2.5/5.0
- Condition / age +2.5/5.0
- Schools +1.8/10.0
$119,000
🖨 Deal sheet 📄 Offer letter ✓ Due diligence
Listing remarks
This Northside 3 Bedroom, 1 Bath is in good condition and would make a great addition to your investment portfolio. If you're thinking about starting in the rental market this small easy to manage single family property already has a great tenant.
Key facts
- 3,484 sq ft lot
- Garage
- Built 1900
Property features AI
Exterior
- Parking: Detached 1-car garage; Shared driveway
- Utilities: Public water (connected); Sewer connected; Cable available; Electric with circuit breakers
- Home design: Single-story home; Existing structure
- Construction: Fiber cement and stucco exterior; Copper plumbing; Asphalt shingle roof; Block and stone foundation; Built (existing)
- Exterior features: Blacktop driveway; Partial fencing; Fence
Interior
- Kitchen: Free-standing range; Gas cooktop; Gas oven; Gas range; Oven; Refrigerator
- Bedrooms: Three main-level bedrooms; Bedroom on main level
- Flooring: Carpet; Laminate; Varies
- Bathrooms: One full bathroom (main level)
- Heating & cooling: Gas forced-air heating
- Interior features: Separate/formal dining room; Eat-in kitchen; Separate/formal living room
- Laundry & utility: Main-level laundry
Neighborhood map
What this means for you Summary
Snapshot
- This is a 2-bed/1.0-bath single-family listed at $119k.
Deal economics
- At list price, monthly cash flow is $461 ($6k/yr) — positive.
- The deal already cash-flows at list — no discount required.
- Meets the 1% rule at list price ($2k rent vs $119k).
- Recommended offer: $117k (1.5% below list) — sets the bar for market timing.
- Cap rate 10.9% vs local median 8.2% in Syracuse — top-decile yield for the area; either an underpriced asset or a hidden risk that comps aren't pricing in. Stress-test before assuming the spread holds.
Location & tenants
- Location reads 77/100 on livability (#187 in NY, #2,869 nationally) — a middle-class / working-renter tenant base. Strengths: amenities A+, commute A+, cost of living A+; Watch: schools D+, crime F, employment D-.
- Syracuse City School District (urban): math 18% / reading 26% proficiency, ranked #590 of 590 in NY (top 100%) — low school quality limits family demand, transient renter base, plan for 1-2y turnover; 74% free/reduced lunch — lower-income household profile, screen leases tightly.
- Market conditions: 99 active listings in the ZIP; 40 comparable units currently listed for rent nearby; rentals lingering (median 44d on market — plan ~5-8 weeks vacancy on turnover, expect pricing pressure); 55% of comp listings sitting > 30 days — soft ceiling on asking rent; lower-income renter base — watch delinquency; 616 units permitted in Onondaga County in 2024 (256 in 5+ unit buildings).
- This rent runs 41% of the median local income ($45k/yr) — at the standard rent-burdened threshold; future hikes will face affordability resistance.
Forward outlook
- In year one you build about $13k of equity ($823 loan paydown + $12k appreciation (10.0% local appreciation)).
- Onondaga County population projected to shrink 9% by 2050 — rents likely to lag national; underwrite the cash flow, not the appreciation.
- At projected returns (10.0% appreciation + 3.0% rent growth), your $33k cash investment doubles in ~2 years — after that, you're playing with house money.
- By year 3, paydown + projected appreciation supports a ~$32k cash-out refi (75% LTV) — recoverable capital for the next deal without selling this one.
Negotiation context
- It's been on market 21 days — a 2% lower offer ($117k) is reasonable based on typical stale-listing flexibility.
- 2 sale attempts with the ask held roughly flat each time — persistent listings suggest the price (not the market) is what's stuck; bring a comps-based counter.
- Current owner paid $30k; list at $119k implies a 297% gain — meaningful room to come down on a strong offer.
Risks & watch-outs
- Watch-outs: built in 1900 — expect roof / HVAC / electrical / plumbing capex.
Questions for the listing agent
- Built in 1900 — when were the roof, HVAC, electrical panel, plumbing, and water heater last replaced?
- Is there a deadline driving the sale (1031 exchange, divorce, estate, relocation)? That informs how much negotiation room exists.
- Schools are D-rated, which usually means shorter tenancies and higher turnover. Who's the typical renter profile here, and what's been the actual vacancy rate?
- Crime grade is F in this area — have there been break-ins, vandalism, or insurance claims at this property in the last 3 years? What carrier currently insures it and at what premium?
- What's the average days-on-market for RENTAL listings here right now (not sales)? A rising rental-DOM trend means longer vacancies and softer asking-rent achievability than the comps imply.
- What's the recent tenant-quality profile in this submarket — average credit score on applications, eviction rate, late-payment / NSF rate, and stable-employment percentage? A property-management company in the area should have these aggregated.
- How much new for-sale + rental construction is in the pipeline within 1–3 miles? Heavy new supply typically softens prices + rents 12–24 months out; constrained supply supports both.
Investment metrics
- 1% rule
- 1.28% ✓
- Cap rate
- 10.94%
- Cash-on-cash
- 16.61%
- DSCR
- 1.74
- GRM
- 6.5
CMA / ARV
- ARV (on-the-fly)
- $128,232
- Comps found
- 12
Show comp detail 12 sales within ~0.75 mi
| Address | Dist | Beds/Ba | Sqft | Sold | Price | $/sf | Match |
|---|---|---|---|---|---|---|---|
| 116 Steuben St | 0.26mi | 3/1.0 (+1) | 1,104 (+1%) | 8mo | $90,000 | $82 | 74 |
| 231 Grumbach Ave | 0.40mi | 3/1.0 (+1) | 1,152 (+5%) | 0mo | $75,000 | $65 | 67 |
| 119 Lawrence St | 0.32mi | 3/1.0 (+1) | 1,008 (-8%) | 3mo | $130,000 | $129 | 64 |
| 1212 Butternut St | 0.27mi | 3/1.0 (+1) | 1,000 (-9%) | 5mo | $75,000 | $75 | 64 |
| 807 E Division St | 0.07mi | 3/2.0 (+1) | 952 (-13%) | 4mo | $70,000 | $74 | 62 |
| 131 Delong Ave | 0.44mi | 2/1.0 | 984 (-10%) | 5mo | $90,000 | $91 | 58 |
| 339 Douglas St | 0.53mi | 3/1.0 (+1) | 1,003 (-8%) | 2mo | $55,000 | $55 | 55 |
| 621 Dewitt St | 0.70mi | 3/1.0 (+1) | 1,113 (+2%) | 9mo | $190,000 | $171 | 52 |
| 2363 Grant Blvd | 0.57mi | 2/1.0 | 1,215 (+11%) | 5mo | $153,700 | $127 | 51 |
| 132 Worden Ave | 0.68mi | 3/1.0 (+1) | 1,056 (-4%) | 8mo | $175,000 | $166 | 50 |
| 205 Hood Ave | 0.67mi | 2/1.0 | 1,008 (-8%) | 8mo | $175,000 | $174 | 48 |
| 928 Kirkpatrick St N | 0.55mi | 3/1.0 (+1) | 1,236 (+13%) | 0mo | $145,000 | $117 | 48 |
Match score weights: distance 35% · size 25% · config 20% · recency 20%. Top-matched comps best support the ARV.
Projected returns pro-forma
10.0% appreciation · 3.0% rent growth · sell at horizon
- IRR
- 36.6%
- Equity multiple
- 3.83×
- Total profit
- $94,163
- Equity at exit
- $107,205
- IRR
- 31.5%
- Equity multiple
- 8.63×
- Total profit
- $254,131
- Equity at exit
- $231,191
Cash invested: $33,320 (down + closing). Projections, not guarantees.
Landlord ↔ Tenant lean methodology
- Overall (STATE)
- 15 Strongly Tenant-Friendly
- State New York
- 15 Strongly Tenant-Friendly · D+10
- County
- — inherits STATE
- City
- — inherits STATE
ZIP-level market 13208
- Home prices YoY
- 8.4%
- Active inventory
- 99
- Price-to-rent
- 6.5×
Monthly cashflow live
- Estimated rent
- $1,519 high interval (Pro) →
- Mortgage (P&I)
- −$624
- Tax from tax record
- −$65 /mo · $778/yr
- Insurance
- −$50
- HOA
- −$0
- Vacancy / Maint / Mgmt
- −$319
- Net cashflow
- $461
Break-even live
UW: 25.0% down · 7.5% · 30yr · 1.5% tax · 5.0% vac · 8.0% maint · 8.0% mgmt
Financing live
Cash to close
- Down payment
- $29,750
- Closing costs
- $3,570
- Reserves months
- —
- Total cash needed
- —
Loan-product check · same deal, 3 products live
Conventional
25% down · 7.5% · 30yr
- Down + closing
- —
- Monthly P&I
- —
- Monthly cashflow
- —
- DSCR
- —
- Eligible?
- —
Personal DTI + credit; lowest rate.
DSCR
20% down · 8.5% · 30yr
- Down + closing
- —
- Monthly P&I
- —
- Monthly cashflow
- —
- DSCR
- —
- Eligible?
- —
No personal income docs; deal must DSCR.
Hard money
10% down · 12.0% · 12mo
- Down + closing
- —
- Monthly P&I
- —
- Monthly cashflow
- —
- DSCR
- —
- Eligible?
- —
Short-term bridge; refi at stabilization.
Rent comps 40 comps
| Address | Beds | Baths | Sqft | Rent | $/sqft | DOM | Units | Dist |
|---|---|---|---|---|---|---|---|---|
| 912 Park St Unit 1 Syracuse, NY | 3.0 | 1.0 | 1040 | $1,200 | $1.15 | 43d | 1 | 0.03mi |
| 610 E Division St Unit F2 Syracuse, NY | 2.0 | 1.0 | 900 | $1,150 | $1.28 | 43d | 1 | 0.21mi |
| 746 E Laurel St Unit 2F Syracuse, NY | 2.0 | 1.0 | 800 | $1,100 | $1.38 | 43d | 1 | 0.35mi |
| 807-13 N Salina St Unit 809A Syracuse, NY | 2.0 | 1.0 | 1020 | $1,325 | $1.30 | 43d | 1 | 0.40mi |
| 205 Beecher St Unit 3 Syracuse, NY | 2.0 | 1.0 | 815 | $1,100 | $1.35 | 43d | 1 | 0.46mi |
| 517 N Salina St Unit 4 Syracuse, NY | 2.0 | 1.0 | 700 | $1,050 | $1.50 | 13d | 1 | 0.52mi |
| 126 Woodruff Ave Syracuse, NY | 3.0 | 1.0 | 1200 | $1,675 | $1.40 | 43d | 1 | 0.61mi |
| 721 N Clinton St Unit 105 Syracuse, NY | 2.0 | 2.0 | 1000 | $1,475 | $1.48 | 43d | 1 | 0.61mi |
| 721 N Clinton St Unit 213 Syracuse, NY | 2.0 | 2.0 | 1000 | $1,550 | $1.55 | 43d | 1 | 0.61mi |
| 210 W Division St Unit 24 Syracuse, NY | 2.0 | 2.0 | 1200 | $1,850 | $1.54 | 21d | 1 | 0.62mi |
| 689 N Clinton St Apt 307 Syracuse, NY | 1.0 | 1.5 | 1100 | $1,600 | $1.45 | 43d | 1 | 0.63mi |
| 689 N Clinton St Unit 323 Syracuse, NY | 1.0 | 1.5 | 960 | $1,575 | $1.64 | 21d | 1 | 0.63mi |
| 210 W Division St Unit 87 Syracuse, NY | 2.0 | 2.0 | 1200 | $1,750 | $1.46 | 43d | 1 | 0.63mi |
| 416 Pearl St Unit 2 Syracuse, NY | 3.0 | 1.0 | 900 | $2,400 | $2.67 | 13d | 1 | 0.74mi |
| 1507 N Salina St Unit 3 Syracuse, NY | 3.0 | 2.0 | 1030 | $1,350 | $1.31 | 43d | 1 | 0.78mi |
| 205A Hawley Ave Unit 211C Syracuse, NY | 3.0 | 2.5 | 1350 | $1,675 | $1.24 | 43d | 1 | 0.83mi |
| 205A Hawley Ave Unit 213C Syracuse, NY | 3.0 | 2.5 | 1350 | $1,650 | $1.22 | 43d | 1 | 0.83mi |
| 286 Ross Park Syracuse, NY | 3.0 | 1.0 | 1100 | $1,500 | $1.36 | 44d | 1 | 0.85mi |
| 373 Spencer St Unit 303 Syracuse, NY | 2.0 | 1.5 | 1085 | $1,850 | $1.71 | 43d | 1 | 0.88mi |
| 230 W Willow St Apt 310 Syracuse, NY | 1.0 | 1.0 | 933 | $1,600 | $1.71 | 13d | 1 | 0.90mi |
| 101 N Salina St Apt 112 Syracuse, NY | 1.0 | 1.0 | 791 | $1,950 | $2.47 | 13d | 1 | 0.90mi |
| 101 N Salina St Apt 109 Syracuse, NY | 1.0 | 1.0 | 769 | $1,900 | $2.47 | 13d | 1 | 0.90mi |
| 101 N Salina St Unit 107 Syracuse, NY | 1.0 | 1.0 | 791 | $1,825 | $2.31 | 13d | 1 | 0.90mi |
| 200 Catherine St Apt 5 Syracuse, NY | 2.0 | 1.0 | 850 | $1,550 | $1.82 | 43d | 1 | 0.92mi |
| 525 Burnet Ave Unit First Floor Syracuse, NY | 3.0 | 1.0 | 900 | $1,650 | $1.83 | 43d | 1 | 1.01mi |
| 208 W Water St Syracuse, NY | 2.0 | 2.0 | 962 | $1,800 | $1.87 | 43d | 1 | 1.04mi |
| 101 S Salina St Syracuse, NY | 2.0 | 1.0 | 651 | $2,871 | $4.41 | 13d | 14 | 1.06mi |
| 324 W Water St Unit 106 Syracuse, NY | 2.0 | 1.0 | 1436 | $2,095 | $1.46 | 21d | 1 | 1.10mi |
| 324 W Water St Syracuse, NY | 2.0 | 1.0 | 1007 | $1,975 | $1.96 | 13d | 6 | 1.10mi |
| 129 W Fayette St Unit 217 Syracuse, NY | 2.0 | 2.0 | 1100 | $1,550 | $1.41 | 13d | 1 | 1.17mi |
| 1618 James St #3 Syracuse, NY | 2.0 | 1.0 | 1150 | $2,200 | $1.91 | 13d | 1 | 1.17mi |
| 321 S Salina St Unit 403 Syracuse, NY | 1.0 | 1.0 | 978 | $1,750 | $1.79 | 21d | 1 | 1.18mi |
| 321 S Salina St Unit 203 Syracuse, NY | 1.0 | 1.0 | 1236 | $2,000 | $1.62 | 21d | 1 | 1.19mi |
| 321 S Salina St Unit 303 Syracuse, NY | 1.0 | 1.0 | 978 | $1,800 | $1.84 | 43d | 1 | 1.19mi |
| 321 S Salina St Unit 402 Syracuse, NY | 1.0 | 1.0 | 1050 | $2,200 | $2.10 | 13d | 1 | 1.19mi |
| 321 S Salina St Unit 201 Syracuse, NY | 2.0 | 1.0 | 1446 | $2,450 | $1.69 | 43d | 1 | 1.19mi |
| 321 S Salina St Unit 502 Syracuse, NY | 1.0 | 1.0 | 1050 | $2,500 | $2.38 | 43d | 1 | 1.19mi |
| 321 S Salina St Unit 501 Syracuse, NY | 2.0 | 1.0 | 1446 | $3,000 | $2.07 | 43d | 1 | 1.19mi |
| 317 S Clinton St Unit 4A Syracuse, NY | 2.0 | 1.5 | 1500 | $2,100 | $1.40 | 13d | 1 | 1.19mi |
| 317 S Clinton St Unit 3C/B3 Syracuse, NY | 1.0 | 1.0 | 700 | $1,675 | $2.39 | 13d | 1 | 1.19mi |
Listing history 21 events
-
2026-06-18days on market $119,000 Active 21 DOM
-
2026-06-17days on market $119,000 Active 20 DOM
-
2026-06-16days on market $119,000 Active 19 DOM
-
2026-06-15days on market $119,000 Active 18 DOM
-
2026-06-14days on market $119,000 Active 16 DOM
-
2026-06-13days on market $119,000 Active 15 DOM
-
2026-06-10days on market $119,000 Active 13 DOM
-
2026-06-09days on market $119,000 Active 12 DOM
-
2026-06-08days on market $119,000 Active 11 DOM
-
2026-06-07days on market $119,000 Active 10 DOM
-
2026-06-05days on market $119,000 Active 7 DOM
-
2026-06-02days on market $119,000 Active 5 DOM
-
2026-06-01days on market $119,000 Active 4 DOM
-
2026-05-31days on market $119,000 Active 3 DOM
-
2026-05-30days on market $119,000 Active 2 DOM
-
2026-05-28$119,000 Active
-
2025-10-17historical
-
2025-04-17$119,000 Active
-
2009-08-10soldstatus $30,000
-
2006-12-04soldstatus $10,100
-
1997-01-02soldstatus $30,000
ⓘ Source: listings_history table (triggers on properties + properties_extension) + one-shot
backfill from property_details.listing_events for pre-trigger history.
Tax reassessment forecast NY · Partial reset (capped growth)
- Current annual tax
- $778 · $65/mo
- Projected year-2 tax
- $1,394 · $116/mo
- Expected delta
- +$617/yr (+$51/mo · 79.3%)
ⓘ Screening estimate from a state-policy table — verify with the county assessor before closing.
Climate risk First Street
- Flood 1/10 Low FEMA zone X (unshaded) · 0% chance over 30 yrs
- Wildfire 1/10 Low
- Heat 3/10 Moderate 7 d/yr ≥95°F today · 16 d/yr by 30 yrs out
- Wind 1/10 Low
- Air quality 2/10 Low 0 unhealthy d/yr today · 1 by 30 yrs out
Nearby sold comps map
Loading sold comps map…
Walkable amenities ~0.75 mi
Loading nearby amenities…
Taxation est. · year 1
- Rental income
- $18,224
- − Mortgage interest
- −$6,666
- − Property taxes
- −$778
- − Insurance
- −$595
- − Repairs & maintenance
- −$1,458
- − Management
- −$1,458
- − Depreciation
- −$3,462
- Taxable income
- $3,808
- Est. tax owed @ 24.0%
- −$914
- After-tax cash flow
- $4,622/yr
For passive investors: Depreciation is non-cash, so a rental often shows a tax loss while cash-flowing — sheltering income. Rental losses are passive: they offset passive income freely, and up to $25,000/yr can offset ordinary (W-2) income if you actively participate and your MAGI is under $100k (phasing out to $0 by $150k); unused losses carry forward. On sale, claimed depreciation is recaptured at up to 25%, and gains may owe capital-gains tax (a 1031 exchange can defer both). Figures are a year-1 estimate at your 24.0% rate — not tax advice; consult a CPA.
Schools (NCES district)
- District
- Syracuse City School District
- NCES district ID
- 3628590
- Math proficiency
- 18% ▼ -5.00%
- Reading proficiency
- 26% ▬ 0.00%
- Median HH income
- $32,097
- Composite
- 17.83/100
- National rank
- #9007
- State rank
- #590 of 590 in NY
Livability — Syracuse
- Score
- 77/100
- State rank
- #187
- US rank
- #2869
Category grades
Schools grade is shown separately in the Schools card above.
Census & demographics
- Census place
- Syracuse, NY
- County
- Onondaga County · 247,257 people
- City population
- 152,627
- Metro
- Syracuse, NY
- Population (ZIP)
- 22,993
- Household income
- $44,712
- Rent vs Own
- Severe rent burden
- 1437.0
Population outlook (Onondaga County) Hauer SSP2
- Today (2025)
- 467,894 people
- By 2030
- 463,381 · -1.0%
- By 2040
- 447,697 · -4.3%
- By 2050
- 426,399 · -8.9%
- By 2075
- 373,661 · -20.1%
- By 2100
- 307,967 · -34.2%
Race, ethnicity, and origin ACS 2023
- Neighborhood character
- Highly diverse neighborhood (Simpson 0.70)
- Race & ethnicity
- White 46% Black 24% Asian 14% Two or more races 10% Hispanic / Latino 6%
- Hispanic origin (detail)
- Puerto Rican 4% Dominican 1%
- Common ancestry
- Romanian 3% Swedish 3% Italian 1%
- Foreign-born
- 22% · Vietnam, Philippines, Canada
- Languages at home
- 70% English-only · Spanish 6% Other Asian/Pacific 5% Vietnamese 4%
Political lean MEDSL · Onondaga
- 2024 margin
- D (+17.3) · D 58.6% · R 41.4%
- 2008→2024 swing
- -3.0pp toward R · 2008: 20.3pp · 2024: 17.3pp
- All cycles
- 2024: D+17.3 2020: D+20.6 2016: D+12.8 2012: D+21.1 2008: D+20.3
Not yet ingested
- Civics
- —
Market trends
- HPI YoY
- ▲ 30.91%
- Current HPI
- 399.3284
- Rent YoY
- —
- Metro
- Syracuse, NY
- State GDP YoY
- ▲ 2.60%
- F500 in state
- 92
Industry mix (Fortune 500 HQ in NY)
| Industry | F500 HQs | Revenue |
|---|---|---|
| Financial Services | 10 | $950B |
|
||
| Consumer Goods | 9 | $162B |
|
||
| Insurance | 4 | $225B |
|
||
| Telecommunications | 2 | $144B |
|
||
| Pharmaceuticals | 2 | $112B |
|
||
| Media / Entertainment | 2 | $69B |
|
||
Price history
+296.7% since first listed6 events — show timeline
- 2026-05-28 Listed $119,000 CNYIS
- 2025-10-17 Listing Removed — CNYIS
- 2025-04-17 Listed $119,000 CNYIS
- 2009-08-10 Sold (Public Records) $30,000 Public Records
- 2006-12-04 Sold (Public Records) $10,100 Public Records
- 1997-01-02 Sold (Public Records) $30,000 Public Records
Property tax history
+0.7%/yrLatest (2025): $778 · +0.0% YoY. Source: county tax records.
Cash-flow waterfall
monthlySold comps — $/sqft
last 12 mo · ≤1 miLoading sold comps…