8425 Phil Pl · Vinton, TX
Flood risk No data
- FEMA flood zone
- —
- Chance of flooding over 30 yrs
- —
- Est. flood insurance / yr
- —
Fire risk No data
- Est. fire insurance / yr
- —
Heat risk No data
- Hot days now (above threshold)
- —
- Hot days in 30 yrs
- —
Wind risk No data
- Chance of severe wind over 30 yrs
- —
Air-quality risk No data
- Unhealthy air days now
- —
- Unhealthy air days in 30 yrs
- —
Risk factors via First Street. Map © Google.
Why this score? — see what drove the D grade
The composite is a weighted blend of 9 inputs, each scored 0–100. Each bar is that input's sub-score; the figure is the points it added to the 100-point composite (weight × sub-score).
- Cash flow +11.7/30.0
- ARV discount +7.5/15.0
- Appreciation +6.3/10.0
- DSCR +3.4/10.0
- Livability +3.0/5.0
- Schools +2.9/10.0
- Rent growth +2.5/5.0
- Condition / age +2.5/5.0
- 1% rule +2.3/10.0
$289,950
🖨 Deal sheet 📄 Offer letter ✓ Due diligence
Listing remarks MLS
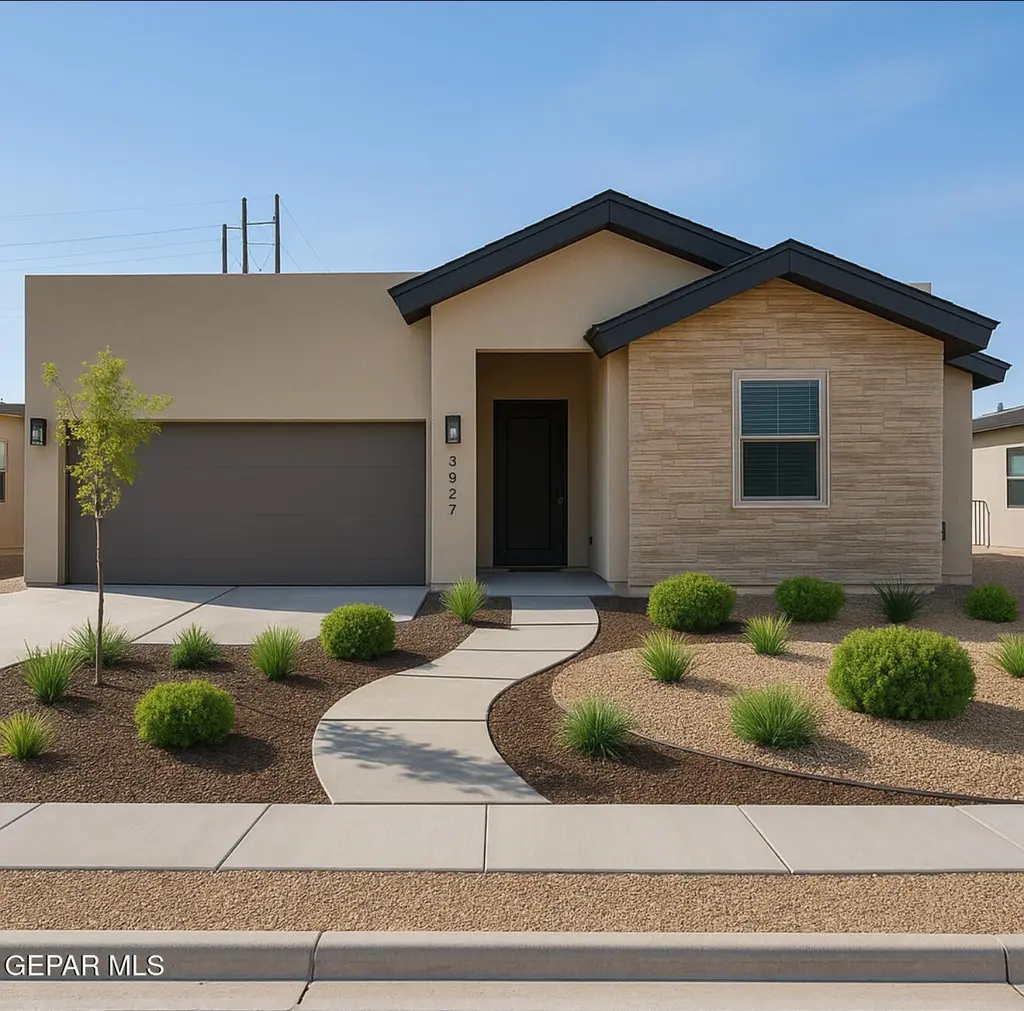
This charming farmhouse-style home features an inviting open floor plan with three spacious bedrooms and 2.5 baths, designed for comfort and everyday living. Enjoy a generous backyard perfect for relaxing or entertaining, along with modern touches that make it truly feel like home. Conveniently located with easy access to major highways, popular restaurants, outlet malls, and entertainment, this home offers the perfect blend of style, space, and accessibility.
Key facts
- 5,981 sq ft lot
- 2 garage spots
- Built 2026
Neighborhood map
What this means for you Summary
Snapshot
- This is a 3-bed/2.5-bath land listed at $290k.
Deal economics
- At list price, monthly cash flow is $-87 ($-1k/yr) — negative.
- To cash-flow at today's rent, offer at most $275k (5.3% below list).
- To meet the 1% rule (rent ≥ 1% of price), the offer needs to be $212k (26.8% below list).
- Recommended offer: $212k (26.8% below list) — sets the bar for 1% rule.
Location & tenants
- Location reads 59/100 on livability (#1,135 in TX) — a working-class tenant base; expect higher turnover. Strengths: cost of living A+, housing A+, crime A-; Watch: schools F, amenities F, commute F.
- Canutillo ISD (other): math 28% / reading 39% proficiency, ranked #542 of 826 in TX (top 66%) — families likely to look elsewhere, expect single-tenant / working-renter base with shorter leases; 71% free/reduced lunch — lower-income household profile, screen leases tightly.
- Market conditions: 30 active listings in the ZIP; 2 comparable units currently listed for rent nearby; 2,196 units permitted in El Paso County in 2024 (143 in 5+ unit buildings).
Forward outlook
- In year one you build about $10k of equity ($2k loan paydown + $8k appreciation (2.7% local appreciation)).
- El Paso County population projected at +10% by 2050 — modest demand growth; plan on rents tracking national, not racing it.
- By year 4, paydown + projected appreciation supports a ~$33k cash-out refi (75% LTV) — recoverable capital for the next deal without selling this one.
Negotiation context
- It's been on market 86 days — a 6% lower offer ($273k) is reasonable based on typical stale-listing flexibility.
Questions for the listing agent
- What do current leases actually rent for vs. the listed asking? Can we see a recent rent roll and the last 12 months of T-12 income?
- It's been on market 86 days. Have you received any prior offers? Is the seller open to a 27% concession, seller financing, or rate buy-down credit?
- Why hasn't it sold? Are there any deal-killer items the seller is aware of (foundation, flood, title, zoning, code violations)?
- Is there a deadline driving the sale (1031 exchange, divorce, estate, relocation)? That informs how much negotiation room exists.
- Schools are F-rated, which usually means shorter tenancies and higher turnover. Who's the typical renter profile here, and what's been the actual vacancy rate?
- The area grade is low — what's the realistic commute time and amenity access for the typical tenant pool here? Any planned neighborhood developments (good or bad) we should know about?
- What's the average days-on-market for RENTAL listings here right now (not sales)? A rising rental-DOM trend means longer vacancies and softer asking-rent achievability than the comps imply.
- What's the recent tenant-quality profile in this submarket — average credit score on applications, eviction rate, late-payment / NSF rate, and stable-employment percentage? A property-management company in the area should have these aggregated.
- How much new for-sale + rental construction is in the pipeline within 1–3 miles? Heavy new supply typically softens prices + rents 12–24 months out; constrained supply supports both.
Investment metrics
- 1% rule
- 0.73% ✗
- Cap rate
- 5.93%
- Cash-on-cash
- -1.28%
- DSCR
- 0.94
- GRM
- 11.4
CMA / ARV
No comps found within radius.
Projected returns pro-forma
2.69% appreciation · 3.0% rent growth · sell at horizon
- IRR
- 5.4%
- Equity multiple
- 1.30×
- Total profit
- $24,542
- Equity at exit
- $125,312
- IRR
- 8.5%
- Equity multiple
- 2.24×
- Total profit
- $100,968
- Equity at exit
- $189,274
Cash invested: $81,186 (down + closing). Projections, not guarantees.
Landlord ↔ Tenant lean methodology
- Overall (STATE)
- 87 Strongly Landlord-Friendly
- State Texas
- 87 Strongly Landlord-Friendly · R+5
- County
- — inherits STATE
- City
- — inherits STATE
ZIP-level market 79821
- Home prices YoY
- 1.3%
- Active inventory
- 30
- Price-to-rent
- 11.4×
Monthly cashflow live
- Estimated rent
- $2,122 medium interval (Pro) →
- Mortgage (P&I)
- −$1,521
- Tax from tax record
- −$121 /mo · $1,457/yr
- Insurance
- −$121
- HOA
- −$0
- Vacancy / Maint / Mgmt
- −$446
- Net cashflow
- $-87
Break-even live
UW: 25.0% down · 7.5% · 30yr · 1.5% tax · 5.0% vac · 8.0% maint · 8.0% mgmt
Financing live
Cash to close
- Down payment
- $72,488
- Closing costs
- $8,698
- Reserves months
- —
- Total cash needed
- —
Loan-product check · same deal, 3 products live
Conventional
25% down · 7.5% · 30yr
- Down + closing
- —
- Monthly P&I
- —
- Monthly cashflow
- —
- DSCR
- —
- Eligible?
- —
Personal DTI + credit; lowest rate.
DSCR
20% down · 8.5% · 30yr
- Down + closing
- —
- Monthly P&I
- —
- Monthly cashflow
- —
- DSCR
- —
- Eligible?
- —
No personal income docs; deal must DSCR.
Hard money
10% down · 12.0% · 12mo
- Down + closing
- —
- Monthly P&I
- —
- Monthly cashflow
- —
- DSCR
- —
- Eligible?
- —
Short-term bridge; refi at stabilization.
Rent comps 2 comps
| Address | Beds | Baths | Sqft | Rent | $/sqft | DOM | Units | Dist |
|---|---|---|---|---|---|---|---|---|
| 355 Sol Ct Vinton, TX | 4.0 | 3.0 | 1932 | $2,100 | $1.09 | 23d | 1 | 0.39mi |
| 7409 Scarlet Oak Pl Canutillo, TX | 4.0 | 3.0 | 1920 | $2,200 | $1.15 | 43d | 1 | 1.39mi |
Listing history 16 events
-
2026-06-18days on market $289,950 Active 86 DOM
-
2026-06-17days on market $289,950 Active 85 DOM
-
2026-06-16days on market $289,950 Active 84 DOM
-
2026-06-15days on market $289,950 Active 83 DOM
-
2026-06-13days on market $289,950 Active 81 DOM
-
2026-06-10days on market $289,950 Active 78 DOM
-
2026-06-09days on market $289,950 Active 77 DOM
-
2026-06-08days on market $289,950 Active 76 DOM
-
2026-06-07days on market $289,950 Active 75 DOM
-
2026-06-05days on market $289,950 Active 72 DOM
-
2026-06-03days on market $289,950 Active 71 DOM
-
2026-06-03days on market $289,950 Active 70 DOM
-
2026-06-01days on market $289,950 Active 69 DOM
-
2026-05-31days on market $289,950 Active 68 DOM
-
2026-04-23price $289,950 464-char remark
Show marketing remark (464 chars)
This charming farmhouse-style home features an inviting open floor plan with three spacious bedrooms and 2.5 baths, designed for comfort and everyday living. Enjoy a generous backyard perfect for relaxing or entertaining, along with modern touches that make it truly feel like home. Conveniently located with easy access to major highways, popular restaurants, outlet malls, and entertainment, this home offers the perfect blend of style, space, and accessibility.
-
2026-03-24$287,950 Active 464-char remark
Show marketing remark (464 chars)
This charming farmhouse-style home features an inviting open floor plan with three spacious bedrooms and 2.5 baths, designed for comfort and everyday living. Enjoy a generous backyard perfect for relaxing or entertaining, along with modern touches that make it truly feel like home. Conveniently located with easy access to major highways, popular restaurants, outlet malls, and entertainment, this home offers the perfect blend of style, space, and accessibility.
ⓘ Source: listings_history table (triggers on properties + properties_extension) + one-shot
backfill from property_details.listing_events for pre-trigger history.
Tax reassessment forecast TX · Resets to sale price
- Current annual tax
- $1,457 · $121/mo
- Projected year-2 tax
- $5,306 · $442/mo
- Expected delta
- +$3,849/yr (+$321/mo · 264.1%)
ⓘ Screening estimate from a state-policy table — verify with the county assessor before closing.
Nearby sold comps map
Loading sold comps map…
Walkable amenities ~0.75 mi
Loading nearby amenities…
Taxation est. · year 1
- Rental income
- $25,462
- − Mortgage interest
- −$16,242
- − Property taxes
- −$1,457
- − Insurance
- −$1,450
- − Repairs & maintenance
- −$2,037
- − Management
- −$2,037
- − Depreciation
- −$8,435
- Taxable loss
- −$6,196
- Est. tax savings @ 24.0%
- +$1,487
- After-tax cash flow
- $448/yr
For passive investors: Depreciation is non-cash, so a rental often shows a tax loss while cash-flowing — sheltering income. Rental losses are passive: they offset passive income freely, and up to $25,000/yr can offset ordinary (W-2) income if you actively participate and your MAGI is under $100k (phasing out to $0 by $150k); unused losses carry forward. On sale, claimed depreciation is recaptured at up to 25%, and gains may owe capital-gains tax (a 1031 exchange can defer both). Figures are a year-1 estimate at your 24.0% rate — not tax advice; consult a CPA.
Schools (NCES district)
- District
- Canutillo ISD
- NCES district ID
- 4812780
- Math proficiency
- 28% ▼ -23.00%
- Reading proficiency
- 39% ▼ -7.00%
- Median HH income
- $48,327
- Composite
- 28.91/100
- National rank
- #6636
- State rank
- #542 of 826 in TX
Livability — Vinton
- Score
- 59/100
- State rank
- #1135
- US rank
- #20035
Category grades
Schools grade is shown separately in the Schools card above.
Census & demographics
- Census place
- Vinton, TX
- Population (ZIP)
- 6,550
Population outlook (El Paso County) Hauer SSP2
- Today (2025)
- 897,899 people
- By 2030
- 922,694 · +2.8%
- By 2040
- 960,492 · +7.0%
- By 2050
- 982,919 · +9.5%
- By 2075
- 997,266 · +11.1%
- By 2100
- 900,630 · +0.3%
Race, ethnicity, and origin ACS 2023
- Neighborhood character
- Predominantly Hispanic (88%)
- Race & ethnicity
- Hispanic / Latino 88% Two or more races 28% White 8% Black 1%
- Hispanic origin (detail)
- Mexican 78%
- Foreign-born
- 26% · Canada
- Languages at home
- 25% English-only · Spanish 74%
Political lean MEDSL · El Paso
- 2024 margin
- D (+15.1) · D 57.0% · R 41.8% · Other 1.2%
- 2008→2024 swing
- -17.4pp toward R · 2008: 32.5pp · 2024: 15.1pp
- All cycles
- 2024: D+15.1 2020: D+35.1 2016: D+43.2 2012: D+32.6 2008: D+32.5
Not yet ingested
- Civics
- —
Market trends
- HPI YoY
- ▲ 2.69%
- Current HPI
- 207.1199
- Rent YoY
- —
- Metro
- —
- State GDP YoY
- ▲ 3.95%
- F500 in state
- 110
Industry mix (Fortune 500 HQ in TX)
| Industry | F500 HQs | Revenue |
|---|---|---|
| Energy | 16 | $1,198B |
|
||
| Technology | 5 | $198B |
|
||
| Engineering / Construction | 4 | $72B |
|
||
| Energy Services | 3 | $60B |
|
||
| Utilities | 3 | $41B |
|
||
| Healthcare | 2 | $330B |
|
||
Price history
+0.7% since first listed2 events — show timeline
- 2026-04-23 Price Changed $289,950 GEPARMLS
- 2026-03-24 Listed $287,950 GEPARMLS
Cash-flow waterfall
monthlySold comps — $/sqft
last 12 mo · ≤1 miLoading sold comps…