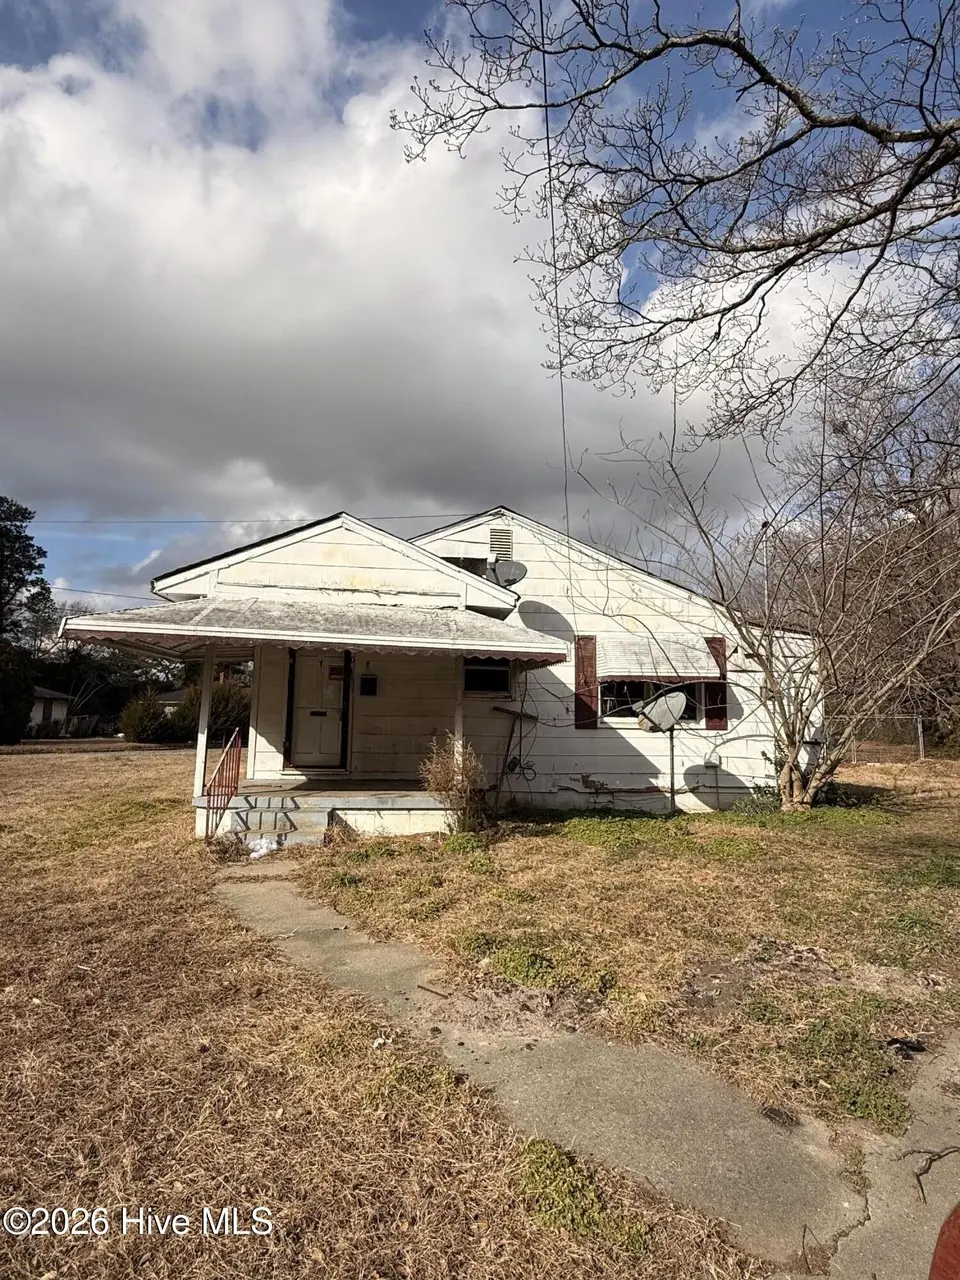
500 Marilyn Dr · Kinston, NC
Flood risk 1/10 · Minimal
- FEMA flood zone
- X (unshaded)
- Chance of flooding over 30 yrs
- 0.0%
- Est. flood insurance / yr
- $507 – $1,088
Fire risk 3/10 · Minor
- Est. fire insurance / yr
- $906 – $1,684
Heat risk 8/10 · Major
- Hot days now (above 107°F)
- 7 days/yr
- Hot days in 30 yrs
- 18 days/yr
Wind risk 8/10 · Major
- Chance of severe wind over 30 yrs
- 80.0%
Air-quality risk 2/10 · Minimal
- Unhealthy air days now
- 2 days/yr
- Unhealthy air days in 30 yrs
- 2 days/yr
Risk factors via First Street. Map © Google.
Why this score? — see what drove the B+ grade
The composite is a weighted blend of 9 inputs, each scored 0–100. Each bar is that input's sub-score; the figure is the points it added to the 100-point composite (weight × sub-score).
- Cash flow +30.0/30.0
- ARV discount +15.0/15.0
- 1% rule +10.0/10.0
- DSCR +10.0/10.0
- Livability +2.8/5.0
- Rent growth +2.5/5.0
- Schools +2.5/10.0
- Condition / age +2.5/5.0
- Appreciation +0.0/10.0
$39,000
🖨 Deal sheet 📄 Offer letter ✓ Due diligence
Listing remarks
Investment opportunity in Kinston! This 1953-built, 3BR/1BA cottage sits on a spacious . 29-acre corner lot in the Westwood subdivision. Offering 957 sqft of potential, this home features a functional floor plan and a first-floor primary bedroom. Being sold strictly AS-IS, this property is a blank canvas for contractors or savvy investors looking to flip or add to a rental portfolio.
Key facts
- 0.29 acre lot
- Built 1953
- Listed 59 days
Property features AI
Exterior
- Parking: Off-street parking (unpaved); no defined driveway/garage
- Utilities: Public water; Natural gas connected; Sewer connected; Water connected
- Home design: Single family residence; One level / single-story
- Construction: Concrete, asbestos, and frame construction
- Exterior features: Front porch; Composition roof; Has a view; Paved road access; City street and state road frontage; Lot dimensions approximately 108 x 124 x 113 x 106; Lot about 0.29 acres; Zoning: RA6
Interior
- Flooring: Flooring details — see remarks
- Bathrooms: 1 full bathroom
- Heating & cooling: Central air conditioning; Forced air heating with natural gas
- Interior features: Gas water heater; 5 total rooms; Crawl space basement (no finished basement)
- Laundry & utility: Washer hookup
Neighborhood map
What this means for you Summary
Snapshot
- This is a 3-bed/1.0-bath single-family listed at $39k.
Deal economics
- At list price, monthly cash flow is $370 ($4k/yr) — positive.
- The deal already cash-flows at list — no discount required.
- Meets the 1% rule at list price ($792 rent vs $39k).
- Recommended offer: $38k (3.0% below list) — sets the bar for market timing.
Location & tenants
- Location reads 55/100 on livability (#640 in NC) — a working-class tenant base; expect higher turnover. Strengths: cost of living A+, health & safety A+, housing B+; Watch: crime F, amenities F, commute F.
- Lenoir County Public Schools (rural): math 29% / reading 32% proficiency, ranked #147 of 178 in NC (top 83%) — families likely to look elsewhere, expect single-tenant / working-renter base with shorter leases; 65% free/reduced lunch — lower-income household profile, screen leases tightly.
- Zoned schools: Northeast Elementary (math 6% / reading 12%, grade F, #1,393 of 1,410 statewide, top 99%, 442 students, 98% FRL); Rochelle Middle (math 9% / reading 20%, grade F, #462 of 475 statewide, top 98%, 466 students, 98% FRL); Kinston High (math 22% / reading 37%, grade F, #459 of 535 statewide, top 87%, 713 students, 100% FRL) — zoned schools average 98% FRL vs 65% district-wide (34 pts higher); higher-poverty schools than district average — tighter screening recommended.
- Zoned-school proficiency averages 18% at this address vs 30% district-wide (-13 pts) — the specific schools serving this property underperform the Lenoir County Public Schools average; the district grade overstates school quality for this exact location.
- Market conditions: 95 active listings in the ZIP; 4 comparable units currently listed for rent nearby; rentals leasing fast (median 14d on market — plan ~1-2 weeks tenant-placement turnaround); 148 units permitted in Lenoir County in 2024 (0 in 5+ unit buildings).
Forward outlook
- Local home prices are declining (-3.0%/yr); year-one equity from $270 of loan paydown is wiped out by about $1k of value loss. Plan a longer hold.
- Lenoir County population projected at -18% by 2050 — secular population decline; favor cash flow + early exit over multi-decade hold.
- At projected returns (-3.0% appreciation + 3.0% rent growth), your $11k cash investment doubles in ~3 years — after that, you're playing with house money.
Negotiation context
- It's been on market 60 days — a 3% lower offer ($38k) is reasonable based on typical stale-listing flexibility.
- 2 sale attempts since 7y ago; this cycle's ask has dropped $16k (29%) from the opening price — seller is motivated, your offer sets the floor, not the list.
- Current owner paid $10k; list at $39k implies a 290% gain — meaningful room to come down on a strong offer.
Risks & watch-outs
- Watch-outs: built in 1953 — expect roof / HVAC / electrical / plumbing capex.
- Climate carrying-cost: severe wind risk, 80% chance of damaging wind over 30y; extreme-heat days projected 7→18/yr by 2055 (HVAC capex compounding) — expect insurance premiums to compound above CPI over the hold.
Questions for the listing agent
- It's been on market 60 days. Have you received any prior offers? Is the seller open to a 3% concession, seller financing, or rate buy-down credit?
- Built in 1953 — when were the roof, HVAC, electrical panel, plumbing, and water heater last replaced?
- Is there a deadline driving the sale (1031 exchange, divorce, estate, relocation)? That informs how much negotiation room exists.
- Schools are F-rated, which usually means shorter tenancies and higher turnover. Who's the typical renter profile here, and what's been the actual vacancy rate?
- Crime grade is F in this area — have there been break-ins, vandalism, or insurance claims at this property in the last 3 years? What carrier currently insures it and at what premium?
- What's the average days-on-market for RENTAL listings here right now (not sales)? A rising rental-DOM trend means longer vacancies and softer asking-rent achievability than the comps imply.
- What's the recent tenant-quality profile in this submarket — average credit score on applications, eviction rate, late-payment / NSF rate, and stable-employment percentage? A property-management company in the area should have these aggregated.
- How much new for-sale + rental construction is in the pipeline within 1–3 miles? Heavy new supply typically softens prices + rents 12–24 months out; constrained supply supports both.
Investment metrics
- 1% rule
- 2.03% ✓
- Cap rate
- 17.68%
- Cash-on-cash
- 40.68%
- DSCR
- 2.81
- GRM
- 4.1
CMA / ARV
- ARV (on-the-fly)
- $71,775
- Comps found
- 12
Show comp detail 12 sales within ~0.75 mi
| Address | Dist | Beds/Ba | Sqft | Sold | Price | $/sf | Match |
|---|---|---|---|---|---|---|---|
| 500 Jackson Ln | 0.15mi | 3/1.0 | 954 (-0%) | 8mo | $142,000 | $149 | 86 |
| 504 Jackson Ln | 0.15mi | 3/1.0 | 983 (+3%) | 15mo | $65,000 | $66 | 76 |
| 402 Marcella Dr | 0.11mi | 3/2.0 | 1,078 (+13%) | 3mo | $146,500 | $136 | 67 |
| 514 Greenmead Dr | 0.30mi | 2/1.0 (-1) | 1,038 (+8%) | 5mo | $77,500 | $75 | 63 |
| 819 Dixon St | 0.39mi | 3/1.0 | 925 (-3%) | 18mo | $70,000 | $76 | 62 |
| 817 Williams St | 0.42mi | 2/1.0 (-1) | 922 (-4%) | 9mo | $66,500 | $72 | 62 |
| 613 Larkspur Rd | 0.44mi | 3/1.0 | 925 (-3%) | 17mo | $82,500 | $89 | 60 |
| 1405 Hyman Ave | 0.43mi | 3/1.0 | 1,025 (+7%) | 12mo | $68,000 | $66 | 58 |
| 1403 Hyman Ave | 0.44mi | 3/1.0 | 1,000 (+4%) | 17mo | $36,000 | $36 | 58 |
| 1203 Ferndale Ln | 0.64mi | 3/1.0 | 1,023 (+7%) | 8mo | $32,500 | $32 | 52 |
| 616 Greenmead Dr | 0.47mi | 2/1.0 (-1) | 1,038 (+8%) | 16mo | $30,000 | $29 | 45 |
| 1504 Howard St | 0.69mi | 3/1.5 | 1,076 (+12%) | 20mo | $87,000 | $81 | 28 |
Match score weights: distance 35% · size 25% · config 20% · recency 20%. Top-matched comps best support the ARV.
Projected returns pro-forma
-3.0% appreciation · 3.0% rent growth · sell at horizon
- IRR
- 37.1%
- Equity multiple
- 2.58×
- Total profit
- $17,262
- Equity at exit
- $5,815
- IRR
- 43.7%
- Equity multiple
- 5.16×
- Total profit
- $45,405
- Equity at exit
- $3,372
Cash invested: $10,920 (down + closing). Projections, not guarantees.
Landlord ↔ Tenant lean methodology
- Overall (STATE)
- 85 Strongly Landlord-Friendly
- State North Carolina
- 85 Strongly Landlord-Friendly · R+3
- County
- — inherits STATE
- City
- — inherits STATE
ZIP-level market 28501
- Home prices YoY
- -18.9%
- Active inventory
- 95
- Price-to-rent
- 4.1×
Monthly cashflow live
- Estimated rent
- $792 medium interval (Pro) →
- Mortgage (P&I)
- −$205
- Tax from tax record
- −$34 /mo · $413/yr
- Insurance
- −$16
- HOA
- −$0
- Vacancy / Maint / Mgmt
- −$166
- Net cashflow
- $370
Break-even live
UW: 25.0% down · 7.5% · 30yr · 1.5% tax · 5.0% vac · 8.0% maint · 8.0% mgmt
Financing live
Cash to close
- Down payment
- $9,750
- Closing costs
- $1,170
- Reserves months
- —
- Total cash needed
- —
Loan-product check · same deal, 3 products live
Conventional
25% down · 7.5% · 30yr
- Down + closing
- —
- Monthly P&I
- —
- Monthly cashflow
- —
- DSCR
- —
- Eligible?
- —
Personal DTI + credit; lowest rate.
DSCR
20% down · 8.5% · 30yr
- Down + closing
- —
- Monthly P&I
- —
- Monthly cashflow
- —
- DSCR
- —
- Eligible?
- —
No personal income docs; deal must DSCR.
Hard money
10% down · 12.0% · 12mo
- Down + closing
- —
- Monthly P&I
- —
- Monthly cashflow
- —
- DSCR
- —
- Eligible?
- —
Short-term bridge; refi at stabilization.
Rent comps 4 comps
| Address | Beds | Baths | Sqft | Rent | $/sqft | DOM | Units | Dist |
|---|---|---|---|---|---|---|---|---|
| 4015 N Herritage St Kinston, NC | 1.0–3.0 | 1.0–2.0 | 964 | $838 | $0.87 | 13d | 6 | 0.58mi |
| 1313 McAdoo St Kinston, NC | 1.0–3.0 | 1.0–2.0 | 644 | $814 | $1.26 | 13d | 6 | 0.61mi |
| 705 Harvey St Kinston, NC | 2.0 | 1.0 | 896 | $700 | $0.78 | 21d | 1 | 1.32mi |
| 503 N Queen St Kinston, NC | 1.0–2.0 | 2.0 | 759 | $723 | $0.95 | 13d | 8 | 1.38mi |
Listing history 23 events
-
2026-06-19days on market $39,000 Active 60 DOM
-
2026-06-18days on market $39,000 Active 59 DOM
-
2026-06-17days on market $39,000 Active 58 DOM
-
2026-06-16days on market $39,000 Active 57 DOM
-
2026-06-15days on market $39,000 Active 56 DOM
-
2026-06-14days on market $39,000 Active 54 DOM
-
2026-06-12days on market $39,000 Active 53 DOM
-
2026-06-09days on market $39,000 Active 50 DOM
-
2026-06-08days on market $39,000 Active 49 DOM
-
2026-06-07days on market $39,000 Active 48 DOM
-
2026-06-07days on market $39,000 Active 47 DOM
-
2026-06-04days on market $39,000 Active 44 DOM
-
2026-06-02days on market $39,000 Active 43 DOM
-
2026-06-01days on market $39,000 Active 42 DOM
-
2026-05-31days on market $39,000 Active 41 DOM
-
2026-05-31days on market $39,000 Active 40 DOM
-
2026-05-14status Pending
-
2026-05-13price $39,000
-
2026-05-01price $45,000
-
2026-04-07$55,000 Active
-
2019-01-16historical
-
2019-01-15$8,000
-
2018-03-13soldstatus $10,000
ⓘ Source: listings_history table (triggers on properties + properties_extension) + one-shot
backfill from property_details.listing_events for pre-trigger history.
Tax reassessment forecast NC · Resets to sale price
- Current annual tax
- $413 · $34/mo
- Projected year-2 tax
- $413 · $34/mo
- Expected delta
- $0/yr ($0/mo · 0.0%)
ⓘ Screening estimate from a state-policy table — verify with the county assessor before closing.
Climate risk First Street
- Flood 1/10 Low FEMA zone X (unshaded) · 0% chance over 30 yrs
- Wildfire 3/10 Moderate
- Heat 8/10 Severe 7 d/yr ≥107°F today · 18 d/yr by 30 yrs out
- Wind 8/10 Severe 80% chance of damaging wind over 30 yrs
- Air quality 2/10 Low 2 unhealthy d/yr today · 2 by 30 yrs out
Nearby sold comps map
Loading sold comps map…
Walkable amenities ~0.75 mi
Loading nearby amenities…
Taxation est. · year 1
- Rental income
- $9,499
- − Mortgage interest
- −$2,185
- − Property taxes
- −$413
- − Insurance
- −$195
- − Repairs & maintenance
- −$760
- − Management
- −$760
- − Depreciation
- −$1,135
- Taxable income
- $4,053
- Est. tax owed @ 24.0%
- −$973
- After-tax cash flow
- $3,470/yr
For passive investors: Depreciation is non-cash, so a rental often shows a tax loss while cash-flowing — sheltering income. Rental losses are passive: they offset passive income freely, and up to $25,000/yr can offset ordinary (W-2) income if you actively participate and your MAGI is under $100k (phasing out to $0 by $150k); unused losses carry forward. On sale, claimed depreciation is recaptured at up to 25%, and gains may owe capital-gains tax (a 1031 exchange can defer both). Figures are a year-1 estimate at your 24.0% rate — not tax advice; consult a CPA.
Schools (NCES district)
- District
- Lenoir County Public Schools
- NCES district ID
- 3702610
- Math proficiency
- 29% ▲ 1.00%
- Reading proficiency
- 32% ▼ -4.00%
- Median HH income
- $34,958
- Composite
- 25.17/100
- National rank
- #7515
- State rank
- #147 of 178 in NC
Livability — Kinston
- Score
- 55/100
- State rank
- #640
- US rank
- #23267
Category grades
Schools grade is shown separately in the Schools card above.
Census & demographics
- Census place
- Kinston, NC
- City population
- 20,407
- Population (ZIP)
- 18,112
Population outlook (Lenoir County) Hauer SSP2
- Today (2025)
- 55,002 people
- By 2030
- 53,048 · -3.6%
- By 2040
- 49,041 · -10.8%
- By 2050
- 45,136 · -17.9%
- By 2075
- 36,547 · -33.6%
- By 2100
- 27,731 · -49.6%
Race, ethnicity, and origin ACS 2023
- Neighborhood character
- Majority Black (62%)
- Race & ethnicity
- Black 62% White 26% Two or more races 6% Hispanic / Latino 5%
- Common ancestry
- Serbian 1% Italian 1%
- Foreign-born
- 2% · Canada, China
- Languages at home
- 95% English-only · Spanish 5%
Political lean MEDSL · Lenoir
- 2024 margin
- Lean R (+6.8) · D 46.2% · R 53.0%
- 2008→2024 swing
- -6.7pp toward R · 2008: -0.1pp · 2024: -6.8pp
- All cycles
- 2024: R+6.8 2020: R+3.5 2016: R+6.3 2012: R+1.5 2008: R+0.1
Not yet ingested
- Civics
- —
Market trends
- HPI YoY
- ▼ -45.17%
- Current HPI
- 193.3213
- Rent YoY
- —
- Metro
- —
- State GDP YoY
- ▲ 3.28%
- F500 in state
- 26
Industry mix (Fortune 500 HQ in NC)
| Industry | F500 HQs | Revenue |
|---|---|---|
| Financial Services | 2 | $213B |
|
||
| Retail | 2 | $95B |
|
||
| Industrial Conglomerate | 1 | $38B |
|
||
| Metals / Steel | 1 | $35B |
|
||
| Utilities | 1 | $30B |
|
||
| Industrial Machinery | 1 | $19B |
|
||
Price history
+290.0% since first listed7 events — show timeline
- 2026-05-14 Pending — Hive MLS
- 2026-05-13 Price Changed $39,000 Hive MLS
- 2026-05-01 Price Changed $45,000 Hive MLS
- 2026-04-07 Listed $55,000 Hive MLS
- 2019-01-16 Listing Removed — Hive MLS
- 2019-01-15 Listed $8,000 Hive MLS
- 2018-03-13 Sold (Public Records) $10,000 Public Records
Property tax history
-1.4%/yrLatest (2025): $413 · +17.5% YoY. Source: county tax records.
Cash-flow waterfall
monthlySold comps — $/sqft
last 12 mo · ≤1 miLoading sold comps…