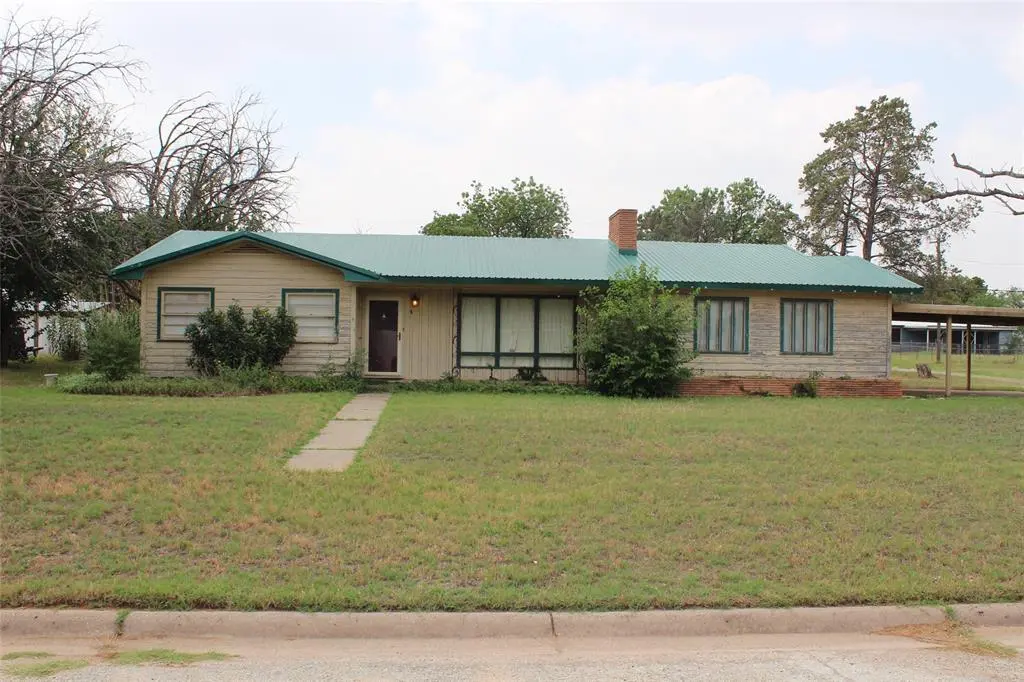
1001 SE 4th St · Knox City, TX
Flood risk 1/10 · Minimal
- FEMA flood zone
- —
- Chance of flooding over 30 yrs
- 0.0%
- Est. flood insurance / yr
- —
Fire risk 4/10 · Minor
- Est. fire insurance / yr
- $1,222 – $2,270
Heat risk 7/10 · Major
- Hot days now (above 108°F)
- 6 days/yr
- Hot days in 30 yrs
- 17 days/yr
Wind risk 3/10 · Minor
- Chance of severe wind over 30 yrs
- 6.0%
Air-quality risk 1/10 · Minimal
- Unhealthy air days now
- 0 days/yr
- Unhealthy air days in 30 yrs
- 0 days/yr
Risk factors via First Street. Map © Google.
Why this score? — see what drove the B+ grade
The composite is a weighted blend of 9 inputs, each scored 0–100. Each bar is that input's sub-score; the figure is the points it added to the 100-point composite (weight × sub-score).
- Cash flow +29.4/30.0
- DSCR +10.0/10.0
- 1% rule +8.5/10.0
- Appreciation +8.4/10.0
- ARV discount +7.5/15.0
- Schools +3.4/10.0
- Livability +3.1/5.0
- Rent growth +2.5/5.0
- Condition / age +2.5/5.0
$99,000
🖨 Deal sheet 📄 Offer letter ✓ Due diligence
Listing remarks
Sprawling 3 bedroom, 2 bath home situated on a spacious corner lot with plenty of room! This property features two separate living areas, offering flexible space for a den, game room, office, or 4th bedroom conversion. Accessibility features include a wheelchair ramp and an accessible shower conveniently located in the laundry room. Enjoy the outdoors year round from the enclosed back porch, perfect for relaxing while staying protected from summer mosquitos. Additional highlights include two covered parking spaces and a functional layout with endless potential. Property is being sold as-is. Don't miss your chance for a large country home.
Key facts
- Enclosed back porch
- Corner lot
- 0.39 acre lot
Tags
Property features AI
Finance
- Other: Property is not attached and has no accessory unit; No known restrictions; Will not subdivide
- HOA & community: No homeowners association
Exterior
- Parking: 2 covered/carport spaces; Covered parking
- Utilities: City water; City sewer; Electricity connected; All-weather road access; Located in a municipal utility district
- Home design: Single-family residence; Residential property; Single-story; Accessible approach with ramp
- Construction: Built in 1960; Wood construction; Metal roof; Pillar/post/pier foundation
- Exterior features: Covered porch(es); Enclosed porch; Corner lot; Utilities easement
Interior
- Kitchen: Dishwasher; Electric range
- Bedrooms: 3 bedrooms (all on the main level); Primary bedroom on the main level
- Flooring: Carpet; Vinyl
- Bathrooms: 2 full bathrooms
- Heating & cooling: Central heating; Central air conditioning; 1 fireplace located in the living room
- Interior features: Decorative lighting; High-speed internet available; Paneling; Two living areas; One dining area; Total of 7 rooms; One level (single-story)
- Laundry & utility: Utility room with full-size washer/dryer area; Dedicated laundry room on main level
Neighborhood map
What this means for you Summary
Snapshot
- This is a 3-bed/2.0-bath single-family listed at $99k.
Deal economics
- At list price, monthly cash flow is $352 ($4k/yr) — positive.
- The deal already cash-flows at list — no discount required.
- Meets the 1% rule at list price ($1k rent vs $99k).
- Recommended offer: $96k (3.0% below list) — sets the bar for market timing.
Location & tenants
- Location reads 62/100 on livability (#898 in TX) — a middle-class / working-renter tenant base. Strengths: crime A+, cost of living A+, housing A+; Watch: health & safety C-, schools D, amenities F.
- Knox City-O'Brien CISD (rural): math 45% / reading 30% proficiency, ranked #825 of 1,141 in TX (top 72%) — families likely to look elsewhere, expect single-tenant / working-renter base with shorter leases; 62% free/reduced lunch — lower-income household profile, screen leases tightly.
- Market conditions: 15 active listings in the ZIP.
Forward outlook
- In year one you build about $7k of equity ($684 loan paydown + $7k appreciation (6.7% local appreciation)).
- Knox County population projected at +21% by 2050 — long-run rental-demand tailwind backs the buy-and-hold thesis.
- At projected returns (6.7% appreciation + 3.0% rent growth), your $28k cash investment doubles in ~3 years — after that, you're playing with house money.
- By year 5, paydown + projected appreciation supports a ~$33k cash-out refi (75% LTV) — recoverable capital for the next deal without selling this one.
Negotiation context
- It's been on market 31 days — a 3% lower offer ($96k) is reasonable based on typical stale-listing flexibility.
Risks & watch-outs
- Climate carrying-cost: extreme-heat days projected 6→17/yr by 2055 (HVAC capex compounding) — expect insurance premiums to compound above CPI over the hold.
Questions for the listing agent
- It's been on market 31 days. Have you received any prior offers? Is the seller open to a 3% concession, seller financing, or rate buy-down credit?
- Built in 1960 — when were the roof, HVAC, electrical panel, plumbing, and water heater last replaced?
- Is there a deadline driving the sale (1031 exchange, divorce, estate, relocation)? That informs how much negotiation room exists.
- Schools are D-rated, which usually means shorter tenancies and higher turnover. Who's the typical renter profile here, and what's been the actual vacancy rate?
- What's the average days-on-market for RENTAL listings here right now (not sales)? A rising rental-DOM trend means longer vacancies and softer asking-rent achievability than the comps imply.
- What's the recent tenant-quality profile in this submarket — average credit score on applications, eviction rate, late-payment / NSF rate, and stable-employment percentage? A property-management company in the area should have these aggregated.
- How much new for-sale + rental construction is in the pipeline within 1–3 miles? Heavy new supply typically softens prices + rents 12–24 months out; constrained supply supports both.
Investment metrics
- 1% rule
- 1.35% ✓
- Cap rate
- 10.56%
- Cash-on-cash
- 15.24%
- DSCR
- 1.68
- GRM
- 6.2
CMA / ARV
- ARV (on-the-fly)
- $401,713
- Comps found
- 1
Show comp detail 1 sale within ~0.75 mi
| Address | Dist | Beds/Ba | Sqft | Sold | Price | $/sf | Match |
|---|---|---|---|---|---|---|---|
| 13181 Fm 2701 | 0.34mi | 4/2.0 (+1) | 2,714 (+14%) | 12mo | $459,000 | $169 | 46 |
Match score weights: distance 35% · size 25% · config 20% · recency 20%. Top-matched comps best support the ARV.
Projected returns pro-forma
6.72% appreciation · 3.0% rent growth · sell at horizon
- IRR
- 29.5%
- Equity multiple
- 3.00×
- Total profit
- $55,330
- Equity at exit
- $66,807
- IRR
- 27.0%
- Equity multiple
- 6.21×
- Total profit
- $144,326
- Equity at exit
- $125,309
Cash invested: $27,720 (down + closing). Projections, not guarantees.
Landlord ↔ Tenant lean methodology
- Overall (STATE)
- 87 Strongly Landlord-Friendly
- State Texas
- 87 Strongly Landlord-Friendly · R+5
- County
- — inherits STATE
- City
- — inherits STATE
ZIP-level market 79529
- Home prices YoY
- 8.6%
- Active inventory
- 15
- Price-to-rent
- 6.2×
Monthly cashflow live
- Estimated rent
- $1,341 medium interval (Pro) →
- Mortgage (P&I)
- −$519
- Tax from tax record
- −$147 /mo · $1,764/yr
- Insurance
- −$41
- HOA
- −$0
- Vacancy / Maint / Mgmt
- −$282
- Net cashflow
- $352
Break-even live
UW: 25.0% down · 7.5% · 30yr · 1.5% tax · 5.0% vac · 8.0% maint · 8.0% mgmt
Financing live
Cash to close
- Down payment
- $24,750
- Closing costs
- $2,970
- Reserves months
- —
- Total cash needed
- —
Loan-product check · same deal, 3 products live
Conventional
25% down · 7.5% · 30yr
- Down + closing
- —
- Monthly P&I
- —
- Monthly cashflow
- —
- DSCR
- —
- Eligible?
- —
Personal DTI + credit; lowest rate.
DSCR
20% down · 8.5% · 30yr
- Down + closing
- —
- Monthly P&I
- —
- Monthly cashflow
- —
- DSCR
- —
- Eligible?
- —
No personal income docs; deal must DSCR.
Hard money
10% down · 12.0% · 12mo
- Down + closing
- —
- Monthly P&I
- —
- Monthly cashflow
- —
- DSCR
- —
- Eligible?
- —
Short-term bridge; refi at stabilization.
Listing history 16 events
-
2026-06-18days on market $99,000 Active 31 DOM
-
2026-06-17days on market $99,000 Active 30 DOM
-
2026-06-17price $99,000 Active 29 DOM
-
2026-06-16days on market $115,000 Active 29 DOM
-
2026-06-15days on market $115,000 Active 28 DOM
-
2026-06-13days on market $115,000 Active 26 DOM
-
2026-06-12days on market $115,000 Active 25 DOM
-
2026-06-10days on market $115,000 Active 22 DOM
-
2026-06-08days on market $115,000 Active 21 DOM
-
2026-06-08days on market $115,000 Active 20 DOM
-
2026-06-05days on market $115,000 Active 18 DOM
-
2026-06-03days on market $115,000 Active 16 DOM
-
2026-06-02days on market $115,000 Active 15 DOM
-
2026-06-01days on market $115,000 Active 14 DOM
-
2026-05-31days on market $115,000 Active 13 DOM
-
2026-05-18$115,000 Active
ⓘ Source: listings_history table (triggers on properties + properties_extension) + one-shot
backfill from property_details.listing_events for pre-trigger history.
Tax reassessment forecast TX · Resets to sale price
- Current annual tax
- $1,764 · $147/mo
- Projected year-2 tax
- $1,812 · $151/mo
- Expected delta
- +$47/yr (+$4/mo · 2.7%)
ⓘ Screening estimate from a state-policy table — verify with the county assessor before closing.
Climate risk First Street
- Flood 1/10 Low 0% chance over 30 yrs
- Wildfire 4/10 Moderate
- Heat 7/10 Severe 6 d/yr ≥108°F today · 17 d/yr by 30 yrs out
- Wind 3/10 Moderate 6% chance of damaging wind over 30 yrs
- Air quality 1/10 Low 0 unhealthy d/yr today · 0 by 30 yrs out
Nearby sold comps map
Loading sold comps map…
Walkable amenities ~0.75 mi
Loading nearby amenities…
Taxation est. · year 1
- Rental income
- $16,092
- − Mortgage interest
- −$5,546
- − Property taxes
- −$1,764
- − Insurance
- −$495
- − Repairs & maintenance
- −$1,287
- − Management
- −$1,287
- − Depreciation
- −$2,880
- Taxable income
- $2,832
- Est. tax owed @ 24.0%
- −$680
- After-tax cash flow
- $3,543/yr
For passive investors: Depreciation is non-cash, so a rental often shows a tax loss while cash-flowing — sheltering income. Rental losses are passive: they offset passive income freely, and up to $25,000/yr can offset ordinary (W-2) income if you actively participate and your MAGI is under $100k (phasing out to $0 by $150k); unused losses carry forward. On sale, claimed depreciation is recaptured at up to 25%, and gains may owe capital-gains tax (a 1031 exchange can defer both). Figures are a year-1 estimate at your 24.0% rate — not tax advice; consult a CPA.
Schools (NCES district)
- District
- Knox City-O'Brien CISD
- NCES district ID
- 4825870
- Math proficiency
- 45% ▬ 0.00%
- Reading proficiency
- 30% ▼ -10.00%
- Median HH income
- $39,735
- Composite
- 34.0/100
- National rank
- #10322
- State rank
- #825 of 1141 in TX
Livability — Knox City
- Score
- 62/100
- State rank
- #898
- US rank
- #16138
Category grades
Schools grade is shown separately in the Schools card above.
Census & demographics
- Census place
- Knox City, TX
- Population (ZIP)
- 1,052
Population outlook (Knox County) Hauer SSP2
- Today (2025)
- 4,136 people
- By 2030
- 4,291 · +3.7%
- By 2040
- 4,655 · +12.5%
- By 2050
- 5,005 · +21.0%
- By 2075
- 6,051 · +46.3%
- By 2100
- 6,427 · +55.4%
Race, ethnicity, and origin ACS 2023
- Neighborhood character
- Diverse neighborhood (Simpson 0.56)
- Race & ethnicity
- White 61% Hispanic / Latino 26% Two or more races 7% Black 6% Asian 6%
- Hispanic origin (detail)
- Mexican 22%
- Common ancestry
- Lithuanian 2% Slovak 1% Iranian 1%
- Foreign-born
- 8% · Canada, Vietnam
- Languages at home
- 77% English-only · Spanish 17% Other Indo-European 4% Vietnamese 1%
Political lean MEDSL · Knox
- 2024 margin
- Solid R (+68.5) · D 15.6% · R 84.0%
- 2008→2024 swing
- -23.2pp toward R · 2008: -45.2pp · 2024: -68.5pp
- All cycles
- 2024: R+68.5 2020: R+62.8 2016: R+61.2 2012: R+54.8 2008: R+45.2
Not yet ingested
- Civics
- —
Market trends
- HPI YoY
- ▲ 6.72%
- Current HPI
- 85.2787
- Rent YoY
- —
- Metro
- —
- State GDP YoY
- ▲ 3.95%
- F500 in state
- 110
Industry mix (Fortune 500 HQ in TX)
| Industry | F500 HQs | Revenue |
|---|---|---|
| Energy | 16 | $1,198B |
|
||
| Technology | 5 | $198B |
|
||
| Engineering / Construction | 4 | $72B |
|
||
| Energy Services | 3 | $60B |
|
||
| Utilities | 3 | $41B |
|
||
| Healthcare | 2 | $330B |
|
||
Price history
1 event — show timeline
- 2026-05-18 Listed $115,000 NTREIS
Property tax history
+2.9%/yrLatest (2025): $1,764 · +13.8% YoY. Source: county tax records.
Cash-flow waterfall
monthlySold comps — $/sqft
last 12 mo · ≤1 miLoading sold comps…