 Multi-family
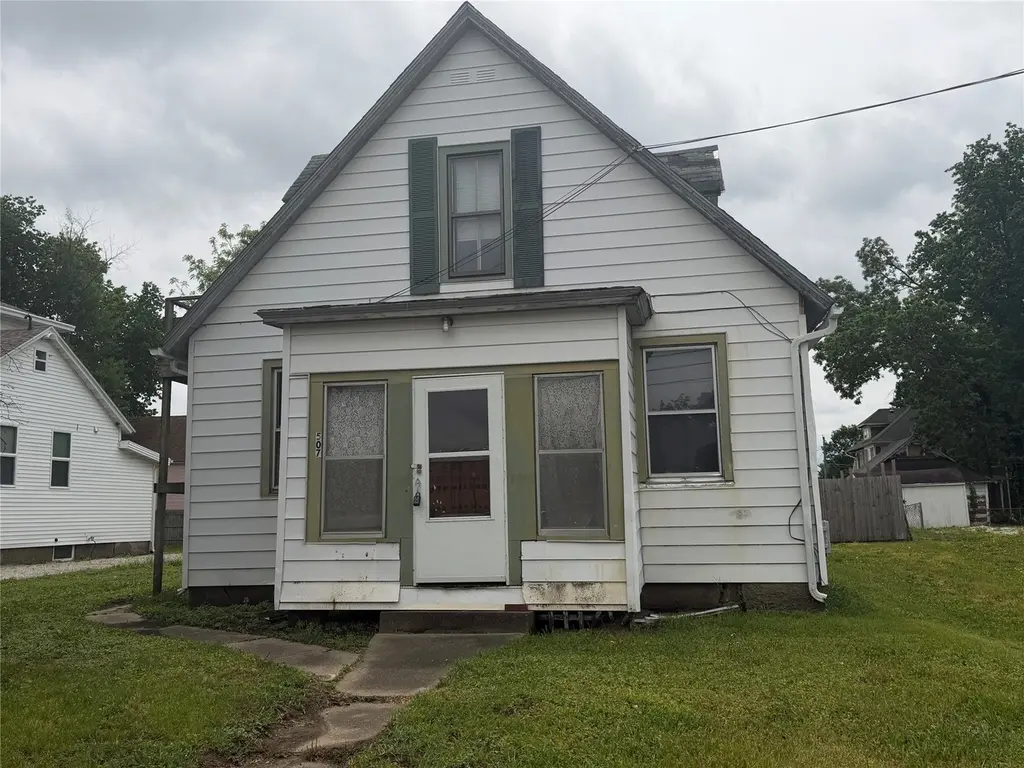
507 N 2nd Ave W · Newton, IA
Flood risk 1/10 · Minimal
- FEMA flood zone
- X (unshaded)
- Chance of flooding over 30 yrs
- 0.0%
- Est. flood insurance / yr
- $507 – $1,088
Fire risk 3/10 · Minor
- Est. fire insurance / yr
- $902 – $1,676
Heat risk 3/10 · Minor
- Hot days now (above 105°F)
- 7 days/yr
- Hot days in 30 yrs
- 15 days/yr
Wind risk 2/10 · Minimal
- Chance of severe wind over 30 yrs
- —
Air-quality risk 1/10 · Minimal
- Unhealthy air days now
- 0 days/yr
- Unhealthy air days in 30 yrs
- 0 days/yr
Risk factors via First Street. Map © Google.
Why this score? — see what drove the D+ grade
The composite is a weighted blend of 9 inputs, each scored 0–100. Each bar is that input's sub-score; the figure is the points it added to the 100-point composite (weight × sub-score).
- Cash flow +15.0/30.0
- ARV discount +7.5/15.0
- Schools +5.1/10.0
- 1% rule +5.0/10.0
- DSCR +5.0/10.0
- Livability +3.9/5.0
- Rent growth +2.5/5.0
- Condition / age +2.5/5.0
- Appreciation +0.0/10.0
$35,000
🖨 Deal sheet 📄 Offer letter ✓ Due diligence
Multi-family units
County records classify this as Multi-Family (2-4 Unit). Listing-text estimate: 1 unit. estimate disagrees with records
Listing remarks MLS
This home is a total remodel that needs done or could be a place for something new! All utilities disconnected now - ready for renovation!
Key facts
- 6,600 sq ft lot
- Built 1910
- Listed 20 days
Property features AI
Exterior
- Utilities: Public water; Public sewer
- Home design: Residential zoning
- Construction: Metal siding; Asphalt shingle roof; Block foundation; Built on a 50 x 132 lot
- Exterior features: Asphalt road surface
Interior
- Heating & cooling: Heating: See remarks
- Interior features: Rectangular lot (reported under lot features)
Neighborhood map
What this means for you Summary
Snapshot
- This is a 2-bed/2.0-bath multifamily listed at $35k.
Deal economics
- At list price, monthly cash flow is $1k ($14k/yr) — positive.
- The deal already cash-flows at list — no discount required.
- Meets the 1% rule at list price ($2k rent vs $35k).
- Recommended offer: $34k (1.5% below list) — sets the bar for market timing.
- Cap rate 45.6% vs local median 3.1% in Newton — top-decile yield for the area; either an underpriced asset or a hidden risk that comps aren't pricing in. Stress-test before assuming the spread holds.
Location & tenants
- Location reads 77/100 on livability (#169 in IA, #3,069 nationally) — a middle-class / working-renter tenant base. Strengths: cost of living A+, housing A+, health & safety A+; Watch: crime C-, employment D+, amenities F.
- Newton Community School District (town): math 59% / reading 62% proficiency, ranked #245 of 289 in IA (top 85%) — acceptable for families but not a draw, mixed tenant base, ~2y average lease.
- Market conditions: 242 active listings in the ZIP; 2 comparable units currently listed for rent nearby; 16 units permitted in Jasper County in 2024 (0 in 5+ unit buildings).
- This rent runs 34% of the median local income ($62k/yr) — at the standard rent-burdened threshold; future hikes will face affordability resistance.
Forward outlook
- Local home prices are declining (-3.0%/yr); year-one equity from $242 of loan paydown is wiped out by about $1k of value loss. Plan a longer hold.
- Jasper County population projected to shrink 7% by 2050 — rents likely to lag national; underwrite the cash flow, not the appreciation.
- At projected returns (-3.0% appreciation + 3.0% rent growth), your $10k cash investment doubles in ~1 year — after that, you're playing with house money.
Negotiation context
- It's been on market 21 days — a 2% lower offer ($34k) is reasonable based on typical stale-listing flexibility.
- 6 sale attempts since 16y ago with the ask held roughly flat each time — persistent listings suggest the price (not the market) is what's stuck; bring a comps-based counter.
- Current owner paid $30k; 17% above their basis — modest negotiation headroom, anchor on the comps not their cost.
Risks & watch-outs
- Watch-outs: built in 1910 — expect roof / HVAC / electrical / plumbing capex.
Questions for the listing agent
- Built in 1910 — when were the roof, HVAC, electrical panel, plumbing, and water heater last replaced?
- Is there a deadline driving the sale (1031 exchange, divorce, estate, relocation)? That informs how much negotiation room exists.
- Schools are A-rated — typically a magnet for longer-tenancy family renters. What's the average tenant stay here, and is there a school-zone premium baked into asking?
- The area grade is low — what's the realistic commute time and amenity access for the typical tenant pool here? Any planned neighborhood developments (good or bad) we should know about?
- What's the average days-on-market for RENTAL listings here right now (not sales)? A rising rental-DOM trend means longer vacancies and softer asking-rent achievability than the comps imply.
- What's the recent tenant-quality profile in this submarket — average credit score on applications, eviction rate, late-payment / NSF rate, and stable-employment percentage? A property-management company in the area should have these aggregated.
- How much new apartment / multifamily construction is in the pipeline within 1–3 miles? Heavy new supply (>2% of stock underway) typically softens rents 12–24 months out; light construction supports rent growth.
Investment metrics
- 1% rule
- 4.98% ✓
- Cap rate
- 45.61%
- Cash-on-cash
- 140.44%
- DSCR
- 7.25
- GRM
- 1.7
CMA / ARV
No comps found within radius.
Projected returns pro-forma
-3.0% appreciation · 3.0% rent growth · sell at horizon
- IRR
- —
- Equity multiple
- 7.88×
- Total profit
- $67,393
- Equity at exit
- $5,219
- IRR
- —
- Equity multiple
- 16.59×
- Total profit
- $152,818
- Equity at exit
- $3,026
Cash invested: $9,800 (down + closing). Projections, not guarantees.
Landlord ↔ Tenant lean methodology
- Overall (STATE)
- 83 Strongly Landlord-Friendly
- State Iowa
- 83 Strongly Landlord-Friendly · R+6
- County
- — inherits STATE
- City
- — inherits STATE
ZIP-level market 50208
- Home prices YoY
- -14.4%
- Active inventory
- 242
- Price-to-rent
- 3.3×
Monthly cashflow live
- Estimated rent
- $1,742 high interval (Pro) →
- Mortgage (P&I)
- −$184
- Tax from tax record
- −$31 /mo · $374/yr
- Insurance
- −$15
- HOA
- −$0
- Vacancy / Maint / Mgmt
- −$366
- Net cashflow
- $1,147
Break-even live
2-unit breakdown (identical units grouped — click to expand)
| Units | Beds | Baths | Est. rent |
|---|---|---|---|
| 2× units | 2 | 1 | $1,742 |
| #1 | 2 | 1 | $871 |
| #2 | 2 | 1 | $871 |
| Total (2 units) | $1,742 | ||
UW: 25.0% down · 7.5% · 30yr · 1.5% tax · 5.0% vac · 8.0% maint · 8.0% mgmt
Financing live
Cash to close
- Down payment
- $8,750
- Closing costs
- $1,050
- Reserves months
- —
- Total cash needed
- —
Loan-product check · same deal, 3 products live
Conventional
25% down · 7.5% · 30yr
- Down + closing
- —
- Monthly P&I
- —
- Monthly cashflow
- —
- DSCR
- —
- Eligible?
- —
Personal DTI + credit; lowest rate.
DSCR
20% down · 8.5% · 30yr
- Down + closing
- —
- Monthly P&I
- —
- Monthly cashflow
- —
- DSCR
- —
- Eligible?
- —
No personal income docs; deal must DSCR.
Hard money
10% down · 12.0% · 12mo
- Down + closing
- —
- Monthly P&I
- —
- Monthly cashflow
- —
- DSCR
- —
- Eligible?
- —
Short-term bridge; refi at stabilization.
Rent comps 2 comps
| Address | Beds | Baths | Sqft | Rent | $/sqft | DOM | Units | Dist |
|---|---|---|---|---|---|---|---|---|
| 712 W 12th St S Newton, IA | 3.0 | 2.5 | 2087 | $1,700 | $0.81 | 23d | 1 | 0.61mi |
| 701 N 2nd Ave E Newton, IA | 2.0 | 1.0 | 1100 | $875 | $0.80 | 14d | 1 | 0.75mi |
Listing history 26 events
-
2026-06-08days on market $35,000 Active 21 DOM
-
2026-06-07days on market $35,000 Active 20 DOM
-
2026-06-05days on market $35,000 Active 17 DOM
-
2026-06-03days on market $35,000 Active 16 DOM
-
2026-06-02days on market $35,000 Active 15 DOM
-
2026-06-01days on market $35,000 Active 14 DOM
-
2026-05-31days on market $35,000 Active 13 DOM
-
2026-05-31days on market $35,000 Active 12 DOM
-
2026-05-18$35,000 Active
-
2025-03-03soldstatus $30,000
-
2025-02-28soldstatus $30,000 Closed 138-char remark
Show marketing remark (138 chars)
This home is a total remodel that needs done or could be a place for something new! All utilities disconnected now - ready for renovation!
-
2025-02-06status Pending 138-char remark
Show marketing remark (138 chars)
This home is a total remodel that needs done or could be a place for something new! All utilities disconnected now - ready for renovation!
-
2025-02-01historical 138-char remark
Show marketing remark (138 chars)
This home is a total remodel that needs done or could be a place for something new! All utilities disconnected now - ready for renovation!
-
2024-12-31soldstatus $112,500
-
2024-08-02$49,900 Active 138-char remark
Show marketing remark (138 chars)
This home is a total remodel that needs done or could be a place for something new! All utilities disconnected now - ready for renovation!
-
2022-04-18soldstatus $110,000
-
2018-12-07soldstatus $10,000 Sold 24-char remark
Show marketing remark (24 chars)
selling as is cash only
-
2018-12-07soldstatus $10,000
Show marketing remark (24 chars)
selling as is cash only
-
2018-12-07soldstatus $10,000
Show marketing remark (24 chars)
selling as is cash only
-
2018-10-09status Pending 24-char remark
Show marketing remark (24 chars)
selling as is cash only
-
2018-09-04price $19,900 24-char remark
Show marketing remark (24 chars)
selling as is cash only
-
2018-06-25$24,900 Active 24-char remark
Show marketing remark (24 chars)
selling as is cash only
-
2018-06-25$19,900
Show marketing remark (24 chars)
selling as is cash only
-
2018-06-25$19,900
Show marketing remark (24 chars)
selling as is cash only
-
2011-12-08historical
-
2010-12-08$44,000
ⓘ Source: listings_history table (triggers on properties + properties_extension) + one-shot
backfill from property_details.listing_events for pre-trigger history.
Tax reassessment forecast IA · Partial reset (capped growth)
- Current annual tax
- $374 · $31/mo
- Projected year-2 tax
- $462 · $38/mo
- Expected delta
- +$88/yr (+$7/mo · 23.5%)
ⓘ Screening estimate from a state-policy table — verify with the county assessor before closing.
Climate risk First Street
- Flood 1/10 Low FEMA zone X (unshaded) · 0% chance over 30 yrs
- Wildfire 3/10 Moderate
- Heat 3/10 Moderate 7 d/yr ≥105°F today · 15 d/yr by 30 yrs out
- Wind 2/10 Low
- Air quality 1/10 Low 0 unhealthy d/yr today · 0 by 30 yrs out
Nearby sold comps map
Loading sold comps map…
Walkable amenities ~0.75 mi
Loading nearby amenities…
Taxation est. · year 1
- Rental income
- $20,904
- − Mortgage interest
- −$1,961
- − Property taxes
- −$374
- − Insurance
- −$175
- − Repairs & maintenance
- −$1,672
- − Management
- −$1,672
- − Depreciation
- −$1,018
- Taxable income
- $14,032
- Est. tax owed @ 24.0%
- −$3,368
- After-tax cash flow
- $10,395/yr
For passive investors: Depreciation is non-cash, so a rental often shows a tax loss while cash-flowing — sheltering income. Rental losses are passive: they offset passive income freely, and up to $25,000/yr can offset ordinary (W-2) income if you actively participate and your MAGI is under $100k (phasing out to $0 by $150k); unused losses carry forward. On sale, claimed depreciation is recaptured at up to 25%, and gains may owe capital-gains tax (a 1031 exchange can defer both). Figures are a year-1 estimate at your 24.0% rate — not tax advice; consult a CPA.
Schools (NCES district)
- District
- Newton Community School District
- NCES district ID
- 1920610
- Math proficiency
- 59% ▼ -13.00%
- Reading proficiency
- 62% ▼ -9.00%
- Median HH income
- $46,447
- Composite
- 51.15/100
- National rank
- #1762
- State rank
- #245 of 289 in IA
Livability — Newton
- Score
- 77/100
- State rank
- #169
- US rank
- #3069
Category grades
Schools grade is shown separately in the Schools card above.
Census & demographics
- Census place
- Newton, IA
- County
- Jasper County · 20,595 people
- City population
- 20,595
- Metro
- Des Moines-West Des Moines, IA
- Population (ZIP)
- 20,595
- Household income
- $62,306
- Rent vs Own
- Severe rent burden
- 536.0
Population outlook (Jasper County) Hauer SSP2
- Today (2025)
- 36,216 people
- By 2030
- 35,730 · -1.3%
- By 2040
- 34,727 · -4.1%
- By 2050
- 33,802 · -6.7%
- By 2075
- 33,382 · -7.8%
- By 2100
- 32,761 · -9.5%
Race, ethnicity, and origin ACS 2023
- Neighborhood character
- Predominantly White (88%)
- Race & ethnicity
- White 88% Hispanic / Latino 5% Two or more races 4% Black 3%
- Common ancestry
- Iranian 8% Portuguese 3% Lithuanian 2%
- Foreign-born
- 4% · Canada
- Languages at home
- 92% English-only · Spanish 4% Arabic 2% Chinese 1%
Political lean MEDSL · Jasper
- 2024 margin
- Strong R (+27.6) · D 35.4% · R 63.0% · Other 1.5%
- 2008→2024 swing
- -35.1pp toward R · 2008: 7.5pp · 2024: -27.6pp
- All cycles
- 2024: R+27.6 2020: R+21.5 2016: R+18.4 2012: D+7.1 2008: D+7.5
Not yet ingested
- Civics
- —
Market trends
- HPI YoY
- ▼ -45.48%
- Current HPI
- 269.6454
- Rent YoY
- —
- Metro
- Des Moines-West Des Moines, IA
- State GDP YoY
- ▲ 2.48%
- F500 in state
- 4
Industry mix (Fortune 500 HQ in IA)
| Industry | F500 HQs | Revenue |
|---|---|---|
| Financial Services | 1 | $16B |
|
||
| Retail / Convenience | 1 | $15B |
|
||
Price history
-20.5% since first listed18 events — show timeline
- 2026-05-18 Listed $35,000 DMMLS
- 2025-03-03 Sold (Public Records) $30,000 Public Records
- 2025-02-28 Sold (MLS) $30,000 DMMLS
- 2025-02-06 Pending — DMMLS
- 2025-02-01 Listing Removed — DMMLS
- 2024-12-31 Sold (Public Records) $112,500 Public Records
- 2024-08-02 Listed $49,900 DMMLS
- 2022-04-18 Sold (Public Records) $110,000 Public Records
- 2018-12-07 Sold (MLS) $10,000 IAR
- 2018-12-07 Sold (MLS) $10,000 NORTHSTARMLS as Distributed by MLS Grid
- 2018-12-07 Sold (MLS) $10,000 DMMLS
- 2018-10-09 Pending — DMMLS
- 2018-09-04 Price Changed $19,900 DMMLS
- 2018-06-25 Listed $19,900 IAR
- 2018-06-25 Listed $19,900 NORTHSTARMLS as Distributed by MLS Grid
- 2018-06-25 Listed $24,900 DMMLS
- 2011-12-08 Listing Removed — NORTHSTARMLS as Distributed by MLS Grid
- 2010-12-08 Listed $44,000 NORTHSTARMLS as Distributed by MLS Grid
Property tax history
-9.2%/yrLatest (2025): $374 · +0.5% YoY. Source: county tax records.
Cash-flow waterfall
monthlySold comps — $/sqft
last 12 mo · ≤1 miLoading sold comps…