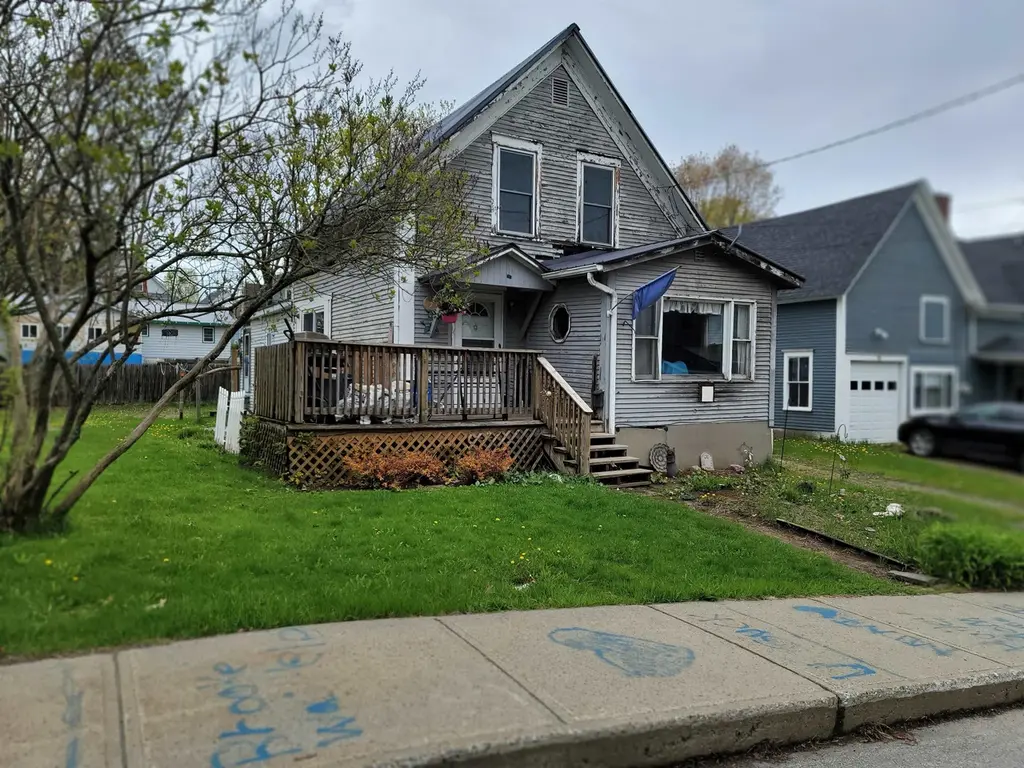
75 Indian Point St · Newport, VT
Flood risk 1/10 · Minimal
- FEMA flood zone
- X
- Chance of flooding over 30 yrs
- 0.0%
- Est. flood insurance / yr
- $473 – $860
Fire risk 1/10 · Minimal
- Est. fire insurance / yr
- $480 – $892
Heat risk 2/10 · Minimal
- Hot days now (above 90°F)
- 7 days/yr
- Hot days in 30 yrs
- 17 days/yr
Wind risk 2/10 · Minimal
- Chance of severe wind over 30 yrs
- 3.0%
Air-quality risk 2/10 · Minimal
- Unhealthy air days now
- 1 days/yr
- Unhealthy air days in 30 yrs
- 1 days/yr
Risk factors via First Street. Map © Google.
Why this score? — see what drove the C+ grade
The composite is a weighted blend of 9 inputs, each scored 0–100. Each bar is that input's sub-score; the figure is the points it added to the 100-point composite (weight × sub-score).
- Cash flow +16.7/30.0
- ARV discount +15.0/15.0
- Appreciation +10.0/10.0
- DSCR +5.2/10.0
- Schools +5.0/10.0
- 1% rule +4.1/10.0
- Livability +3.0/5.0
- Rent growth +2.5/5.0
- Condition / age +2.5/5.0
$135,000
🖨 Deal sheet 📄 Offer letter ✓ Due diligence
Listing remarks
Rare opportunity awaits in the heart of Newport! This property is a diamond in the rough, perfectly positioned for the visionary buyer looking to build sweat equity in one of Vermont’s most scenic corridors. Located just moments from the pristine waters of Lake Memphremagog, you’ll enjoy world-class fishing, the scenic boardwalk, and a multi-purpose trail that stretches from the nearby hospital all the way to the Canadian border. Whether you are looking for a weekend adventure or a daily commute, you are ideally situated with easy access to I-91, the Canadian gateway, and New Hampshire. The location offers the ultimate balance of convenience and recreation. You are steps away fr
Key facts
- 8,712 sq ft lot
- Garage
- Built 1920
Property features AI
Exterior
- Parking: 1-car garage
- Utilities: Public water; Public sewer; Circuit breaker electrical panel; Internet (cable) available; Xfinity cable/phone available; Bournes Energy fuel service
- Home design: Rehab needed; Existing structure; Gray exterior; Metal roof
- Construction: Wood frame construction; Built in 1920
- Exterior features: Sidewalks; Located in town; Gravel driveway; Paved road frontage
Interior
- Kitchen: Dishwasher; Microwave; Electric range; Refrigerator; Water heater
- Bathrooms: Two full bathrooms
- Heating & cooling: Propane heating; Pellet stove
- Interior features: Five total rooms; Basement with interior access and dirt floor
Neighborhood map
What this means for you Summary
Snapshot
- This is a 3-bed/2.0-bath single-family listed at $135k.
Deal economics
- At list price, monthly cash flow is $85 ($1k/yr) — positive.
- The deal already cash-flows at list — no discount required.
- To meet the 1% rule (rent ≥ 1% of price), the offer needs to be $123k (8.9% below list).
- Recommended offer: $123k (8.9% below list) — sets the bar for 1% rule.
- Cap rate 7.0% vs local median 2.3% in Newport — top-decile yield for the area; either an underpriced asset or a hidden risk that comps aren't pricing in. Stress-test before assuming the spread holds.
Location & tenants
- Location reads 59/100 on livability (#99 in VT) — a working-class tenant base; expect higher turnover. Strengths: cost of living A+, housing A-; Watch: employment C-, crime F, amenities F.
- Zoned schools: Newport City Elementary School (math 32% / reading 32%, grade F, #129 of 192 statewide, top 70%, 313 students, 71% FRL).
- Market conditions: 47 active listings in the ZIP; 157 units permitted in Orleans County in 2024 (107 in 5+ unit buildings).
Forward outlook
- In year one you build about $14k of equity ($933 loan paydown + $14k appreciation (10.0% local appreciation)).
- Orleans County population projected at -19% by 2050 — secular population decline; favor cash flow + early exit over multi-decade hold.
- At projected returns (10.0% appreciation + 3.0% rent growth), your $38k cash investment doubles in ~3 years — after that, you're playing with house money.
- By year 3, paydown + projected appreciation supports a ~$37k cash-out refi (75% LTV) — recoverable capital for the next deal without selling this one.
Negotiation context
- It's been on market 20 days — a 2% lower offer ($133k) is reasonable based on typical stale-listing flexibility.
Risks & watch-outs
- Watch-outs: built in 1920 — expect roof / HVAC / electrical / plumbing capex.
Questions for the listing agent
- Built in 1920 — when were the roof, HVAC, electrical panel, plumbing, and water heater last replaced?
- Is there a deadline driving the sale (1031 exchange, divorce, estate, relocation)? That informs how much negotiation room exists.
- Schools are D-rated, which usually means shorter tenancies and higher turnover. Who's the typical renter profile here, and what's been the actual vacancy rate?
- Crime grade is F in this area — have there been break-ins, vandalism, or insurance claims at this property in the last 3 years? What carrier currently insures it and at what premium?
- What's the average days-on-market for RENTAL listings here right now (not sales)? A rising rental-DOM trend means longer vacancies and softer asking-rent achievability than the comps imply.
- What's the recent tenant-quality profile in this submarket — average credit score on applications, eviction rate, late-payment / NSF rate, and stable-employment percentage? A property-management company in the area should have these aggregated.
- How much new for-sale + rental construction is in the pipeline within 1–3 miles? Heavy new supply typically softens prices + rents 12–24 months out; constrained supply supports both.
Investment metrics
- 1% rule
- 0.91% ✗
- Cap rate
- 7.05%
- Cash-on-cash
- 2.70%
- DSCR
- 1.12
- GRM
- 9.2
CMA / ARV
- ARV (on-the-fly)
- $226,320
- Comps found
- 9
Show comp detail 9 sales within ~0.75 mi
| Address | Dist | Beds/Ba | Sqft | Sold | Price | $/sf | Match |
|---|---|---|---|---|---|---|---|
| 240 Sias Ave | 0.30mi | 3/1.5 | 1,344 (+9%) | 1mo | $249,000 | $185 | 68 |
| 82 Maple St | 0.14mi | 3/2.0 | 1,295 (+5%) | 22mo | $238,500 | $184 | 67 |
| 165 Fernwood Cir | 0.45mi | 2/2.0 (-1) | 1,226 (-0%) | 9mo | $244,900 | $200 | 66 |
| 217 Clyde St | 0.41mi | 3/1.0 | 1,146 (-7%) | 2mo | $209,500 | $183 | 64 |
| 184 Jackson St | 0.34mi | 3/2.0 | 1,354 (+10%) | 7mo | $315,000 | $233 | 61 |
| 195 Pearl St | 0.22mi | 2/2.0 (-1) | 1,120 (-9%) | 10mo | $295,000 | $263 | 61 |
| 163 Mount Vernon St | 0.49mi | 3/1.0 | 1,261 (+2%) | 22mo | $232,000 | $184 | 51 |
| 46 Duchess Ave | 0.32mi | 2/1.5 (-1) | 1,056 (-14%) | 6mo | $190,000 | $180 | 49 |
| 70 Freeman St | 0.43mi | 2/1.0 (-1) | 1,288 (+5%) | 18mo | $210,000 | $163 | 48 |
Match score weights: distance 35% · size 25% · config 20% · recency 20%. Top-matched comps best support the ARV.
Projected returns pro-forma
10.0% appreciation · 3.0% rent growth · sell at horizon
- IRR
- 26.2%
- Equity multiple
- 3.09×
- Total profit
- $78,938
- Equity at exit
- $121,619
- IRR
- 23.0%
- Equity multiple
- 7.04×
- Total profit
- $228,174
- Equity at exit
- $262,275
Cash invested: $37,800 (down + closing). Projections, not guarantees.
Landlord ↔ Tenant lean methodology
- Overall (STATE)
- 41 Moderately Tenant-Leaning
- State Vermont
- 41 Moderately Tenant-Leaning · D+15
- County
- — inherits STATE
- City
- — inherits STATE
ZIP-level market 05855
- Home prices YoY
- 8.7%
- Active inventory
- 47
- Price-to-rent
- 9.2×
Monthly cashflow live
- Estimated rent
- $1,229 medium interval (Pro) →
- Mortgage (P&I)
- −$708
- Tax from tax record
- −$122 /mo · $1,462/yr
- Insurance
- −$56
- HOA
- −$0
- Vacancy / Maint / Mgmt
- −$258
- Net cashflow
- $85
Break-even live
UW: 25.0% down · 7.5% · 30yr · 1.5% tax · 5.0% vac · 8.0% maint · 8.0% mgmt
Financing live
Cash to close
- Down payment
- $33,750
- Closing costs
- $4,050
- Reserves months
- —
- Total cash needed
- —
Loan-product check · same deal, 3 products live
Conventional
25% down · 7.5% · 30yr
- Down + closing
- —
- Monthly P&I
- —
- Monthly cashflow
- —
- DSCR
- —
- Eligible?
- —
Personal DTI + credit; lowest rate.
DSCR
20% down · 8.5% · 30yr
- Down + closing
- —
- Monthly P&I
- —
- Monthly cashflow
- —
- DSCR
- —
- Eligible?
- —
No personal income docs; deal must DSCR.
Hard money
10% down · 12.0% · 12mo
- Down + closing
- —
- Monthly P&I
- —
- Monthly cashflow
- —
- DSCR
- —
- Eligible?
- —
Short-term bridge; refi at stabilization.
Listing history 17 events
-
2026-06-18days on market $135,000 Active 20 DOM
-
2026-06-17days on market $135,000 Active 19 DOM
-
2026-06-16days on market $135,000 Active 18 DOM
-
2026-06-15days on market $135,000 Active 17 DOM
-
2026-06-15pricedays on market $135,000 Active 16 DOM
-
2026-06-13days on market $150,000 Active 15 DOM
-
2026-06-12days on market $150,000 Active 14 DOM
-
2026-06-09days on market $150,000 Active 11 DOM
-
2026-06-08days on market $150,000 Active 10 DOM
-
2026-06-08days on market $150,000 Active 9 DOM
-
2026-06-07days on market $150,000 Active 8 DOM
-
2026-06-05days on market $150,000 Active 7 DOM
-
2026-06-03days on market $150,000 Active 5 DOM
-
2026-06-02days on market $150,000 Active 4 DOM
-
2026-06-01days on market $150,000 Active 3 DOM
-
2026-05-31days on market $150,000 Active 2 DOM
-
2026-05-29$150,000 Active
ⓘ Source: listings_history table (triggers on properties + properties_extension) + one-shot
backfill from property_details.listing_events for pre-trigger history.
Tax reassessment forecast VT · Partial reset (capped growth)
- Current annual tax
- $1,462 · $122/mo
- Projected year-2 tax
- $2,014 · $168/mo
- Expected delta
- +$551/yr (+$46/mo · 37.7%)
ⓘ Screening estimate from a state-policy table — verify with the county assessor before closing.
Climate risk First Street
- Flood 1/10 Low FEMA zone X · 0% chance over 30 yrs
- Wildfire 1/10 Low
- Heat 2/10 Low 7 d/yr ≥90°F today · 17 d/yr by 30 yrs out
- Wind 2/10 Low 3% chance of damaging wind over 30 yrs
- Air quality 2/10 Low 1 unhealthy d/yr today · 1 by 30 yrs out
Nearby sold comps map
Loading sold comps map…
Walkable amenities ~0.75 mi
Loading nearby amenities…
Taxation est. · year 1
- Rental income
- $14,752
- − Mortgage interest
- −$7,562
- − Property taxes
- −$1,462
- − Insurance
- −$675
- − Repairs & maintenance
- −$1,180
- − Management
- −$1,180
- − Depreciation
- −$3,927
- Taxable loss
- −$1,234
- Est. tax savings @ 24.0%
- +$296
- After-tax cash flow
- $1,318/yr
For passive investors: Depreciation is non-cash, so a rental often shows a tax loss while cash-flowing — sheltering income. Rental losses are passive: they offset passive income freely, and up to $25,000/yr can offset ordinary (W-2) income if you actively participate and your MAGI is under $100k (phasing out to $0 by $150k); unused losses carry forward. On sale, claimed depreciation is recaptured at up to 25%, and gains may owe capital-gains tax (a 1031 exchange can defer both). Figures are a year-1 estimate at your 24.0% rate — not tax advice; consult a CPA.
Schools (NCES district)
No district data.
Livability — Newport
- Score
- 59/100
- State rank
- #99
- US rank
- #20247
Category grades
Schools grade is shown separately in the Schools card above.
Census & demographics
- Census place
- Newport, VT
- Population (ZIP)
- 7,576
Population outlook (Orleans County) Hauer SSP2
- Today (2025)
- 26,222 people
- By 2030
- 25,399 · -3.1%
- By 2040
- 23,350 · -11.0%
- By 2050
- 21,232 · -19.0%
- By 2075
- 16,543 · -36.9%
- By 2100
- 11,566 · -55.9%
Race, ethnicity, and origin ACS 2023
- Neighborhood character
- Predominantly White (93%)
- Race & ethnicity
- White 93% Two or more races 4% Black 2%
- Common ancestry
- Lithuanian 5% Slovak 4% Romanian 2%
- Foreign-born
- 4% · Canada, China
- Languages at home
- 95% English-only · French/Haitian/Cajun 2% German/W. Germanic 1% Chinese 1%
Political lean MEDSL · Orleans
- 2024 margin
- Toss-up / Even · D 47.8% · R 49.4% · Other 2.8%
- 2008→2024 swing
- -29.1pp toward R · 2008: 27.5pp · 2024: -1.6pp
- All cycles
- 2024: R+1.6 2020: D+4.5 2016: D+0.2 2012: D+24.2 2008: D+27.5
Not yet ingested
- Civics
- —
Market trends
- HPI YoY
- ▲ 23.71%
- Current HPI
- 297.9538
- Rent YoY
- —
- Metro
- —
- State GDP YoY
- —
- F500 in state
- 0
Price history
1 event — show timeline
- 2026-05-29 Listed $150,000 PrimeMLS
Property tax history
+20.7%/yrLatest (2024): $1,462 · +8.7% YoY. Source: county tax records.
Cash-flow waterfall
monthlySold comps — $/sqft
last 12 mo · ≤1 miLoading sold comps…