 Multi-family
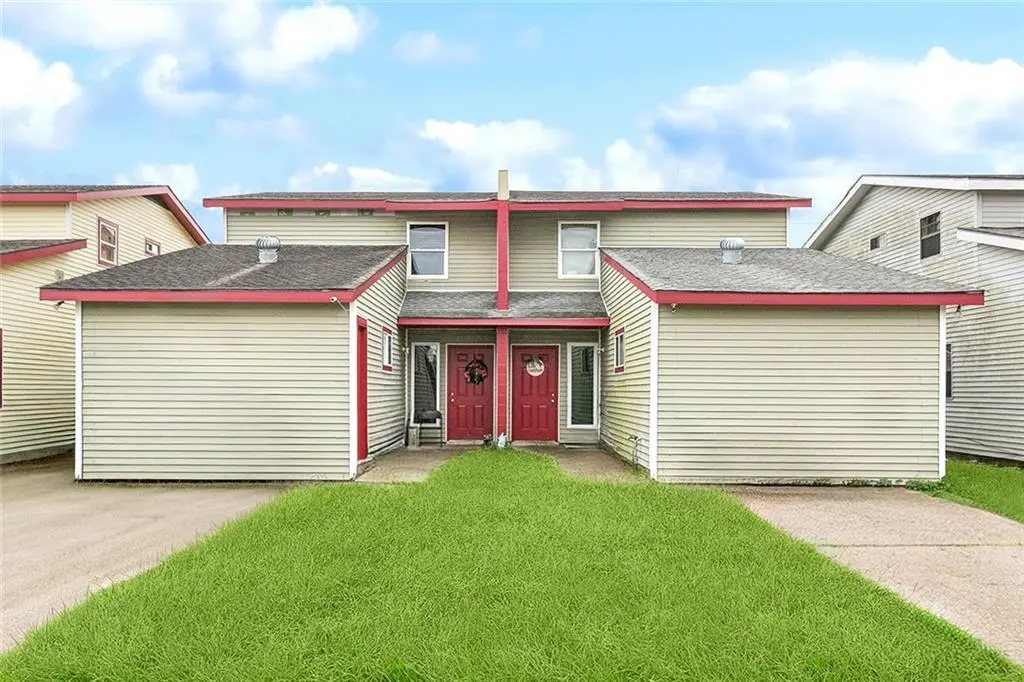
3617 19 Jupiter Dr · Chalmette, LA
Flood risk 8/10 · Major
- FEMA flood zone
- X (shaded)
- Chance of flooding over 30 yrs
- 0.6%
- Est. flood insurance / yr
- $507 – $1,088
Fire risk 1/10 · Minimal
- Est. fire insurance / yr
- $1,269 – $2,357
Heat risk 10/10 · Severe
- Hot days now (above 108°F)
- 7 days/yr
- Hot days in 30 yrs
- 22 days/yr
Wind risk 10/10 · Severe
- Chance of severe wind over 30 yrs
- 99.0%
Air-quality risk 3/10 · Minor
- Unhealthy air days now
- 3 days/yr
- Unhealthy air days in 30 yrs
- 3 days/yr
Risk factors via First Street. Map © Google.
Why this score? — see what drove the B+ grade
The composite is a weighted blend of 9 inputs, each scored 0–100. Each bar is that input's sub-score; the figure is the points it added to the 100-point composite (weight × sub-score).
- Cash flow +30.0/30.0
- ARV discount +15.0/15.0
- DSCR +10.0/10.0
- 1% rule +9.0/10.0
- Schools +5.0/10.0
- Rent growth +3.3/5.0
- Livability +3.2/5.0
- Condition / age +2.5/5.0
- Appreciation +0.0/10.0
$256,000
🖨 Deal sheet 📄 Offer letter ✓ Due diligence
Multi-family units
County records classify this as Multi-Family (2-4 Unit). Listing-text estimate: 1 unit. estimate disagrees with records
Listing remarks
Welcome to this well-kept Party Wall Double located in Chalmette, offering comfort and convenience in a desirable location. Total of 6 Bedrooms, 2 Full, and 2 Half baths would make a great choice for first-time buyers, downsizers, investors; or anyone wanting to live in one unit and rent the other! Inside each unit, you’ll find an efficient floor plan with a spacious living area, dining space, and a kitchen equipped with a dishwasher, range/oven, and, washer/dryer hookups inside. The property is located in Flood Zone X, which should provide for favorable flood insurance rates! Enjoy easy maintenance living with a layout designed for practicality and comfort. With its excellent locatio
Key facts
- Efficient floor plan
- Spacious living area
- Flood zone x
Tags
Property features AI
Exterior
- Parking: Driveway; Off-street parking; Two parking spaces
- Utilities: Public water; Public sewer
- Home design: Two-story property; Entry on slab foundation
- Construction: Shingle roof; Slab foundation
- Exterior features: City lot; Rectangular lot; Lot dimensions approximately 50 x 106
Interior
- Bathrooms: 2 full bathrooms; 2 half bathrooms
- Heating & cooling: Central heating; Central air conditioning
- Interior features: Very good condition
Neighborhood map
What this means for you Summary
Snapshot
- This is a 6-bed/3.0-bath multifamily listed at $256k.
Deal economics
- At list price, monthly cash flow is $1k ($15k/yr) — positive.
- The deal already cash-flows at list — no discount required.
- Meets the 1% rule at list price ($4k rent vs $256k).
- Recommended offer: $248k (3.0% below list) — sets the bar for market timing.
- Cap rate 12.3% vs local median 5.5% in Chalmette — top-decile yield for the area; either an underpriced asset or a hidden risk that comps aren't pricing in. Stress-test before assuming the spread holds.
Location & tenants
- Location reads 65/100 on livability (#137 in LA) — a middle-class / working-renter tenant base. Strengths: cost of living A+, housing A+, health & safety A; Watch: crime F, amenities F, commute F.
- Market conditions: Rents rising (+3.1%/yr); 209 active listings in the ZIP; 112 units permitted in St. Bernard Parish in 2024 (0 in 5+ unit buildings).
- At $3,588/mo this rent would consume 78% of the median local household income ($55k/yr) (locally 881% of renters already pay >50% of income on rent) — very limited rent-growth headroom before tenants either downsize or default.
Forward outlook
- Local home prices are declining (-3.0%/yr); year-one equity from $2k of loan paydown is wiped out by about $8k of value loss. Plan a longer hold.
- St. Bernard County population projected at +89% by 2050 — long-run rental-demand tailwind backs the buy-and-hold thesis.
- At projected returns (-3.0% appreciation + 3.1% rent growth), your $72k cash investment doubles in ~6 years — after that, you're playing with house money.
Negotiation context
- It's been on market 31 days — a 3% lower offer ($248k) is reasonable based on typical stale-listing flexibility.
- 5 sale attempts with the ask held roughly flat each time — persistent listings suggest the price (not the market) is what's stuck; bring a comps-based counter.
- Current owner paid $90k; list at $256k implies a 186% gain — meaningful room to come down on a strong offer.
Risks & watch-outs
- Watch-outs: flood insurance adds $66/mo.
- Climate carrying-cost: severe flood risk; severe wind risk, 99% chance of damaging wind over 30y; extreme-heat days projected 7→22/yr by 2055 (HVAC capex compounding) — expect insurance premiums to compound above CPI over the hold.
Questions for the listing agent
- It's been on market 31 days. Have you received any prior offers? Is the seller open to a 3% concession, seller financing, or rate buy-down credit?
- What's the actual annual flood-insurance premium (NFIP or private), and is the property in a SFHA with mandatory coverage?
- Is there a deadline driving the sale (1031 exchange, divorce, estate, relocation)? That informs how much negotiation room exists.
- Crime grade is F in this area — have there been break-ins, vandalism, or insurance claims at this property in the last 3 years? What carrier currently insures it and at what premium?
- What's the average days-on-market for RENTAL listings here right now (not sales)? A rising rental-DOM trend means longer vacancies and softer asking-rent achievability than the comps imply.
- What's the recent tenant-quality profile in this submarket — average credit score on applications, eviction rate, late-payment / NSF rate, and stable-employment percentage? A property-management company in the area should have these aggregated.
- How much new apartment / multifamily construction is in the pipeline within 1–3 miles? Heavy new supply (>2% of stock underway) typically softens rents 12–24 months out; light construction supports rent growth.
Investment metrics
- 1% rule
- 1.40% ✓
- Cap rate
- 12.28%
- Cash-on-cash
- 21.37%
- DSCR
- 1.95
- GRM
- 5.9
CMA / ARV
- ARV (on-the-fly)
- $423,423
- Comps found
- 3
Show comp detail 3 sales within ~0.75 mi
| Address | Dist | Beds/Ba | Sqft | Sold | Price | $/sf | Match |
|---|---|---|---|---|---|---|---|
| 3408 Rose Ave | 0.24mi | 6/4.0 | 2,784 (-7%) | 17mo | $220,000 | $79 | 58 |
| 3400 Montesquieu St | 0.51mi | 6/5.0 | 2,744 (-9%) | 2mo | $419,000 | $153 | 53 |
| 3319 17 Pakenham Dr | 0.57mi | 6/5.0 | 2,690 (-10%) | 17mo | $379,000 | $141 | 34 |
Match score weights: distance 35% · size 25% · config 20% · recency 20%. Top-matched comps best support the ARV.
Projected returns pro-forma
-3.0% appreciation · 3.11% rent growth · sell at horizon
- IRR
- 12.6%
- Equity multiple
- 1.50×
- Total profit
- $35,936
- Equity at exit
- $38,170
- IRR
- 21.6%
- Equity multiple
- 2.84×
- Total profit
- $132,008
- Equity at exit
- $22,134
Cash invested: $71,680 (down + closing). Projections, not guarantees.
Landlord ↔ Tenant lean methodology
- Overall (STATE)
- 90 Strongly Landlord-Friendly
- State Louisiana
- 90 Strongly Landlord-Friendly · R+12
- County
- — inherits STATE
- City
- — inherits STATE
ZIP-level market 70043
- Rents YoY
- 3.1%
- Active inventory
- 209
- Price-to-rent
- 11.9×
Monthly cashflow live
- Estimated rent
- $3,588 high interval (Pro) →
- Mortgage (P&I)
- −$1,342
- Tax from tax record
- −$109 /mo · $1,309/yr
- Insurance
- −$107
- Flood insurance flood zone
- −$66 /mo · $798/yr
- HOA
- −$0
- Vacancy / Maint / Mgmt
- −$753
- Net cashflow
- $1,210
Break-even live
2-unit breakdown (identical units grouped — click to expand)
| Units | Beds | Baths | Est. rent |
|---|---|---|---|
| 2× units | 3 | 1.5 | $3,588 |
| #1 | 3 | 1.5 | $1,794 |
| #2 | 3 | 1.5 | $1,794 |
| Total (2 units) | $3,588 | ||
UW: 25.0% down · 7.5% · 30yr · 1.5% tax · 5.0% vac · 8.0% maint · 8.0% mgmt
Financing live
Cash to close
- Down payment
- $64,000
- Closing costs
- $7,680
- Reserves months
- —
- Total cash needed
- —
Loan-product check · same deal, 3 products live
Conventional
25% down · 7.5% · 30yr
- Down + closing
- —
- Monthly P&I
- —
- Monthly cashflow
- —
- DSCR
- —
- Eligible?
- —
Personal DTI + credit; lowest rate.
DSCR
20% down · 8.5% · 30yr
- Down + closing
- —
- Monthly P&I
- —
- Monthly cashflow
- —
- DSCR
- —
- Eligible?
- —
No personal income docs; deal must DSCR.
Hard money
10% down · 12.0% · 12mo
- Down + closing
- —
- Monthly P&I
- —
- Monthly cashflow
- —
- DSCR
- —
- Eligible?
- —
Short-term bridge; refi at stabilization.
Listing history 20 events
-
2026-06-18days on market $256,000 Active 31 DOM
-
2026-06-17days on market $256,000 Active 30 DOM
-
2026-06-16days on market $256,000 Active 29 DOM
-
2026-06-15days on market $256,000 Active 28 DOM
-
2026-06-13days on market $256,000 Active 26 DOM
-
2026-06-10days on market $256,000 Active 23 DOM
-
2026-06-09days on market $256,000 Active 22 DOM
-
2026-06-08days on market $256,000 Active 21 DOM
-
2026-06-07days on market $256,000 Active 20 DOM
-
2026-06-03days on market $256,000 Active 16 DOM
-
2026-06-02days on market $256,000 Active 15 DOM
-
2026-06-01days on market $256,000 Active 14 DOM
-
2026-05-31days on market $256,000 Active 13 DOM
-
2026-05-18$256,000 Active
-
2026-04-30$1,400
-
2026-03-18historical $1,400
-
2026-01-31$1,400
-
2025-09-12$124,250 Active
-
2025-09-12$124,250 Active
-
1998-01-12soldstatus $89,500
ⓘ Source: listings_history table (triggers on properties + properties_extension) + one-shot
backfill from property_details.listing_events for pre-trigger history.
Tax reassessment forecast LA · Resets to sale price
- Current annual tax
- $1,309 · $109/mo
- Projected year-2 tax
- $1,408 · $117/mo
- Expected delta
- +$99/yr (+$8/mo · 7.6%)
ⓘ Screening estimate from a state-policy table — verify with the county assessor before closing.
Climate risk First Street
- Flood 8/10 Severe FEMA zone X (shaded) · 60% chance over 30 yrs
- Wildfire 1/10 Low
- Heat 10/10 Extreme 7 d/yr ≥108°F today · 22 d/yr by 30 yrs out
- Wind 10/10 Extreme 99% chance of damaging wind over 30 yrs
- Air quality 3/10 Moderate 3 unhealthy d/yr today · 3 by 30 yrs out
Nearby sold comps map
Loading sold comps map…
Walkable amenities ~0.75 mi
Loading nearby amenities…
Taxation est. · year 1
- Rental income
- $43,056
- − Mortgage interest
- −$14,340
- − Property taxes
- −$1,309
- − Insurance
- −$2,078
- − Repairs & maintenance
- −$3,444
- − Management
- −$3,444
- − Depreciation
- −$7,447
- Taxable income
- $10,994
- Est. tax owed @ 24.0%
- −$2,638
- After-tax cash flow
- $11,880/yr
For passive investors: Depreciation is non-cash, so a rental often shows a tax loss while cash-flowing — sheltering income. Rental losses are passive: they offset passive income freely, and up to $25,000/yr can offset ordinary (W-2) income if you actively participate and your MAGI is under $100k (phasing out to $0 by $150k); unused losses carry forward. On sale, claimed depreciation is recaptured at up to 25%, and gains may owe capital-gains tax (a 1031 exchange can defer both). Figures are a year-1 estimate at your 24.0% rate — not tax advice; consult a CPA.
Schools (NCES district)
No district data.
Livability — Chalmette
- Score
- 65/100
- State rank
- #137
- US rank
- #12500
Category grades
Schools grade is shown separately in the Schools card above.
Census & demographics
- Census place
- Chalmette, LA
- County
- Saint Bernard Parish · 22,638 people
- City population
- 22,638
- Metro
- New Orleans-Metairie, LA
- Population (ZIP)
- 22,638
- Household income
- $55,068
- Rent vs Own
- Severe rent burden
- 881.0
Population outlook (St. Bernard County) Hauer SSP2
- Today (2025)
- 66,513 people
- By 2030
- 77,768 · +16.9%
- By 2040
- 101,296 · +52.3%
- By 2050
- 125,770 · +89.1%
- By 2075
- 188,160 · +182.9%
- By 2100
- 239,339 · +259.8%
Race, ethnicity, and origin ACS 2023
- Neighborhood character
- Diverse neighborhood (Simpson 0.61)
- Race & ethnicity
- White 55% Black 26% Hispanic / Latino 12% Two or more races 10% Asian 2%
- Hispanic origin (detail)
- Mexican 2%
- Common ancestry
- Lithuanian 13% Slovak 2%
- Foreign-born
- 6% · Canada, Vietnam
- Languages at home
- 88% English-only · Spanish 8% Arabic 1% Vietnamese 1%
Political lean MEDSL · St. Bernard
- 2024 margin
- Strong R (+29.3) · D 34.5% · R 63.8% · Other 1.7%
- 2008→2024 swing
- +16.1pp toward D · 2008: -45.4pp · 2024: -29.3pp
- All cycles
- 2024: R+29.3 2020: R+28.5 2016: R+33.4 2012: R+24.7 2008: R+45.4
Not yet ingested
- Civics
- —
Market trends
- HPI YoY
- ▼ -211.77%
- Current HPI
- 194.8123
- Rent YoY
- ▲ 3.11%
- Metro
- New Orleans-Metairie, LA
- State GDP YoY
- ▲ 3.29%
- F500 in state
- 10
Industry mix (Fortune 500 HQ in LA)
| Industry | F500 HQs | Revenue |
|---|---|---|
| Telecommunications | 2 | $23B |
|
||
| Utilities | 1 | $12B |
|
||
| Wholesale / Distribution | 1 | $5B |
|
||
| Advertising | 1 | $2B |
|
||
Price history
+186.0% since first listed7 events — show timeline
- 2026-05-18 Listed $256,000 GSREIN
- 2026-04-30 Listed for Rent $1,400 GSREIN
- 2026-03-18 Rental Removed $1,400 GSREIN
- 2026-01-31 Listed for Rent $1,400 GSREIN
- 2025-09-12 Listed $124,250 AcadianaMLS
- 2025-09-12 Listed $124,250 AcadianaMLS
- 1998-01-12 Sold (Public Records) $89,500 Public Records
Property tax history
+1.0%/yrLatest (2025): $1,309 · -0.7% YoY. Source: county tax records.
Cash-flow waterfall
monthlySold comps — $/sqft
last 12 mo · ≤1 miLoading sold comps…