106A Granite Rd · Harrisonburg, VA
Flood risk No data
- FEMA flood zone
- —
- Chance of flooding over 30 yrs
- —
- Est. flood insurance / yr
- —
Fire risk No data
- Est. fire insurance / yr
- —
Heat risk No data
- Hot days now (above threshold)
- —
- Hot days in 30 yrs
- —
Wind risk No data
- Chance of severe wind over 30 yrs
- —
Air-quality risk No data
- Unhealthy air days now
- —
- Unhealthy air days in 30 yrs
- —
Risk factors via First Street. Map © Google.
Why this score? — see what drove the D grade
The composite is a weighted blend of 9 inputs, each scored 0–100. Each bar is that input's sub-score; the figure is the points it added to the 100-point composite (weight × sub-score).
- Cash flow +10.1/30.0
- ARV discount +7.1/15.0
- Schools +4.8/10.0
- Condition / age +4.8/5.0
- Livability +4.2/5.0
- Rent growth +4.1/5.0
- 1% rule +3.7/10.0
- DSCR +2.9/10.0
- Appreciation +0.0/10.0
$265,990
🖨 Deal sheet (PDF) 📄 Offer letter ✓ Due diligence
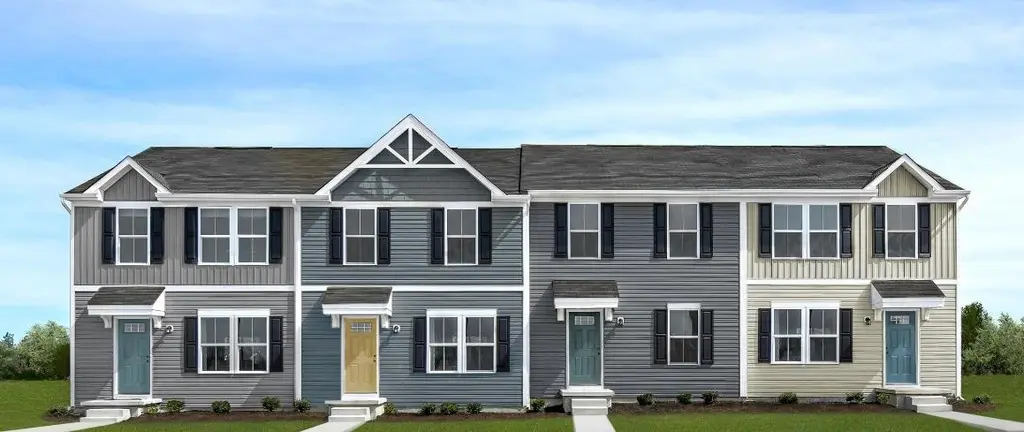
Listing remarks
Juniper floorplan in Boulder Ridge to be built for Summer 2026! Plus, for a limited time, receive an additional $10,000 in savings to help make your new home a reality. Located just minutes from downtown Harrisonburg, Boulder Ridge offers beautiful mountain views & convenience of included lawn and landscaping maintenance in a brand new home! The Juniper boasts an open concept design with 3 bedrooms, 2 full baths and a half bath on the main level, a spacious owner's suite with private bath & a walk-in closet. Enjoy a gourmet kitchen with maple cabinetry, kitchen island & all appliances included. Every new home in Boulder Ridge is tested, inspected & HERS® scored b
Key facts
- Gourmet kitchen
- Open concept design
- Kitchen island
Tags
Property features AI
Finance
- Other: New construction (builder as source for finished-area measurements); HERS Index Score indicated for green building verification
- HOA & community: Association with monthly fee of $145; Association covers common area maintenance, insurance, grounds maintenance, reserve fund, road maintenance, snow removal and trash; No association amenities listed
Exterior
- Parking: On-street parking
- Utilities: Public water; Public sewer; Cable available; Underground electric
- Home design: Attached property; Two levels; Entry foyer; Architectural roof
- Construction: Stick built with vinyl siding; Poured foundation and slab
- Exterior features: Townhouse; 2+ common walls; Sidewalks; Small lot (0.02 acre)
Interior
- Kitchen: Dishwasher; Electric range; Microwave; Refrigerator; Eat-in kitchen
- Bedrooms: Primary bedroom (Second level); Additional bedroom (Second level)
- Flooring: Carpet; Hardwood; Luxury vinyl plank
- Bathrooms: 2 full bathrooms; 1 half bathroom; 1 main-level bathroom
- Heating & cooling: Central heating (electric); Central air conditioning
- Interior features: Walk-in closets; Entrance foyer; Eat-in kitchen; Programmable thermostat; Insulated windows with screens
- Laundry & utility: Washer and dryer (located on second level)
Neighborhood map
What this means for you Summary
Snapshot
- This is a 3-bed/2.5-bath townhouse listed at $266k. Condition is rated excellent.
Deal economics
- At list price, monthly cash flow is $-155 ($-2k/yr) — negative.
- To cash-flow at today's rent, offer at most $244k (8.4% below list).
- To meet the 1% rule (rent ≥ 1% of price), the offer needs to be $231k (13.0% below list).
- Recommended offer: $231k (13.0% below list) — sets the bar for 1% rule.
- Cap rate 5.6% vs local median 3.8% in Harrisonburg — top-decile yield for the area; either an underpriced asset or a hidden risk that comps aren't pricing in. Stress-test before assuming the spread holds.
Location & tenants
- Location reads 84/100 on livability (#24 in VA, #666 nationally) — a professional / high-income tenant draw. Strengths: amenities A+, commute A+, health & safety A+; Watch: employment C-.
- Rockingham County Public School District (rural): math 47% / reading 64% proficiency, ranked #77 of 131 in VA (top 59%) — acceptable for families but not a draw, mixed tenant base, ~2y average lease.
- Zoned schools: Pleasant Valley Elementary (math 42% / reading 57%, grade D, #742 of 1,108 statewide, top 70%, 229 students, 66% FRL); Wilbur S. Pence Middle (math 46% / reading 64%, grade B-, #189 of 342 statewide, top 56%, 668 students, 39% FRL); Turner Ashby High (math 78% / reading 82%, grade A, #60 of 319 statewide, top 19%, 994 students, 35% FRL) — zoned schools average 47% FRL vs 32% district-wide (15 pts higher); higher-poverty schools than district average — tighter screening recommended.
- Market conditions: Rents rising fast (+6.5%/yr); 196 active listings in the ZIP; 2 comparable units currently listed for rent nearby; 683 units permitted in Rockingham County in 2024 (0 in 5+ unit buildings).
- This rent runs 39% of the median local income ($72k/yr) — at the standard rent-burdened threshold; future hikes will face affordability resistance.
Forward outlook
- Local home prices are declining (-3.0%/yr); year-one equity from $2k of loan paydown is wiped out by about $8k of value loss. Plan a longer hold.
- Rockingham County population projected at +6% by 2050 — modest demand growth; plan on rents tracking national, not racing it.
Negotiation context
- Only 12 days on market — expect competitive offers; lowballing is unlikely to land.
Questions for the listing agent
- What do current leases actually rent for vs. the listed asking? Can we see a recent rent roll and the last 12 months of T-12 income?
- What does the HOA fee cover, when was the last increase, and are there any pending special assessments or reserve-fund shortfalls?
- Is there a deadline driving the sale (1031 exchange, divorce, estate, relocation)? That informs how much negotiation room exists.
- The area grade is low — what's the realistic commute time and amenity access for the typical tenant pool here? Any planned neighborhood developments (good or bad) we should know about?
- What's the average days-on-market for RENTAL listings here right now (not sales)? A rising rental-DOM trend means longer vacancies and softer asking-rent achievability than the comps imply.
- What's the recent tenant-quality profile in this submarket — average credit score on applications, eviction rate, late-payment / NSF rate, and stable-employment percentage? A property-management company in the area should have these aggregated.
- How much new for-sale + rental construction is in the pipeline within 1–3 miles? Heavy new supply typically softens prices + rents 12–24 months out; constrained supply supports both.
Investment metrics
- 1% rule
- 0.87% ✗
- Cap rate
- 5.60%
- Cash-on-cash
- -2.49%
- DSCR
- 0.89
- GRM
- 9.6
CMA / ARV
- ARV (on-the-fly)
- $263,520
- Comps found
- 12
Show comp detail 12 sales within ~0.75 mi
| Address | Dist | Beds/Ba | Sqft | Sold | Price | $/sf | Match |
|---|---|---|---|---|---|---|---|
| 3333 Marble Loop | 0.02mi | 3/2.5 | 1,220 (0%) | 1mo | $264,000 | $216 | 98 |
| 3358 Marble Loop | 0.05mi | 3/2.5 | 1,220 (0%) | 6mo | $256,990 | $211 | 93 |
| 3384 Marble Loop | 0.06mi | 3/2.5 | 1,220 (0%) | 6mo | $249,990 | $205 | 92 |
| 3359 Obsidian Ter | 0.07mi | 3/2.0 | 1,369 (+12%) | 1mo | $384,000 | $280 | 73 |
| 3322 Debbie Ct | 0.27mi | 3/2.5 | 1,320 (+8%) | 2mo | $287,500 | $218 | 72 |
| 3021 Obsidian Ter | 0.15mi | 3/2.0 | 1,343 (+10%) | 4mo | $322,985 | $240 | 71 |
| 3360 Obsidian Ter | 0.09mi | 3/2.0 | 1,343 (+10%) | 8mo | $329,990 | $246 | 70 |
| 324 Diana Ct | 0.19mi | 2/2.0 (-1) | 1,296 (+6%) | 6mo | $275,000 | $212 | 69 |
| 3313 Impressions Ct | 0.29mi | 3/2.5 | 1,334 (+9%) | 3mo | $265,000 | $199 | 68 |
| 3032 Obsidian Ter | 0.12mi | 3/2.0 | 1,369 (+12%) | 6mo | $370,685 | $271 | 67 |
| 3200 Joppa Ct | 0.41mi | 3/2.0 | 1,332 (+9%) | 5mo | $259,900 | $195 | 59 |
| 3211 Joppa Ct | 0.40mi | 3/2.0 | 1,344 (+10%) | 7mo | $259,900 | $193 | 56 |
Match score weights: distance 35% · size 25% · config 20% · recency 20%. Top-matched comps best support the ARV.
Projected returns pro-forma
-3.0% appreciation · 6.48% rent growth · sell at horizon
- IRR
- -16.3%
- Equity multiple
- 0.40×
- Total profit
- $-44,442
- Equity at exit
- $39,660
- IRR
- -2.4%
- Equity multiple
- 0.81×
- Total profit
- $-13,907
- Equity at exit
- $22,998
Cash invested: $74,477 (down + closing). Projections, not guarantees.
Landlord ↔ Tenant lean methodology
- Overall (STATE)
- 55 Moderately Landlord-Leaning
- State Virginia
- 55 Moderately Landlord-Leaning · D+2
- County
- — inherits STATE
- City
- — inherits STATE
ZIP-level market 22801
- Rents YoY
- 6.5%
- Active inventory
- 196
- Price-to-rent
- 9.6×
Monthly cashflow live
- Estimated rent
- $2,315 medium interval (Pro) →
- Mortgage (P&I)
- −$1,395
- Tax est. 1.5%
- −$332 /mo · $3,990/yr
- Insurance
- −$111
- HOA
- −$145
- Vacancy / Maint / Mgmt
- −$486
- Net cashflow
- $-155
Break-even live
Sensitivity live
| Price | -10% $29 | -5% $-63 | +0% $-155 | +5% $-247 | +10% $-338 |
|---|---|---|---|---|---|
| Rent | -10% $-338 | -5% $-246 | +0% $-155 | +5% $-63 | +10% $28 |
| Rate | -1.0pp $-21 | -0.5pp $-87 | base $-155 | +0.5pp $-224 | +1.0pp $-294 |
UW: 25.0% down · 7.5% · 30yr · 1.5% tax · 5.0% vac · 8.0% maint · 8.0% mgmt
Financing live
Cash to close
- Down payment
- $66,498
- Closing costs
- $7,980
- Reserves months
- —
- Total cash needed
- —
Loan-product check · same deal, 3 products live
Conventional
25% down · 7.5% · 30yr
- Down + closing
- —
- Monthly P&I
- —
- Monthly cashflow
- —
- DSCR
- —
- Eligible?
- —
Personal DTI + credit; lowest rate.
DSCR
20% down · 8.5% · 30yr
- Down + closing
- —
- Monthly P&I
- —
- Monthly cashflow
- —
- DSCR
- —
- Eligible?
- —
No personal income docs; deal must DSCR.
Hard money
10% down · 12.0% · 12mo
- Down + closing
- —
- Monthly P&I
- —
- Monthly cashflow
- —
- DSCR
- —
- Eligible?
- —
Short-term bridge; refi at stabilization.
Rent comps 2 comps
| Address | Beds | Baths | Sqft | Rent | $/sqft | DOM | Units | Dist |
|---|---|---|---|---|---|---|---|---|
| 3407 Granite Rd , VA | 3.0 | 2.5 | 1220 | $2,250 | $1.84 | 45d | 1 | 0.04mi |
| 2511 Millwood Loop Harrisonburg, VA | 2.0 | 2.5 | 1150 | $1,495 | $1.30 | 45d | 1 | 1.46mi |
HOA detail
- Monthly dues
- $145 · $1,740/yr
- Likely covers
- landscaping
Listing history 10 events
-
2026-06-22days on market $265,990 Active 12 DOM
-
2026-06-19days on market $265,990 Active 10 DOM
-
2026-06-18days on market $265,990 Active 9 DOM
-
2026-06-17days on market $265,990 Active 8 DOM
-
2026-06-16days on market $265,990 Active 7 DOM
-
2026-06-15days on market $265,990 Active 6 DOM
-
2026-06-14days on market $265,990 Active 4 DOM
-
2026-06-13days on market $265,990 Active 3 DOM
-
2026-06-10remarks 679-char remark
-
2026-06-10$265,990 Active 1 DOM
ⓘ Source: listings_history table (triggers on properties + properties_extension) + one-shot
backfill from property_details.listing_events for pre-trigger history.
Nearby sold comps map
Loading sold comps map…
Walkable amenities ~0.75 mi
Loading nearby amenities…
Taxation est. · year 1
- Rental income
- $27,775
- − Mortgage interest
- −$14,900
- − Property taxes
- −$3,990
- − Insurance
- −$1,330
- − Repairs & maintenance
- −$2,222
- − Management
- −$2,222
- − HOA
- −$1,740
- − Depreciation
- −$7,738
- Taxable loss
- −$6,366
- Est. tax savings @ 24.0%
- +$1,528
- After-tax cash flow
- $-328/yr
For passive investors: Depreciation is non-cash, so a rental often shows a tax loss while cash-flowing — sheltering income. Rental losses are passive: they offset passive income freely, and up to $25,000/yr can offset ordinary (W-2) income if you actively participate and your MAGI is under $100k (phasing out to $0 by $150k); unused losses carry forward. On sale, claimed depreciation is recaptured at up to 25%, and gains may owe capital-gains tax (a 1031 exchange can defer both). Figures are a year-1 estimate at your 24.0% rate — not tax advice; consult a CPA.
Condition & rehab AI · 10 photos
This townhouse is in excellent condition with a modern design and high-end finishes. It is move-in ready and offers a great value for both resale and rental markets.
Value-add opportunities
- Both Painting the exterior and interior walls — Fresh paint can enhance curb appeal and interior aesthetics.
- Both Updating the flooring in the bedrooms — Carpet can be replaced with hardwood or tile to increase value.
- Both Upgrading the kitchen appliances — Modern appliances can attract more buyers and renters.
- Both Adding smart home features — Smart home features can increase the home's appeal and marketability.
- Both Landscaping improvements — Enhanced landscaping can improve curb appeal and attract more buyers and renters.
Renovation cost estimate screening
Value-add ROI direction
- Both Painting the exterior and interior walls — Fresh paint can enhance curb appeal and interior aesthetics. ↑
- Both Updating the flooring in the bedrooms — Carpet can be replaced with hardwood or tile to increase value. ↑
- Both Upgrading the kitchen appliances — Modern appliances can attract more buyers and renters. ↑
- Both Adding smart home features — Smart home features can increase the home's appeal and marketability. ↑
- Both Landscaping improvements — Enhanced landscaping can improve curb appeal and attract more buyers and renters. ↑
ⓘ Cost ranges are severity-bucket heuristics (US national rule-of-thumb). Get contractor quotes + a written scope before underwriting a rehab budget.
Schools (NCES district)
- District
- Rockingham County Public School District
- NCES district ID
- 5103390
- Math proficiency
- 47% ▼ -36.00%
- Reading proficiency
- 64% ▼ -12.00%
- Median HH income
- $53,178
- Composite
- 47.58/100
- National rank
- #2264
- State rank
- #77 of 131 in VA
Livability — Harrisonburg
- Score
- 84/100
- State rank
- #24
- US rank
- #666
Category grades
Schools grade is shown separately in the Schools card above.
Census & demographics
- County
- Harrisonburg City · 70,357 people
- City population
- 70,357
- Metro
- Harrisonburg, VA
- Population (ZIP)
- 39,983
- Household income
- $72,067
- Rent vs Own
- Severe rent burden
- 2712.0
Population outlook (Rockingham County) Hauer SSP2
- Today (2025)
- 83,435 people
- By 2030
- 85,223 · +2.1%
- By 2040
- 87,667 · +5.1%
- By 2050
- 88,550 · +6.1%
- By 2075
- 90,331 · +8.3%
- By 2100
- 85,122 · +2.0%
Race, ethnicity, and origin ACS 2023
- Neighborhood character
- Predominantly White (68%)
- Race & ethnicity
- White 68% Hispanic / Latino 18% Two or more races 12% Black 6% Asian 3%
- Hispanic origin (detail)
- Mexican 3% Puerto Rican 4% Dominican 1%
- Common ancestry
- Italian 2% Slovak 2% Romanian 2%
- Foreign-born
- 16% · Canada, South Korea, Vietnam
- Languages at home
- 76% English-only · Spanish 15% Russian/Polish/Slavic 2% Arabic 1%
Political lean MEDSL · Rockingham
- 2024 margin
- Solid R (+37.0) · D 30.9% · R 68.0% · Other 1.1%
- 2008→2024 swing
- -1.0pp toward R · 2008: -36.0pp · 2024: -37.0pp
- All cycles
- 2024: R+37.0 2020: R+40.4 2016: R+43.5 2012: R+40.6 2008: R+36.0
Not yet ingested
- Civics
- —
Market trends
- HPI YoY
- ▼ -222.01%
- Current HPI
- 166.3265
- Rent YoY
- ▲ 6.48%
- Metro
- Harrisonburg, VA
- State GDP YoY
- ▲ 2.40%
- F500 in state
- 50
Industry mix (Fortune 500 HQ in VA)
| Industry | F500 HQs | Revenue |
|---|---|---|
| Aerospace / Defense | 4 | $236B |
|
||
| Technology / Defense | 3 | $32B |
|
||
| Financial Services | 2 | $176B |
|
||
| Utilities | 2 | $27B |
|
||
| Insurance | 2 | $25B |
|
||
| Technology | 2 | $15B |
|
||
Price history
1 event — show timeline
- 2026-06-09 Listed $265,990 HRAR
Cash-flow waterfall
monthlySold comps — $/sqft
last 12 mo · ≤1 miLoading sold comps…