 Duplex
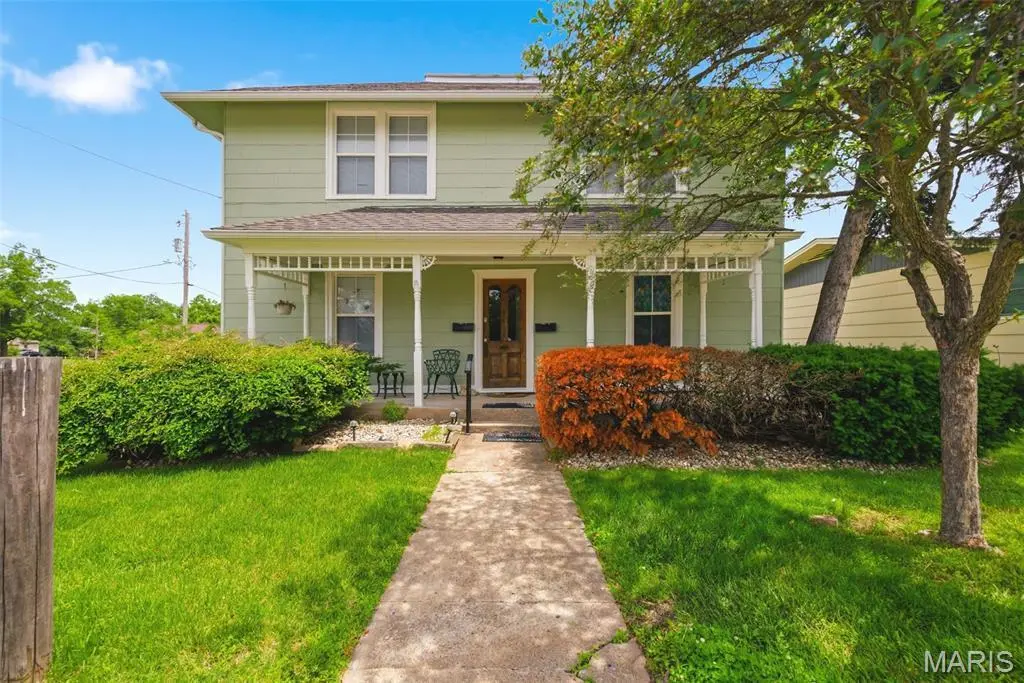
502 S Linn Ave · Wentzville, MO
Flood risk 1/10 · Minimal
- FEMA flood zone
- X (unshaded)
- Chance of flooding over 30 yrs
- 0.0%
- Est. flood insurance / yr
- $473 – $860
Fire risk 1/10 · Minimal
- Est. fire insurance / yr
- $1,054 – $1,958
Heat risk 4/10 · Minor
- Hot days now (above 106°F)
- 7 days/yr
- Hot days in 30 yrs
- 20 days/yr
Wind risk 2/10 · Minimal
- Chance of severe wind over 30 yrs
- 1.0%
Air-quality risk 1/10 · Minimal
- Unhealthy air days now
- 0 days/yr
- Unhealthy air days in 30 yrs
- 0 days/yr
Risk factors via First Street. Map © Google.
Why this score? — see what drove the D grade
The composite is a weighted blend of 9 inputs, each scored 0–100. Each bar is that input's sub-score; the figure is the points it added to the 100-point composite (weight × sub-score).
- Cash flow +14.7/30.0
- ARV discount +7.5/15.0
- DSCR +4.5/10.0
- Schools +4.3/10.0
- Livability +4.0/5.0
- Rent growth +3.5/5.0
- 1% rule +3.1/10.0
- Condition / age +2.5/5.0
- Appreciation +0.0/10.0
$395,000
🖨 Deal sheet (PDF) 📄 Offer letter ✓ Due diligence
Multi-family units
County records classify this as Multi-Family (2-4 Unit). Listing-text estimate: 2 units. confirmed
Listing remarks MLS
Wentzville Schools! Resting upon a large level corner lot, this spacious duplex offers 2 apartment style 2-bedroom units along with a large utility shed & 2-car side-entry detached garage. Both units have interior front entrances & separate rear egress. Tenants will enjoy a large living room, eat-in kitchen & 2 nice-sized bedrooms. The main floor unit has 2 walk-outs to the long glass-enclosed back porch. Set an Appointment to view this one Today!
Key facts
- Historic downtown
- Updated finishes
- Large yard
Tags
Property features AI
Finance
- Financial info: Residential income property with 2 total units
Exterior
- Parking: Detached garage (1 garage space)
- Utilities: Public water; No additional utilities listed
- Home design: Duplex / Multi-family residential income property; 2–4 unit property type
- Construction: Frame construction
- Exterior features: Frame construction; No notable exterior amenities listed
Interior
- Kitchen: Dishwasher; Built-in electric range; Microwave; Refrigerator; Disposal
- Bedrooms: Two 2-bedroom units
- Bathrooms: Each unit has 1 bathroom
- Heating & cooling: Forced air heating (natural gas); Zoned cooling
- Interior features: Dishwasher; Disposal; Microwave; Built-in electric range; Refrigerator
- Laundry & utility: Stacked washer/dryer; Washer and dryer included
Neighborhood map
What this means for you Summary
Snapshot
- This is a 2 × 2-bed/1.0-bath units multifamily listed at $395k.
Deal economics
- At list price, monthly cash flow is $102 ($1k/yr) — positive. Per door: $51/mo.
- The deal already cash-flows at list — no discount required.
- To meet the 1% rule (rent ≥ 1% of price), the offer needs to be $321k (18.8% below list).
- Recommended offer: $321k (18.8% below list) — sets the bar for 1% rule.
- Cap rate 6.6% vs local median 3.4% in Wentzville — top-decile yield for the area; either an underpriced asset or a hidden risk that comps aren't pricing in. Stress-test before assuming the spread holds.
Location & tenants
- Location reads 81/100 on livability (#14 in MO, #1,402 nationally) — a professional / high-income tenant draw. Strengths: crime A+, employment A+, housing A+; Watch: commute F.
- Wentzville R-IV (suburban): math 44% / reading 52% proficiency, ranked #32 of 324 in MO (top 10%) — families likely to look elsewhere, expect single-tenant / working-renter base with shorter leases; only 18% free/reduced lunch — higher-income household profile.
- Zoned schools: Heritage Primary (491 students, 28% FRL); Wentzville Middle (math 40% / reading 42%, grade F, #172 of 391 statewide, top 46%, 794 students, 19% FRL); Emil E. Holt Sr. High (math 48% / reading 58%, grade C-, #88 of 521 statewide, top 17%, 1,273 students, 12% FRL) — zoned schools at 20% FRL track the district average.
- Market conditions: Rents rising (+4.0%/yr); 700 active listings in the ZIP; 2 comparable units currently listed for rent nearby; high-income renter base; 2,021 units permitted in St. Charles County in 2024 (568 in 5+ unit buildings).
- This rent runs 34% of the median local income ($112k/yr) — at the standard rent-burdened threshold; future hikes will face affordability resistance.
Forward outlook
- Local home prices are declining (-3.0%/yr); year-one equity from $3k of loan paydown is wiped out by about $12k of value loss. Plan a longer hold.
- St. Charles County population projected at +22% by 2050 — long-run rental-demand tailwind backs the buy-and-hold thesis.
Negotiation context
- Only 12 days on market — expect competitive offers; lowballing is unlikely to land.
- 18 sale attempts since 9y ago with the ask held roughly flat each time — persistent listings suggest the price (not the market) is what's stuck; bring a comps-based counter.
Risks & watch-outs
- Watch-outs: built in 1900 — expect roof / HVAC / electrical / plumbing capex.
Questions for the listing agent
- Can we see the unit-by-unit rent roll, current vacancy, and any below-market leases? What's the average tenancy length?
- What capital expenditures (roof, boiler, parking lot, exteriors) have been made in the last 5 years, and what's planned in the next 2?
- Built in 1900 — when were the roof, HVAC, electrical panel, plumbing, and water heater last replaced?
- Is there a deadline driving the sale (1031 exchange, divorce, estate, relocation)? That informs how much negotiation room exists.
- Schools are B-rated — typically a magnet for longer-tenancy family renters. What's the average tenant stay here, and is there a school-zone premium baked into asking?
- The area grade is low — what's the realistic commute time and amenity access for the typical tenant pool here? Any planned neighborhood developments (good or bad) we should know about?
- What's the average days-on-market for RENTAL listings here right now (not sales)? A rising rental-DOM trend means longer vacancies and softer asking-rent achievability than the comps imply.
- What's the recent tenant-quality profile in this submarket — average credit score on applications, eviction rate, late-payment / NSF rate, and stable-employment percentage? A property-management company in the area should have these aggregated.
- How much new apartment / multifamily construction is in the pipeline within 1–3 miles? Heavy new supply (>2% of stock underway) typically softens rents 12–24 months out; light construction supports rent growth.
Investment metrics
- 1% rule
- 0.81% ✗
- Cap rate
- 6.60%
- Cash-on-cash
- 1.10%
- DSCR
- 1.05
- GRM
- 10.3
CMA / ARV
No comps found within radius.
Projected returns pro-forma
-3.0% appreciation · 3.96% rent growth · sell at horizon
- IRR
- -13.6%
- Equity multiple
- 0.51×
- Total profit
- $-54,533
- Equity at exit
- $58,896
- IRR
- -3.5%
- Equity multiple
- 0.76×
- Total profit
- $-26,593
- Equity at exit
- $34,152
Cash invested: $110,600 (down + closing). Projections, not guarantees.
Landlord ↔ Tenant lean methodology
- Overall (STATE)
- 81 Strongly Landlord-Friendly
- State Missouri
- 81 Strongly Landlord-Friendly · R+10
- County
- — inherits STATE
- City
- — inherits STATE
ZIP-level market 63385
- Home prices YoY
- -31.2%
- Rents YoY
- 4.0%
- Active inventory
- 700
- Price-to-rent
- 20.5×
Monthly cashflow live
- Estimated rent
- $3,209 medium interval (Pro) →
- Mortgage (P&I)
- −$2,071
- Tax from tax record
- −$197 /mo · $2,369/yr
- Insurance
- −$165
- HOA
- −$0
- Vacancy / Maint / Mgmt
- −$674
- Net cashflow
- $102
Break-even live
Sensitivity live
| Price | -10% $325 | -5% $214 | +0% $102 | +5% $-10 | +10% $-122 |
|---|---|---|---|---|---|
| Rent | -10% $-152 | -5% $-25 | +0% $102 | +5% $228 | +10% $355 |
| Rate | -1.0pp $301 | -0.5pp $202 | base $102 | +0.5pp $-1 | +1.0pp $-105 |
2-unit breakdown (identical units grouped — click to expand)
| Units | Beds | Baths | Est. rent |
|---|---|---|---|
| 2× units | 2 | 1 | $3,208 |
| #1 | 2 | 1 | $1,604 |
| #2 | 2 | 1 | $1,604 |
| Total (2 units) | $3,209 | ||
UW: 25.0% down · 7.5% · 30yr · 1.5% tax · 5.0% vac · 8.0% maint · 8.0% mgmt
Financing live
Cash to close
- Down payment
- $98,750
- Closing costs
- $11,850
- Reserves months
- —
- Total cash needed
- —
Loan-product check · same deal, 3 products live
Conventional
25% down · 7.5% · 30yr
- Down + closing
- —
- Monthly P&I
- —
- Monthly cashflow
- —
- DSCR
- —
- Eligible?
- —
Personal DTI + credit; lowest rate.
DSCR
20% down · 8.5% · 30yr
- Down + closing
- —
- Monthly P&I
- —
- Monthly cashflow
- —
- DSCR
- —
- Eligible?
- —
No personal income docs; deal must DSCR.
Hard money
10% down · 12.0% · 12mo
- Down + closing
- —
- Monthly P&I
- —
- Monthly cashflow
- —
- DSCR
- —
- Eligible?
- —
Short-term bridge; refi at stabilization.
Rent comps 2 comps
| Address | Beds | Baths | Sqft | Rent | $/sqft | DOM | Units | Dist |
|---|---|---|---|---|---|---|---|---|
| 122 Peruque Estates Ln Wentzville, MO | 4.0 | 2.5 | 1852 | $2,200 | $1.19 | 45d | 1 | 0.73mi |
| 209 Pecan Bluffs Dr Wentzville, MO | 3.0 | 2.5 | 1728 | $2,295 | $1.33 | 45d | 1 | 0.79mi |
Listing history 9 events
-
2026-06-21days on market $395,000 Active 12 DOM
-
2026-06-18days on market $395,000 Active 9 DOM
-
2026-06-17days on market $395,000 Active 8 DOM
-
2026-06-16days on market $395,000 Active 7 DOM
-
2026-06-15days on market $395,000 Active 6 DOM
-
2026-06-13days on market $395,000 Active 4 DOM
-
2026-06-13days on market $395,000 Active 3 DOM
-
2026-06-10remarks 671-char remark
-
2026-06-10$395,000 Active 1 DOM
ⓘ Source: listings_history table (triggers on properties + properties_extension) + one-shot
backfill from property_details.listing_events for pre-trigger history.
Tax reassessment forecast MO · Resets to sale price
- Current annual tax
- $2,369 · $197/mo
- Projected year-2 tax
- $3,832 · $319/mo
- Expected delta
- +$1,463/yr (+$122/mo · 61.8%)
ⓘ Screening estimate from a state-policy table — verify with the county assessor before closing.
Climate risk First Street
- Flood 1/10 Low FEMA zone X (unshaded) · 0% chance over 30 yrs
- Wildfire 1/10 Low
- Heat 4/10 Moderate 7 d/yr ≥106°F today · 20 d/yr by 30 yrs out
- Wind 2/10 Low 100% chance of damaging wind over 30 yrs
- Air quality 1/10 Low 0 unhealthy d/yr today · 0 by 30 yrs out
Nearby sold comps map
Loading sold comps map…
Walkable amenities ~0.75 mi
Loading nearby amenities…
Taxation est. · year 1
- Rental income
- $38,508
- − Mortgage interest
- −$22,126
- − Property taxes
- −$2,369
- − Insurance
- −$1,975
- − Repairs & maintenance
- −$3,081
- − Management
- −$3,081
- − Depreciation
- −$11,491
- Taxable loss
- −$5,614
- Est. tax savings @ 24.0%
- +$1,347
- After-tax cash flow
- $2,568/yr
For passive investors: Depreciation is non-cash, so a rental often shows a tax loss while cash-flowing — sheltering income. Rental losses are passive: they offset passive income freely, and up to $25,000/yr can offset ordinary (W-2) income if you actively participate and your MAGI is under $100k (phasing out to $0 by $150k); unused losses carry forward. On sale, claimed depreciation is recaptured at up to 25%, and gains may owe capital-gains tax (a 1031 exchange can defer both). Figures are a year-1 estimate at your 24.0% rate — not tax advice; consult a CPA.
Schools (NCES district)
- District
- Wentzville R-IV
- NCES district ID
- 2931650
- Math proficiency
- 44% ▼ -9.00%
- Reading proficiency
- 52% ▼ -7.00%
- Median HH income
- $74,961
- Composite
- 43.49/100
- National rank
- #2994
- State rank
- #32 of 324 in MO
Livability — Wentzville
- Score
- 81/100
- State rank
- #14
- US rank
- #1402
Category grades
Schools grade is shown separately in the Schools card above.
Census & demographics
- Census place
- Wentzville, MO
- County
- Saint Charles County · 399,703 people
- City population
- 51,330
- Metro
- St. Louis, MO-IL
- Population (ZIP)
- 51,330
- Household income
- $112,199
- Rent vs Own
- Severe rent burden
- 662.0
Population outlook (St. Charles County) Hauer SSP2
- Today (2025)
- 437,857 people
- By 2030
- 461,707 · +5.4%
- By 2040
- 503,222 · +14.9%
- By 2050
- 534,684 · +22.1%
- By 2075
- 597,047 · +36.4%
- By 2100
- 609,682 · +39.2%
Race, ethnicity, and origin ACS 2023
- Neighborhood character
- Predominantly White (86%)
- Race & ethnicity
- White 86% Black 5% Two or more races 5% Hispanic / Latino 3% Asian 2%
- Common ancestry
- Lithuanian 3% Romanian 3% Italian 2%
- Foreign-born
- 2% · Canada, China
- Languages at home
- 97% English-only · Spanish 2%
Political lean MEDSL · St. Charles
- 2024 margin
- R (+17.0) · D 40.8% · R 57.8% · Other 1.4%
- 2008→2024 swing
- -7.2pp toward R · 2008: -9.7pp · 2024: -17.0pp
- All cycles
- 2024: R+17.0 2020: R+17.5 2016: R+26.4 2012: R+21.0 2008: R+9.7
Not yet ingested
- Civics
- —
Market trends
- HPI YoY
- ▼ -97.98%
- Current HPI
- 216.4917
- Rent YoY
- ▲ 3.96%
- Metro
- St. Louis, MO-IL
- State GDP YoY
- ▲ 1.84%
- F500 in state
- 20
Industry mix (Fortune 500 HQ in MO)
| Industry | F500 HQs | Revenue |
|---|---|---|
| Healthcare | 1 | $163B |
|
||
| Insurance | 1 | $21B |
|
||
| Industrial Technology | 1 | $17B |
|
||
| Retail | 1 | $16B |
|
||
| Industrial Distribution | 1 | $10B |
|
||
| Utilities | 1 | $9B |
|
||
Price history
+324.7% since first listed40 events — show timeline
- 2026-06-09 Listed $395,000 MARIS as Distributed by MLS Grid
- 2025-08-13 Rental Removed $1,285 APPFOLIO
- 2025-07-31 Listed for Rent $1,285 APPFOLIO
- 2025-07-14 Rental Removed $1,300 APPFOLIO
- 2025-07-02 Price Changed $1,300 APPFOLIO
- 2025-05-17 Listed for Rent $1,395 APPFOLIO
- 2025-05-17 Rental Removed $1,395 APPFOLIO
- 2025-04-04 Listed for Rent $1,395 APPFOLIO
- 2025-04-04 Rental Removed $1,395 APPFOLIO
- 2025-03-27 Listed for Rent $1,395 APPFOLIO
- 2024-08-24 Rental Removed $1,250 BUILDIUM
- 2024-08-24 Rental Removed $1,250 BUILDIUM
- 2024-08-24 Listed for Rent $1,250 BUILDIUM
- 2024-08-24 Listed for Rent $1,250 BUILDIUM
- 2024-08-01 Rental Removed $1,250 BUILDIUM
- 2024-08-01 Rental Removed $1,250 BUILDIUM
- 2024-07-31 Listed for Rent $1,250 BUILDIUM
- 2024-07-31 Listed for Rent $1,250 BUILDIUM
- 2024-07-27 Rental Removed $1,250 BUILDIUM
- 2024-07-27 Rental Removed $1,250 BUILDIUM
- 2024-07-27 Listed for Rent $1,250 BUILDIUM
- 2024-07-27 Listed for Rent $1,175 BUILDIUM
- 2023-12-14 Rental Removed $1,195 BUILDIUM
- 2023-12-14 Rental Removed $1,195 BUILDIUM
- 2023-12-14 Listed for Rent $1,195 BUILDIUM
- 2023-12-14 Listed for Rent $1,195 BUILDIUM
- 2023-10-20 Rental Removed $1,195 BUILDIUM
- 2023-10-20 Rental Removed $1,195 BUILDIUM
- 2023-10-18 Listed for Rent $1,195 BUILDIUM
- 2023-10-18 Listed for Rent $1,090 BUILDIUM
- 2023-08-30 Rental Removed $1,090 BUILDIUM
- 2023-08-30 Rental Removed $1,090 BUILDIUM
- 2023-08-29 Listed for Rent $1,090 BUILDIUM
- 2023-08-29 Listed for Rent $1,250 BUILDIUM
- 2017-07-06 Sold (Public Records) — Public Records
- 2017-06-30 Sold (MLS) — MARIS as Distributed by MLS Grid
- 2017-06-02 Pending — MARIS as Distributed by MLS Grid
- 2017-05-19 Listed $93,000 MARIS as Distributed by MLS Grid
- 1984-08-01 Sold (Public Records) — Public Records
- 1984-03-01 Sold (Public Records) — Public Records
Property tax history
+7.0%/yrLatest (2025): $2,369 · -4.4% YoY. Source: county tax records.
Cash-flow waterfall
monthlySold comps — $/sqft
last 12 mo · ≤1 miLoading sold comps…