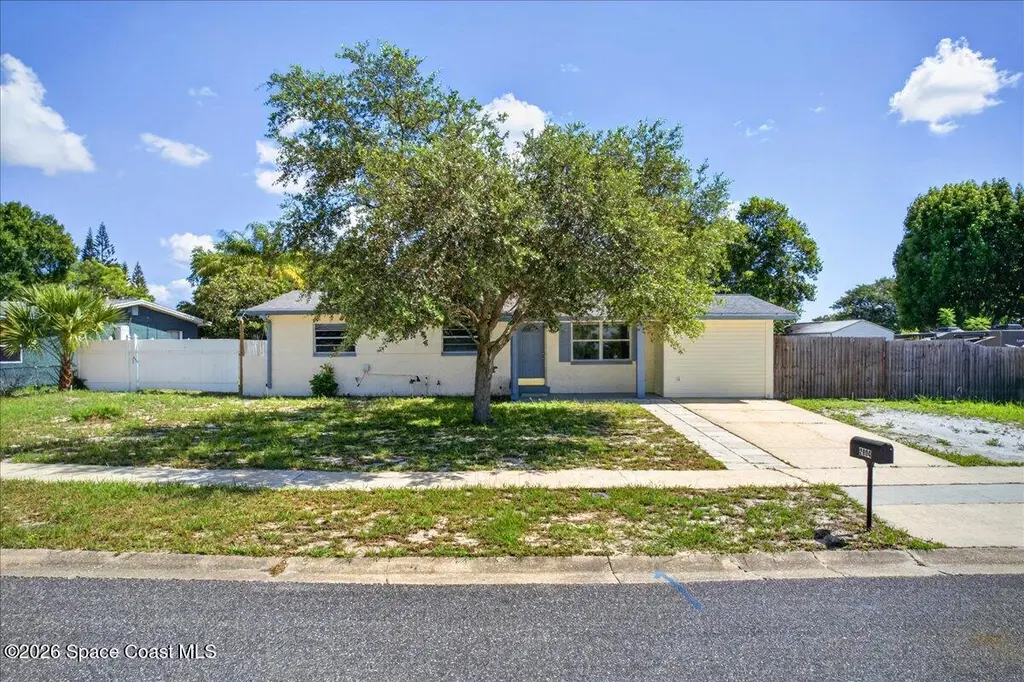
2804 Kenyon Ave · Cocoa, FL
Flood risk 1/10 · Minimal
- FEMA flood zone
- X (unshaded)
- Chance of flooding over 30 yrs
- 0.0%
- Est. flood insurance / yr
- $507 – $1,088
Fire risk 5/10 · Moderate
- Est. fire insurance / yr
- $947 – $1,759
Heat risk 10/10 · Severe
- Hot days now (above 106°F)
- 7 days/yr
- Hot days in 30 yrs
- 24 days/yr
Wind risk 10/10 · Severe
- Chance of severe wind over 30 yrs
- 99.0%
Air-quality risk 1/10 · Minimal
- Unhealthy air days now
- 0 days/yr
- Unhealthy air days in 30 yrs
- 0 days/yr
Risk factors via First Street. Map © Google.
Why this score? — see what drove the D- grade
The composite is a weighted blend of 9 inputs, each scored 0–100. Each bar is that input's sub-score; the figure is the points it added to the 100-point composite (weight × sub-score).
- Cash flow +10.7/30.0
- ARV discount +7.5/15.0
- Schools +4.7/10.0
- Rent growth +3.9/5.0
- Livability +3.6/5.0
- DSCR +3.1/10.0
- 1% rule +2.6/10.0
- Condition / age +2.5/5.0
- Appreciation +0.0/10.0
$249,000
🖨 Deal sheet (PDF) 📄 Offer letter ✓ Due diligence
Listing remarks MLS
Many renovations and upgrades, some finish work still needed for a personal touch. New kitchen, bath with cultured marble mosaic walls. Great tile work with laminate floors, newer windows, rear porch door to back yard with in ground youth pool, sprinkler system on reclaimed water. You can t afford to let this one go by. Converted carport makes house larger than tax records show.
Key facts
- Huge backyard
- High ground
- No hoa
Tags
Property features AI
Exterior
- Parking: Off-street parking
- Utilities: Public sewer; Electricity connected; Water connected; Sewer connected
- Home design: Single Family Residence; Living area approximately 1,200
- Construction: Block construction
- Exterior features: South-facing; Entry level: 1; Lot includes other features; Approximately 0.19 acres
Interior
- Bedrooms: 3 bedrooms
- Bathrooms: 2 full bathrooms
- Heating & cooling: Electric heating; Central air conditioning
- Interior features: Unfurnished
Neighborhood map
What this means for you Summary
Snapshot
- This is a 2-bed/1.0-bath single-family listed at $249k.
Deal economics
- At list price, monthly cash flow is $-118 ($-1k/yr) — negative.
- To cash-flow at today's rent, offer at most $228k (8.4% below list).
- To meet the 1% rule (rent ≥ 1% of price), the offer needs to be $189k (24.1% below list).
- Recommended offer: $189k (24.1% below list) — sets the bar for 1% rule.
Location & tenants
- Location reads 72/100 on livability (#344 in FL) — a middle-class / working-renter tenant base. Strengths: commute A+, cost of living A+, housing A+; Watch: crime F, amenities F, employment D-.
- Brevard (suburban): math 53% / reading 57% proficiency, ranked #19 of 73 in FL (top 26%) — acceptable for families but not a draw, mixed tenant base, ~2y average lease.
- Zoned schools: Cambridge Elementary Magnet School (math 38% / reading 31%, grade F, #1,709 of 2,144 statewide, top 81%, 495 students, 78% FRL); Cocoa High School (math 21% / reading 27%, grade F, #529 of 667 statewide, top 80%, 1,551 students, 73% FRL) — zoned schools average 76% FRL vs 43% district-wide (33 pts higher); higher-poverty schools than district average — tighter screening recommended.
- Zoned-school proficiency averages 29% at this address vs 55% district-wide (-26 pts) — the specific schools serving this property underperform the Brevard average; the district grade overstates school quality for this exact location.
- Market conditions: Rents rising fast (+5.6%/yr); 298 active listings in the ZIP; 12 comparable units currently listed for rent nearby; rentals at typical pace (median 24d on market — plan ~3-4 weeks tenant-placement turnaround); 4,602 units permitted in Brevard County in 2024 (702 in 5+ unit buildings).
- This rent runs 32% of the median local income ($71k/yr) — at the standard rent-burdened threshold; future hikes will face affordability resistance.
Forward outlook
- Local home prices are declining (-3.0%/yr); year-one equity from $2k of loan paydown is wiped out by about $7k of value loss. Plan a longer hold.
- Brevard County population projected at +15% by 2050 — modest demand growth; plan on rents tracking national, not racing it.
Negotiation context
- Only 14 days on market — expect competitive offers; lowballing is unlikely to land.
- 2 sale attempts since 19y ago with the ask held roughly flat each time — persistent listings suggest the price (not the market) is what's stuck; bring a comps-based counter.
- Current owner paid $68k; list at $249k implies a 265% gain — meaningful room to come down on a strong offer.
Risks & watch-outs
- Climate carrying-cost: severe wind risk, 99% chance of damaging wind over 30y; moderate wildfire risk; extreme-heat days projected 7→24/yr by 2055 (HVAC capex compounding) — expect insurance premiums to compound above CPI over the hold.
Questions for the listing agent
- What do current leases actually rent for vs. the listed asking? Can we see a recent rent roll and the last 12 months of T-12 income?
- Built in 1969 — when were the roof, HVAC, electrical panel, plumbing, and water heater last replaced?
- Is there a deadline driving the sale (1031 exchange, divorce, estate, relocation)? That informs how much negotiation room exists.
- Schools are B-rated — typically a magnet for longer-tenancy family renters. What's the average tenant stay here, and is there a school-zone premium baked into asking?
- Crime grade is F in this area — have there been break-ins, vandalism, or insurance claims at this property in the last 3 years? What carrier currently insures it and at what premium?
- The area grade is low — what's the realistic commute time and amenity access for the typical tenant pool here? Any planned neighborhood developments (good or bad) we should know about?
- What's the average days-on-market for RENTAL listings here right now (not sales)? A rising rental-DOM trend means longer vacancies and softer asking-rent achievability than the comps imply.
- What's the recent tenant-quality profile in this submarket — average credit score on applications, eviction rate, late-payment / NSF rate, and stable-employment percentage? A property-management company in the area should have these aggregated.
- How much new for-sale + rental construction is in the pipeline within 1–3 miles? Heavy new supply typically softens prices + rents 12–24 months out; constrained supply supports both.
Investment metrics
- 1% rule
- 0.76% ✗
- Cap rate
- 5.72%
- Cash-on-cash
- -2.03%
- DSCR
- 0.91
- GRM
- 11.0
CMA / ARV
No comps found within radius.
Projected returns pro-forma
-3.0% appreciation · 5.6% rent growth · sell at horizon
- IRR
- -17.0%
- Equity multiple
- 0.39×
- Total profit
- $-42,821
- Equity at exit
- $37,127
- IRR
- -5.0%
- Equity multiple
- 0.64×
- Total profit
- $-25,157
- Equity at exit
- $21,529
Cash invested: $69,720 (down + closing). Projections, not guarantees.
Landlord ↔ Tenant lean methodology
- Overall (STATE)
- 87 Strongly Landlord-Friendly
- State Florida
- 87 Strongly Landlord-Friendly · R+3
- County
- — inherits STATE
- City
- — inherits STATE
ZIP-level market 32926
- Home prices YoY
- -16.9%
- Rents YoY
- 5.6%
- Active inventory
- 298
- Price-to-rent
- 11.0×
Monthly cashflow live
- Estimated rent
- $1,890 high interval (Pro) →
- Mortgage (P&I)
- −$1,306
- Tax from tax record
- −$201 /mo · $2,416/yr
- Insurance
- −$104
- HOA
- −$0
- Lot rent
- −$0
- Vacancy / Maint / Mgmt
- −$397
- Net cashflow
- $-118
Break-even live
Sensitivity live
| Price | -10% $23 | -5% $-47 | +0% $-118 | +5% $-188 | +10% $-259 |
|---|---|---|---|---|---|
| Rent | -10% $-267 | -5% $-192 | +0% $-118 | +5% $-43 | +10% $31 |
| Rate | -1.0pp $8 | -0.5pp $-55 | base $-118 | +0.5pp $-182 | +1.0pp $-248 |
UW: 25.0% down · 7.5% · 30yr · 1.5% tax · 5.0% vac · 8.0% maint · 8.0% mgmt
Financing live
Cash to close
- Down payment
- $62,250
- Closing costs
- $7,470
- Reserves months
- —
- Total cash needed
- —
Loan-product check · same deal, 3 products live
Conventional
25% down · 7.5% · 30yr
- Down + closing
- —
- Monthly P&I
- —
- Monthly cashflow
- —
- DSCR
- —
- Eligible?
- —
Personal DTI + credit; lowest rate.
DSCR
20% down · 8.5% · 30yr
- Down + closing
- —
- Monthly P&I
- —
- Monthly cashflow
- —
- DSCR
- —
- Eligible?
- —
No personal income docs; deal must DSCR.
Hard money
10% down · 12.0% · 12mo
- Down + closing
- —
- Monthly P&I
- —
- Monthly cashflow
- —
- DSCR
- —
- Eligible?
- —
Short-term bridge; refi at stabilization.
Rent comps 12 comps
| Address | Beds | Baths | Sqft | Rent | $/sqft | DOM | Units | Dist |
|---|---|---|---|---|---|---|---|---|
| 3070 Cirrus Dr Cocoa, FL | 3.0 | 1.0–2.0 | 1002 | $2,326 | $2.32 | 16d | 29 | 0.40mi |
| 3028 Winchester Dr Cocoa, FL | 3.0 | 2.0 | 1125 | $1,915 | $1.70 | 23d | 1 | 0.57mi |
| 1710 University Ln #408 Cocoa, FL | 2.0 | 2.0 | 864 | $1,400 | $1.62 | 16d | 1 | 0.73mi |
| 1704 University Ln #701 Cocoa, FL | 2.0 | 2.0 | 864 | $1,225 | $1.42 | 25d | 1 | 0.77mi |
| 312 Bellair Dr Cocoa, FL | 2.0 | 1.0 | 984 | $1,700 | $1.73 | 25d | 1 | 0.85mi |
| 1524 Clearlake Rd Cocoa, FL | 1.0–2.0 | 1.0 | 720 | $1,822 | $2.53 | 21d | 6 | 0.86mi |
| 1660 Rosetine St Unit 1 Cocoa, FL | 2.0 | 2.0 | 1200 | $1,645 | $1.37 | 21d | 1 | 0.91mi |
| 318 Lucerne Dr Cocoa, FL | 3.0 | 1.0 | 1145 | $1,700 | $1.48 | 21d | 1 | 0.91mi |
| 1514 Clearlake Rd #110 Cocoa, FL | 2.0 | 2.0 | 1070 | $1,295 | $1.21 | 25d | 1 | 0.94mi |
| 214 Lucerne Dr Unit 1381666P Cocoa, FL | 3.0 | 1.0 | 1151 | $3,539 | $3.07 | 16d | 1 | 0.97mi |
| 1202 Princeton Rd Cocoa, FL | 3.0 | 2.0 | 1473 | $2,150 | $1.46 | 25d | 1 | 1.20mi |
| 1706 Pineda St Cocoa, FL | 3.0 | 2.0 | 1020 | $1,700 | $1.67 | 25d | 1 | 1.26mi |
Listing history 9 events
-
2026-06-22days on market $249,000 Active 14 DOM
-
2026-06-18days on market $249,000 Active 11 DOM
-
2026-06-17days on market $249,000 Active 10 DOM
-
2026-06-16days on market $249,000 Active 9 DOM
-
2026-06-15days on market $249,000 Active 8 DOM
-
2026-06-14days on market $249,000 Active 6 DOM
-
2026-06-10days on market $249,000 Active 3 DOM
-
2026-06-07remarks 270-char remark
-
2026-06-07$249,000 Active 1 DOM
ⓘ Source: listings_history table (triggers on properties + properties_extension) + one-shot
backfill from property_details.listing_events for pre-trigger history.
Tax reassessment forecast FL · Resets to sale price
- Current annual tax
- $2,416 · $201/mo
- Projected year-2 tax
- $2,416 · $201/mo
- Expected delta
- $0/yr ($0/mo · 0.0%)
ⓘ Screening estimate from a state-policy table — verify with the county assessor before closing.
Climate risk First Street
- Flood 1/10 Low FEMA zone X (unshaded) · 0% chance over 30 yrs
- Wildfire 5/10 Major
- Heat 10/10 Extreme 7 d/yr ≥106°F today · 24 d/yr by 30 yrs out
- Wind 10/10 Extreme 99% chance of damaging wind over 30 yrs
- Air quality 1/10 Low 0 unhealthy d/yr today · 0 by 30 yrs out
Nearby sold comps map
Loading sold comps map…
Walkable amenities ~0.75 mi
Loading nearby amenities…
Taxation est. · year 1
- Rental income
- $22,679
- − Mortgage interest
- −$13,948
- − Property taxes
- −$2,416
- − Insurance
- −$1,245
- − Repairs & maintenance
- −$1,814
- − Management
- −$1,814
- − Depreciation
- −$7,244
- Taxable loss
- −$5,802
- Est. tax savings @ 24.0%
- +$1,393
- After-tax cash flow
- $-22/yr
For passive investors: Depreciation is non-cash, so a rental often shows a tax loss while cash-flowing — sheltering income. Rental losses are passive: they offset passive income freely, and up to $25,000/yr can offset ordinary (W-2) income if you actively participate and your MAGI is under $100k (phasing out to $0 by $150k); unused losses carry forward. On sale, claimed depreciation is recaptured at up to 25%, and gains may owe capital-gains tax (a 1031 exchange can defer both). Figures are a year-1 estimate at your 24.0% rate — not tax advice; consult a CPA.
Schools (NCES district)
- District
- Brevard
- NCES district ID
- 1200150
- Math proficiency
- 53% ▼ -9.00%
- Reading proficiency
- 57% ▼ -4.00%
- Median HH income
- $49,426
- Composite
- 46.86/100
- National rank
- #2370
- State rank
- #19 of 73 in FL
Livability — Cocoa
- Score
- 72/100
- State rank
- #344
- US rank
- #5979
Category grades
Schools grade is shown separately in the Schools card above.
Census & demographics
- Census place
- Cocoa, FL
- County
- Brevard County · 602,871 people
- City population
- 67,424
- Metro
- Palm Bay-Melbourne-Titusville, FL
- Population (ZIP)
- 23,505
- Household income
- $70,735
- Rent vs Own
- Severe rent burden
- 782.0
Population outlook (Brevard County) Hauer SSP2
- Today (2025)
- 623,254 people
- By 2030
- 648,420 · +4.0%
- By 2040
- 690,009 · +10.7%
- By 2050
- 715,669 · +14.8%
- By 2075
- 775,744 · +24.5%
- By 2100
- 776,687 · +24.6%
Race, ethnicity, and origin ACS 2023
- Neighborhood character
- Predominantly White (72%)
- Race & ethnicity
- White 72% Black 11% Hispanic / Latino 10% Two or more races 9% Asian 2%
- Hispanic origin (detail)
- Mexican 5% Puerto Rican 2%
- Common ancestry
- Romanian 2% Lithuanian 2% Italian 2%
- Foreign-born
- 5% · Canada, Vietnam, Jamaica
- Languages at home
- 91% English-only · Spanish 6% Vietnamese 1% German/W. Germanic 1%
Political lean MEDSL · Brevard
- 2024 margin
- Strong R (+20.8) · D 39.1% · R 59.9% · Other 1.0%
- 2008→2024 swing
- -10.4pp toward R · 2008: -10.4pp · 2024: -20.8pp
- All cycles
- 2024: R+20.8 2020: R+16.4 2016: R+19.8 2012: R+12.7 2008: R+10.4
Not yet ingested
- Civics
- —
Market trends
- HPI YoY
- ▼ -68.32%
- Current HPI
- 335.1251
- Rent YoY
- ▲ 5.60%
- Metro
- Palm Bay-Melbourne-Titusville, FL
- State GDP YoY
- ▲ 3.28%
- F500 in state
- 36
Industry mix (Fortune 500 HQ in FL)
| Industry | F500 HQs | Revenue |
|---|---|---|
| Industrial Technology | 2 | $29B |
|
||
| Insurance | 2 | $17B |
|
||
| Retail | 1 | $60B |
|
||
| Technology Distribution | 1 | $58B |
|
||
| Homebuilding | 1 | $35B |
|
||
| Technology Manufacturing | 1 | $35B |
|
||
Price history
+436.6% since first listed8 events — show timeline
- 2026-06-06 Listed $249,000 SCMLS
- 2016-08-16 Listing Removed — SCMLS
- 2008-02-19 Sold (Public Records) $68,300 Public Records
- 2007-03-22 Listed $99,900 SCMLS
- 2004-04-29 Sold (Public Records) $103,000 Public Records
- 2002-09-03 Sold (Public Records) $65,000 Public Records
- 2000-10-20 Sold (Public Records) $62,500 Public Records
- 1982-01-01 Sold (Public Records) $46,400 Public Records
Property tax history
+8.0%/yrLatest (2025): $2,416 · -1.4% YoY. Source: county tax records.
Cash-flow waterfall
monthlySold comps — $/sqft
last 12 mo · ≤1 miLoading sold comps…