 83-Plex
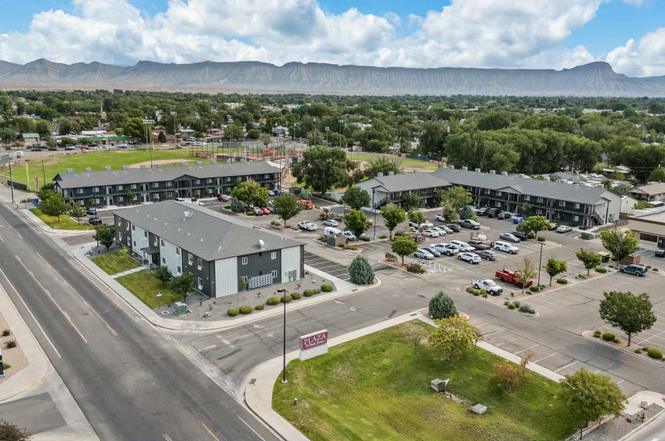
514 28 3/4 Rd · Grand Junction, CO
Flood risk 1/10 · Minimal
- FEMA flood zone
- X (unshaded)
- Chance of flooding over 30 yrs
- 0.0%
- Est. flood insurance / yr
- $507 – $1,088
Fire risk 1/10 · Minimal
- Est. fire insurance / yr
- $939 – $1,743
Heat risk 5/10 · Moderate
- Hot days now (above 96°F)
- 7 days/yr
- Hot days in 30 yrs
- 18 days/yr
Wind risk 1/10 · Minimal
- Chance of severe wind over 30 yrs
- —
Air-quality risk 2/10 · Minimal
- Unhealthy air days now
- 1 days/yr
- Unhealthy air days in 30 yrs
- 1 days/yr
Risk factors via First Street. Map © Google.
Why this score? — see what drove the B grade
The composite is a weighted blend of 9 inputs, each scored 0–100. Each bar is that input's sub-score; the figure is the points it added to the 100-point composite (weight × sub-score).
- Cash flow +30.0/30.0
- 1% rule +10.0/10.0
- DSCR +10.0/10.0
- ARV discount +7.5/15.0
- Appreciation +5.0/10.0
- Livability +4.0/5.0
- Schools +2.8/10.0
- Rent growth +2.5/5.0
- Condition / age +2.5/5.0
$4,740,000
🖨 Deal sheet (PDF) 📄 Offer letter ✓ Due diligence
Multi-family units
County records classify this as Multi-Family (5+ Unit). Listing-text estimate: 83 units. confirmed
5+ unit building — per-unit beds/baths from public records are typically unavailable; the breakdown below (if shown) is an estimate from the listing text.
Listing remarks
Incredible Investment Opportunity – Brand New Construction! Completed in 2025, this free-standing apartment building is part of a premium 83-unit community at 28 3/4 rd. and North Ave. It can be purchased individually or packaged with 512 (31 units $5,460,000) and 516 (28 units $5,580,000) for $15,780,000 This property includes 24 1 bedroom /1-bath apartments all with stackable washer/dryers with 8 units fully furnished. * Fully leased with excellent tenants * Prime central location at 28 3/4 Rd. & North Ave. —steps from Walmart, Texas Roadhouse, Del Taco & more * High-quality new construction by Grand Junction Real Estate Investments * Strong, stable income
Key facts
- 0.64 acre lot
- Built 2025
- Listed 197 days
Tags
Neighborhood map
What this means for you Summary
Snapshot
- This is a 83 × 1-bed/1.0-bath units multifamily listed at $4.74M.
Deal economics
- At list price, monthly cash flow is $51k ($614k/yr) — positive. Per door: $616/mo.
- The deal already cash-flows at list — no discount required.
- Meets the 1% rule at list price ($100k rent vs $4.74M).
- Recommended offer: $4.17M (12.0% below list) — sets the bar for market timing.
- Cap rate 19.2% vs local median 3.1% in Grand Junction — top-decile yield for the area; either an underpriced asset or a hidden risk that comps aren't pricing in. Stress-test before assuming the spread holds.
Location & tenants
- Location reads 79/100 on livability (#15 in CO, #2,222 nationally) — a middle-class / working-renter tenant base. Strengths: commute A+, health & safety A+, housing A; Watch: employment D+, crime F.
- Mesa County Valley School District No. 51 (suburban): math 26% / reading 38% proficiency, ranked #43 of 86 in CO (top 50%) — families likely to look elsewhere, expect single-tenant / working-renter base with shorter leases.
- Zoned schools: Nisley Elementary School (math 12% / reading 17%, grade F, #813 of 966 statewide, top 85%, 349 students, 80% FRL); Bookcliff Middle School (math 18% / reading 26%, grade F, #188 of 270 statewide, top 72%, 449 students, 59% FRL); Central High School (math 19% / reading 43%, grade F, #229 of 381 statewide, top 60%, 1,613 students, 45% FRL) — zoned schools average 61% FRL vs 39% district-wide (22 pts higher); higher-poverty schools than district average — tighter screening recommended.
- Market conditions: 3 active listings in the ZIP; 1,014 units permitted in Mesa County in 2024 (240 in 5+ unit buildings).
Forward outlook
- In year one you build about $175k of equity ($33k loan paydown + $142k appreciation (3.0% local appreciation)).
- At projected returns (3.0% appreciation + 3.0% rent growth), your $1.33M cash investment doubles in ~2 years — after that, you're playing with house money.
- By year 2, paydown + projected appreciation supports a ~$285k cash-out refi (75% LTV) — recoverable capital for the next deal without selling this one.
Negotiation context
- It's been on market 197 days — a 12% lower offer ($4.17M) is reasonable based on typical stale-listing flexibility.
- Current owner paid $150k; list at $4.74M implies a 3060% gain — meaningful room to come down on a strong offer.
Risks & watch-outs
- Climate carrying-cost: extreme-heat days projected 7→18/yr by 2055 (HVAC capex compounding) — expect insurance premiums to compound above CPI over the hold.
Questions for the listing agent
- It's been on market 197 days. Have you received any prior offers? Is the seller open to a 12% concession, seller financing, or rate buy-down credit?
- Can we see the unit-by-unit rent roll, current vacancy, and any below-market leases? What's the average tenancy length?
- What capital expenditures (roof, boiler, parking lot, exteriors) have been made in the last 5 years, and what's planned in the next 2?
- What does the HOA fee cover, when was the last increase, and are there any pending special assessments or reserve-fund shortfalls?
- Why hasn't it sold? Are there any deal-killer items the seller is aware of (foundation, flood, title, zoning, code violations)?
- Is there a deadline driving the sale (1031 exchange, divorce, estate, relocation)? That informs how much negotiation room exists.
- Schools are D-rated, which usually means shorter tenancies and higher turnover. Who's the typical renter profile here, and what's been the actual vacancy rate?
- Crime grade is F in this area — have there been break-ins, vandalism, or insurance claims at this property in the last 3 years? What carrier currently insures it and at what premium?
- What's the average days-on-market for RENTAL listings here right now (not sales)? A rising rental-DOM trend means longer vacancies and softer asking-rent achievability than the comps imply.
- What's the recent tenant-quality profile in this submarket — average credit score on applications, eviction rate, late-payment / NSF rate, and stable-employment percentage? A property-management company in the area should have these aggregated.
- How much new apartment / multifamily construction is in the pipeline within 1–3 miles? Heavy new supply (>2% of stock underway) typically softens rents 12–24 months out; light construction supports rent growth.
Investment metrics
- 1% rule
- 2.11% ✓
- Cap rate
- 19.24%
- Cash-on-cash
- 46.23%
- DSCR
- 3.06
- GRM
- 3.9
CMA / ARV
No comps found within radius.
Projected returns pro-forma
3.0% appreciation · 3.0% rent growth · sell at horizon
- IRR
- 51.5%
- Equity multiple
- 3.88×
- Total profit
- $3,826,015
- Equity at exit
- $2,131,309
- IRR
- 51.1%
- Equity multiple
- 7.82×
- Total profit
- $9,055,406
- Equity at exit
- $3,284,602
Cash invested: $1,327,200 (down + closing). Projections, not guarantees.
Landlord ↔ Tenant lean methodology
- Overall (STATE)
- 38 Tenant-Leaning
- State Colorado
- 38 Tenant-Leaning · D+4
- County
- — inherits STATE
- City
- — inherits STATE
ZIP-level market 81502
- Active inventory
- 3
- Price-to-rent
- 327.1×
Monthly cashflow live
- Estimated rent
- $100,244 high interval (Pro) →
- Mortgage (P&I)
- −$24,857
- Tax from tax record
- −$937 /mo · $11,249/yr
- Insurance
- −$1,975
- HOA
- −$295
- Vacancy / Maint / Mgmt
- −$21,051
- Net cashflow
- $51,128
Break-even live
Sensitivity live
| Price | -10% $53,811 | -5% $52,470 | +0% $51,128 | +5% $49,787 | +10% $48,445 |
|---|---|---|---|---|---|
| Rent | -10% $43,209 | -5% $47,169 | +0% $51,128 | +5% $55,088 | +10% $59,048 |
| Rate | -1.0pp $53,515 | -0.5pp $52,334 | base $51,128 | +0.5pp $49,900 | +1.0pp $48,650 |
83-unit breakdown (identical units grouped — click to expand)
| Units | Beds | Baths | Est. rent |
|---|---|---|---|
| 83× units | 1 | 1 | $100,264 |
| #1 | 1 | 1 | $1,208 |
| #2 | 1 | 1 | $1,208 |
| #3 | 1 | 1 | $1,208 |
| #4 | 1 | 1 | $1,208 |
| #5 | 1 | 1 | $1,208 |
| #6 | 1 | 1 | $1,208 |
| #7 | 1 | 1 | $1,208 |
| #8 | 1 | 1 | $1,208 |
| #9 | 1 | 1 | $1,208 |
| #10 | 1 | 1 | $1,208 |
| #11 | 1 | 1 | $1,208 |
| #12 | 1 | 1 | $1,208 |
| #13 | 1 | 1 | $1,208 |
| #14 | 1 | 1 | $1,208 |
| #15 | 1 | 1 | $1,208 |
| #16 | 1 | 1 | $1,208 |
| #17 | 1 | 1 | $1,208 |
| #18 | 1 | 1 | $1,208 |
| #19 | 1 | 1 | $1,208 |
| #20 | 1 | 1 | $1,208 |
| #21 | 1 | 1 | $1,208 |
| #22 | 1 | 1 | $1,208 |
| #23 | 1 | 1 | $1,208 |
| #24 | 1 | 1 | $1,208 |
| #25 | 1 | 1 | $1,208 |
| #26 | 1 | 1 | $1,208 |
| #27 | 1 | 1 | $1,208 |
| #28 | 1 | 1 | $1,208 |
| #29 | 1 | 1 | $1,208 |
| #30 | 1 | 1 | $1,208 |
| #31 | 1 | 1 | $1,208 |
| #32 | 1 | 1 | $1,208 |
| #33 | 1 | 1 | $1,208 |
| #34 | 1 | 1 | $1,208 |
| #35 | 1 | 1 | $1,208 |
| #36 | 1 | 1 | $1,208 |
| #37 | 1 | 1 | $1,208 |
| #38 | 1 | 1 | $1,208 |
| #39 | 1 | 1 | $1,208 |
| #40 | 1 | 1 | $1,208 |
| #41 | 1 | 1 | $1,208 |
| #42 | 1 | 1 | $1,208 |
| #43 | 1 | 1 | $1,208 |
| #44 | 1 | 1 | $1,208 |
| #45 | 1 | 1 | $1,208 |
| #46 | 1 | 1 | $1,208 |
| #47 | 1 | 1 | $1,208 |
| #48 | 1 | 1 | $1,208 |
| #49 | 1 | 1 | $1,208 |
| #50 | 1 | 1 | $1,208 |
| #51 | 1 | 1 | $1,208 |
| #52 | 1 | 1 | $1,208 |
| #53 | 1 | 1 | $1,208 |
| #54 | 1 | 1 | $1,208 |
| #55 | 1 | 1 | $1,208 |
| #56 | 1 | 1 | $1,208 |
| #57 | 1 | 1 | $1,208 |
| #58 | 1 | 1 | $1,208 |
| #59 | 1 | 1 | $1,208 |
| #60 | 1 | 1 | $1,208 |
| #61 | 1 | 1 | $1,208 |
| #62 | 1 | 1 | $1,208 |
| #63 | 1 | 1 | $1,208 |
| #64 | 1 | 1 | $1,208 |
| #65 | 1 | 1 | $1,208 |
| #66 | 1 | 1 | $1,208 |
| #67 | 1 | 1 | $1,208 |
| #68 | 1 | 1 | $1,208 |
| #69 | 1 | 1 | $1,208 |
| #70 | 1 | 1 | $1,208 |
| #71 | 1 | 1 | $1,208 |
| #72 | 1 | 1 | $1,208 |
| #73 | 1 | 1 | $1,208 |
| #74 | 1 | 1 | $1,208 |
| #75 | 1 | 1 | $1,208 |
| #76 | 1 | 1 | $1,208 |
| #77 | 1 | 1 | $1,208 |
| #78 | 1 | 1 | $1,208 |
| #79 | 1 | 1 | $1,208 |
| #80 | 1 | 1 | $1,208 |
| #81 | 1 | 1 | $1,208 |
| #82 | 1 | 1 | $1,208 |
| #83 | 1 | 1 | $1,208 |
| Total (83 units) | $100,244 | ||
UW: 25.0% down · 7.5% · 30yr · 1.5% tax · 5.0% vac · 8.0% maint · 8.0% mgmt
Financing live
Cash to close
- Down payment
- $1,185,000
- Closing costs
- $142,200
- Reserves months
- —
- Total cash needed
- —
Loan-product check · same deal, 3 products live
Conventional
25% down · 7.5% · 30yr
- Down + closing
- —
- Monthly P&I
- —
- Monthly cashflow
- —
- DSCR
- —
- Eligible?
- —
Personal DTI + credit; lowest rate.
DSCR
20% down · 8.5% · 30yr
- Down + closing
- —
- Monthly P&I
- —
- Monthly cashflow
- —
- DSCR
- —
- Eligible?
- —
No personal income docs; deal must DSCR.
Hard money
10% down · 12.0% · 12mo
- Down + closing
- —
- Monthly P&I
- —
- Monthly cashflow
- —
- DSCR
- —
- Eligible?
- —
Short-term bridge; refi at stabilization.
HOA detail
- Monthly dues
- $295 · $3,540/yr
Listing history 6 events
-
2026-04-02status Pending
-
2026-01-26price $4,740,000
-
2025-11-14price $5,000,000
-
2025-09-05$5,441,000 Active
-
2022-08-09soldstatus $150,000
-
2019-03-05soldstatus $605,000
ⓘ Source: listings_history table (triggers on properties + properties_extension) + one-shot
backfill from property_details.listing_events for pre-trigger history.
Tax reassessment forecast CO · Resets to sale price
- Current annual tax
- $11,249 · $937/mo
- Projected year-2 tax
- $26,070 · $2,172/mo
- Expected delta
- +$14,821/yr (+$1,235/mo · 131.7%)
ⓘ Screening estimate from a state-policy table — verify with the county assessor before closing.
Climate risk First Street
- Flood 1/10 Low FEMA zone X (unshaded) · 0% chance over 30 yrs
- Wildfire 1/10 Low
- Heat 5/10 Major 7 d/yr ≥96°F today · 18 d/yr by 30 yrs out
- Wind 1/10 Low
- Air quality 2/10 Low 1 unhealthy d/yr today · 1 by 30 yrs out
Nearby sold comps map
Loading sold comps map…
Walkable amenities ~0.75 mi
Loading nearby amenities…
Taxation est. · year 1
- Rental income
- $1,202,928
- − Mortgage interest
- −$265,514
- − Property taxes
- −$11,249
- − Insurance
- −$23,700
- − Repairs & maintenance
- −$96,234
- − Management
- −$96,234
- − HOA
- −$3,540
- − Depreciation
- −$137,891
- Taxable income
- $568,565
- Est. tax owed @ 24.0%
- −$136,456
- After-tax cash flow
- $477,083/yr
For passive investors: Depreciation is non-cash, so a rental often shows a tax loss while cash-flowing — sheltering income. Rental losses are passive: they offset passive income freely, and up to $25,000/yr can offset ordinary (W-2) income if you actively participate and your MAGI is under $100k (phasing out to $0 by $150k); unused losses carry forward. On sale, claimed depreciation is recaptured at up to 25%, and gains may owe capital-gains tax (a 1031 exchange can defer both). Figures are a year-1 estimate at your 24.0% rate — not tax advice; consult a CPA.
Schools (NCES district)
- District
- Mesa County Valley School District No. 51
- NCES district ID
- 0804350
- Math proficiency
- 26% ▲ 1.00%
- Reading proficiency
- 38% ▬ 0.00%
- Median HH income
- $50,189
- Composite
- 27.83/100
- National rank
- #6884
- State rank
- #43 of 86 in CO
Livability — Grand Junction
- Score
- 79/100
- State rank
- #15
- US rank
- #2222
Category grades
Schools grade is shown separately in the Schools card above.
Census & demographics
- Census place
- Grand Junction, CO
Population outlook (Mesa County) Hauer SSP2
- Today (2025)
- 153,000 people
- By 2030
- 154,479 · +1.0%
- By 2040
- 155,257 · +1.5%
- By 2050
- 153,384 · +0.3%
- By 2075
- 144,735 · -5.4%
- By 2100
- 123,825 · -19.1%
Not yet ingested
- Political lean
- —
- Race & ethnicity
- —
- Common origin
- —
- Civics
- —
Market trends
- HPI YoY
- —
- Current HPI
- —
- Rent YoY
- —
- Metro
- —
- State GDP YoY
- ▲ 1.95%
- F500 in state
- 14
Industry mix (Fortune 500 HQ in CO)
| Industry | F500 HQs | Revenue |
|---|---|---|
| Technology Distribution | 1 | $31B |
|
||
| Food / Agriculture | 1 | $18B |
|
||
| Packaging | 1 | $14B |
|
||
| Healthcare | 1 | $13B |
|
||
| Energy | 1 | $10B |
|
||
| Technology | 1 | $4B |
|
||
Price history
+683.5% since first listed6 events — show timeline
- 2026-04-02 Pending — GJARA
- 2026-01-26 Price Changed $4,740,000 GJARA
- 2025-11-14 Price Changed $5,000,000 GJARA
- 2025-09-05 Listed $5,441,000 GJARA
- 2022-08-09 Sold (Public Records) $150,000 Public Records
- 2019-03-05 Sold (Public Records) $605,000 Public Records
Property tax history
+31.5%/yrLatest (2025): $11,249 · +29.0% YoY. Source: county tax records.
Cash-flow waterfall
monthlySold comps — $/sqft
last 12 mo · ≤1 miLoading sold comps…