 Multi-family
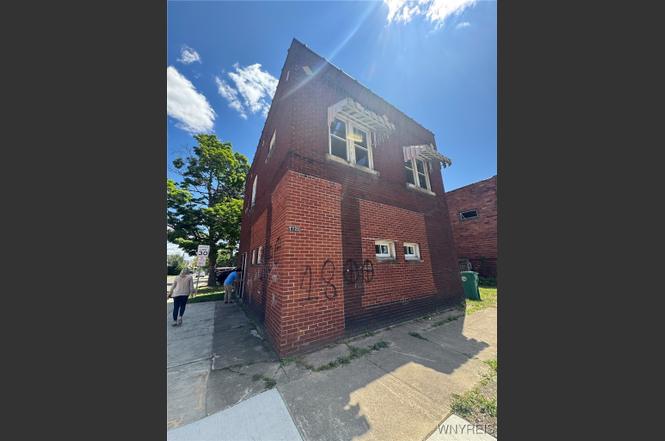
1805 Weston Ave · Niagara Falls, NY
Flood risk 1/10 · Minimal
- FEMA flood zone
- X (unshaded)
- Chance of flooding over 30 yrs
- 0.0%
- Est. flood insurance / yr
- $473 – $860
Fire risk 1/10 · Minimal
- Est. fire insurance / yr
- $691 – $1,283
Heat risk 2/10 · Minimal
- Hot days now (above 94°F)
- 7 days/yr
- Hot days in 30 yrs
- 15 days/yr
Wind risk 1/10 · Minimal
- Chance of severe wind over 30 yrs
- —
Air-quality risk 3/10 · Minor
- Unhealthy air days now
- 2 days/yr
- Unhealthy air days in 30 yrs
- 3 days/yr
Risk factors via First Street. Map © Google.
Why this score? — see what drove the D grade
The composite is a weighted blend of 9 inputs, each scored 0–100. Each bar is that input's sub-score; the figure is the points it added to the 100-point composite (weight × sub-score).
- Cash flow +15.0/30.0
- ARV discount +7.5/15.0
- 1% rule +5.0/10.0
- DSCR +5.0/10.0
- Livability +3.0/5.0
- Rent growth +2.5/5.0
- Schools +2.5/10.0
- Condition / age +2.5/5.0
- Appreciation +0.0/10.0
$50,000
🖨 Deal sheet 📄 Offer letter ✓ Due diligence
Multi-family units
County records classify this as Multi-Family (2-4 Unit). Listing-text estimate: 1 unit. estimate disagrees with records
Listing remarks
Welcome to a unique mixed-use investment property with tremendous potential and character! Situated on a highly visible neighborhood commercial corridor (18th Street/Weston), this property features: Historic storefront appeal easily could be reimagined into a shoppe or store with a corner entrance, large display windows, and light brick exterior, formerly a well-loved coffee shop in the 1970s. Now, the first floor lends to a 1 bedroom apartment that requires only modest updates. The upstairs 2 bedroom apartment as well is simple updates and has a living room and dining room so plenty of room for the new occupants. Upgrades completed: brand-new steps, newer windows, and cleared spaces re
Key facts
- Light brick exterior
- 1 bedroom apartment
- Corner entrance
Tags
Neighborhood map
What this means for you Summary
Snapshot
- This is a 2-bed/2.0-bath multifamily listed at $50k.
Deal economics
- At list price, monthly cash flow is $2k ($20k/yr) — positive.
- The deal already cash-flows at list — no discount required.
- Meets the 1% rule at list price ($3k rent vs $50k).
- Recommended offer: $44k (12.0% below list) — sets the bar for market timing.
- Cap rate 46.1% vs local median 7.7% in Niagara Falls — top-decile yield for the area; either an underpriced asset or a hidden risk that comps aren't pricing in. Stress-test before assuming the spread holds.
Location & tenants
- Location reads 60/100 on livability (#956 in NY) — a middle-class / working-renter tenant base. Strengths: cost of living A+, housing A+; Watch: schools F, crime F, amenities F.
- Niagara Falls City School District (urban): math 26% / reading 34% proficiency, ranked #578 of 590 in NY (top 98%) — families likely to look elsewhere, expect single-tenant / working-renter base with shorter leases; 66% free/reduced lunch — lower-income household profile, screen leases tightly.
- Market conditions: 142 active listings in the ZIP; 9 comparable units currently listed for rent nearby; rentals lingering (median 44d on market — plan ~5-8 weeks vacancy on turnover, expect pricing pressure); 56% of comp listings sitting > 30 days — soft ceiling on asking rent; 167 units permitted in Niagara County in 2024 (0 in 5+ unit buildings).
- At $2,630/mo this rent would consume 62% of the median local household income ($51k/yr) (locally 1095% of renters already pay >50% of income on rent) — very limited rent-growth headroom before tenants either downsize or default.
Forward outlook
- Local home prices are declining (-3.0%/yr); year-one equity from $346 of loan paydown is wiped out by about $2k of value loss. Plan a longer hold.
- Niagara County population projected at -19% by 2050 — secular population decline; favor cash flow + early exit over multi-decade hold.
- At projected returns (-3.0% appreciation + 3.0% rent growth), your $14k cash investment doubles in ~1 year — after that, you're playing with house money.
Negotiation context
- It's been on market 163 days — a 12% lower offer ($44k) is reasonable based on typical stale-listing flexibility.
- Current owner paid $23k; list at $50k implies a 117% gain — meaningful room to come down on a strong offer.
Risks & watch-outs
- Watch-outs: property tax is 3.2% of price; built in 1900 — expect roof / HVAC / electrical / plumbing capex.
Questions for the listing agent
- It's been on market 163 days. Have you received any prior offers? Is the seller open to a 12% concession, seller financing, or rate buy-down credit?
- Built in 1900 — when were the roof, HVAC, electrical panel, plumbing, and water heater last replaced?
- Property tax is high relative to price — has the assessment been appealed recently, and will the sale trigger a re-assessment?
- Why hasn't it sold? Are there any deal-killer items the seller is aware of (foundation, flood, title, zoning, code violations)?
- Is there a deadline driving the sale (1031 exchange, divorce, estate, relocation)? That informs how much negotiation room exists.
- Schools are F-rated, which usually means shorter tenancies and higher turnover. Who's the typical renter profile here, and what's been the actual vacancy rate?
- Crime grade is F in this area — have there been break-ins, vandalism, or insurance claims at this property in the last 3 years? What carrier currently insures it and at what premium?
- The area grade is low — what's the realistic commute time and amenity access for the typical tenant pool here? Any planned neighborhood developments (good or bad) we should know about?
- What's the average days-on-market for RENTAL listings here right now (not sales)? A rising rental-DOM trend means longer vacancies and softer asking-rent achievability than the comps imply.
- What's the recent tenant-quality profile in this submarket — average credit score on applications, eviction rate, late-payment / NSF rate, and stable-employment percentage? A property-management company in the area should have these aggregated.
- How much new apartment / multifamily construction is in the pipeline within 1–3 miles? Heavy new supply (>2% of stock underway) typically softens rents 12–24 months out; light construction supports rent growth.
Investment metrics
- 1% rule
- 5.26% ✓
- Cap rate
- 46.12%
- Cash-on-cash
- 142.23%
- DSCR
- 7.33
- GRM
- 1.6
CMA / ARV
- ARV (on-the-fly)
- $122,360
- Comps found
- 11
Show comp detail 11 sales within ~0.75 mi
| Address | Dist | Beds/Ba | Sqft | Sold | Price | $/sf | Match |
|---|---|---|---|---|---|---|---|
| 1805 Weston Ave | 0.00mi | 2/2.0 | 1,610 (0%) | 1mo | $20,000 | $12 | 99 |
| 2260 Weston Ave | 0.30mi | 3/2.0 (+1) | 1,540 (-4%) | 3mo | $135,000 | $88 | 71 |
| 2236 Linwood Ave | 0.26mi | 3/2.0 (+1) | 1,544 (-4%) | 8mo | $163,000 | $106 | 69 |
| 1970 Whitney Ave | 0.33mi | 3/2.0 (+1) | 1,562 (-3%) | 8mo | $122,000 | $78 | 68 |
| 1361 North Ave | 0.37mi | 3/2.0 (+1) | 1,711 (+6%) | 2mo | $76,000 | $44 | 66 |
| 2203 La Salle Ave | 0.41mi | 3/2.0 (+1) | 1,594 (-1%) | 18mo | $55,000 | $35 | 60 |
| 2252 La Salle Ave | 0.44mi | 3/2.0 (+1) | 1,635 (+2%) | 17mo | $107,900 | $66 | 58 |
| 2216 Forest Ave | 0.51mi | 3/2.0 (+1) | 1,650 (+2%) | 20mo | $160,000 | $97 | 50 |
| 2234 Willow Ave | 0.29mi | 3/2.0 (+1) | 1,386 (-14%) | 11mo | $105,000 | $76 | 49 |
| 1519 Whitney Ave | 0.36mi | 3/2.0 (+1) | 1,408 (-12%) | 12mo | $110,000 | $78 | 48 |
| 1208 17th St | 0.35mi | 3/2.0 (+1) | 1,378 (-14%) | 12mo | $92,500 | $67 | 44 |
Match score weights: distance 35% · size 25% · config 20% · recency 20%. Top-matched comps best support the ARV.
Projected returns pro-forma
-3.0% appreciation · 3.0% rent growth · sell at horizon
- IRR
- —
- Equity multiple
- 7.98×
- Total profit
- $97,667
- Equity at exit
- $7,455
- IRR
- —
- Equity multiple
- 16.82×
- Total profit
- $221,476
- Equity at exit
- $4,323
Cash invested: $14,000 (down + closing). Projections, not guarantees.
Landlord ↔ Tenant lean methodology
- Overall (STATE)
- 15 Strongly Tenant-Friendly
- State New York
- 15 Strongly Tenant-Friendly · D+10
- County
- — inherits STATE
- City
- — inherits STATE
ZIP-level market 14305
- Home prices YoY
- -10.9%
- Active inventory
- 142
- Price-to-rent
- 3.2×
Monthly cashflow live
- Estimated rent
- $2,630 high interval (Pro) →
- Mortgage (P&I)
- −$262
- Tax from tax record
- −$135 /mo · $1,624/yr
- Insurance
- −$21
- HOA
- −$0
- Vacancy / Maint / Mgmt
- −$552
- Net cashflow
- $1,659
Break-even live
2-unit breakdown (identical units grouped — click to expand)
| Units | Beds | Baths | Est. rent |
|---|---|---|---|
| 1× unit | 1 | 1 | $1,301 |
| 1× unit | 2 | 1 | $1,329 |
| Total (2 units) | $2,630 | ||
UW: 25.0% down · 7.5% · 30yr · 1.5% tax · 5.0% vac · 8.0% maint · 8.0% mgmt
Financing live
Cash to close
- Down payment
- $12,500
- Closing costs
- $1,500
- Reserves months
- —
- Total cash needed
- —
Loan-product check · same deal, 3 products live
Conventional
25% down · 7.5% · 30yr
- Down + closing
- —
- Monthly P&I
- —
- Monthly cashflow
- —
- DSCR
- —
- Eligible?
- —
Personal DTI + credit; lowest rate.
DSCR
20% down · 8.5% · 30yr
- Down + closing
- —
- Monthly P&I
- —
- Monthly cashflow
- —
- DSCR
- —
- Eligible?
- —
No personal income docs; deal must DSCR.
Hard money
10% down · 12.0% · 12mo
- Down + closing
- —
- Monthly P&I
- —
- Monthly cashflow
- —
- DSCR
- —
- Eligible?
- —
Short-term bridge; refi at stabilization.
Rent comps 9 comps
| Address | Beds | Baths | Sqft | Rent | $/sqft | DOM | Units | Dist |
|---|---|---|---|---|---|---|---|---|
| 1808 Whitney Ave Unit 3 Niagara Falls, NY | 2.0 | 1.0 | 1200 | $900 | $0.75 | 43d | 1 | 0.28mi |
| 1312 Ontario Ave Niagara Falls, NY | 2.0 | 1.0 | 1956 | $1,200 | $0.61 | 43d | 1 | 0.40mi |
| 1001 17th St Niagara Falls, NY | 3.0 | 1.0 | 1152 | $1,800 | $1.56 | 23d | 1 | 0.46mi |
| 784 15th St Niagara Falls, NY | 3.0 | 1.5 | 1380 | $1,350 | $0.98 | 3d | 1 | 0.54mi |
| 642 Ashland Ave Niagara Falls, NY | 3.0 | 1.0 | 1238 | $1,100 | $0.89 | 3d | 1 | 0.94mi |
| 700 Pine Ave Unit 1 Niagara Falls, NY | 1.0 | 1.0 | 1075 | $1,075 | $1.00 | 11d | 1 | 1.01mi |
| 1427 Fort Ave Unit 2 Niagara Falls, NY | 3.0 | 1.0 | 1058 | $950 | $0.90 | 43d | 1 | 1.07mi |
| 420 25th St Niagara Falls, NY | 3.0 | 1.0 | 1101 | $1,500 | $1.36 | 43d | 1 | 1.18mi |
| 1780 Falls St Niagara Falls, NY | 2.0 | 1.0 | 1100 | $1,200 | $1.09 | 43d | 1 | 1.22mi |
Listing history 5 events
-
2026-03-19status Pending
-
2026-02-13price $50,000
-
2025-12-02price $60,000
-
2025-10-07$80,000 Active
-
2007-04-03soldstatus $23,000
ⓘ Source: listings_history table (triggers on properties + properties_extension) + one-shot
backfill from property_details.listing_events for pre-trigger history.
Tax reassessment forecast NY · Partial reset (capped growth)
- Current annual tax
- $1,624 · $135/mo
- Projected year-2 tax
- $1,624 · $135/mo
- Expected delta
- $0/yr ($0/mo · 0.0%)
ⓘ Screening estimate from a state-policy table — verify with the county assessor before closing.
Climate risk First Street
- Flood 1/10 Low FEMA zone X (unshaded) · 0% chance over 30 yrs
- Wildfire 1/10 Low
- Heat 2/10 Low 7 d/yr ≥94°F today · 15 d/yr by 30 yrs out
- Wind 1/10 Low
- Air quality 3/10 Moderate 2 unhealthy d/yr today · 3 by 30 yrs out
Nearby sold comps map
Loading sold comps map…
Walkable amenities ~0.75 mi
Loading nearby amenities…
Taxation est. · year 1
- Rental income
- $31,560
- − Mortgage interest
- −$2,801
- − Property taxes
- −$1,624
- − Insurance
- −$250
- − Repairs & maintenance
- −$2,525
- − Management
- −$2,525
- − Depreciation
- −$1,455
- Taxable income
- $20,381
- Est. tax owed @ 24.0%
- −$4,892
- After-tax cash flow
- $15,021/yr
For passive investors: Depreciation is non-cash, so a rental often shows a tax loss while cash-flowing — sheltering income. Rental losses are passive: they offset passive income freely, and up to $25,000/yr can offset ordinary (W-2) income if you actively participate and your MAGI is under $100k (phasing out to $0 by $150k); unused losses carry forward. On sale, claimed depreciation is recaptured at up to 25%, and gains may owe capital-gains tax (a 1031 exchange can defer both). Figures are a year-1 estimate at your 24.0% rate — not tax advice; consult a CPA.
Schools (NCES district)
- District
- Niagara Falls City School District
- NCES district ID
- 3620820
- Math proficiency
- 26% ▼ -10.00%
- Reading proficiency
- 34% ▲ 3.00%
- Median HH income
- $32,488
- Composite
- 24.5/100
- National rank
- #7655
- State rank
- #578 of 590 in NY
Livability — Niagara Falls
- Score
- 60/100
- State rank
- #956
- US rank
- #18749
Category grades
Schools grade is shown separately in the Schools card above.
Census & demographics
- Census place
- Niagara Falls, NY
- County
- Niagara County · 157,377 people
- City population
- 62,983
- Metro
- Buffalo-Cheektowaga, NY
- Population (ZIP)
- 16,696
- Household income
- $51,004
- Rent vs Own
- Severe rent burden
- 1095.0
Population outlook (Niagara County) Hauer SSP2
- Today (2025)
- 204,149 people
- By 2030
- 197,900 · -3.1%
- By 2040
- 182,239 · -10.7%
- By 2050
- 165,198 · -19.1%
- By 2075
- 129,416 · -36.6%
- By 2100
- 96,222 · -52.9%
Race, ethnicity, and origin ACS 2023
- Neighborhood character
- Diverse neighborhood (Simpson 0.63)
- Race & ethnicity
- White 55% Black 24% Two or more races 13% Hispanic / Latino 8% Asian 1% Native American 1%
- Hispanic origin (detail)
- Puerto Rican 4%
- Common ancestry
- Romanian 6% Slovak 2% Lithuanian 2%
- Foreign-born
- 6% · Canada, Jamaica
- Languages at home
- 93% English-only · Spanish 4% Other Indo-European 1%
Political lean MEDSL · Niagara
- 2024 margin
- R (+14.9) · D 42.5% · R 57.5%
- 2008→2024 swing
- -15.9pp toward R · 2008: 1.0pp · 2024: -14.9pp
- All cycles
- 2024: R+14.9 2020: R+9.7 2016: R+19.0 2012: D+0.6 2008: D+1.0
Not yet ingested
- Civics
- —
Market trends
- HPI YoY
- ▼ -43.08%
- Current HPI
- 350.8741
- Rent YoY
- —
- Metro
- Buffalo-Cheektowaga, NY
- State GDP YoY
- ▲ 2.60%
- F500 in state
- 92
Industry mix (Fortune 500 HQ in NY)
| Industry | F500 HQs | Revenue |
|---|---|---|
| Financial Services | 10 | $950B |
|
||
| Consumer Goods | 9 | $162B |
|
||
| Insurance | 4 | $225B |
|
||
| Telecommunications | 2 | $144B |
|
||
| Pharmaceuticals | 2 | $112B |
|
||
| Media / Entertainment | 2 | $69B |
|
||
Price history
+117.4% since first listed5 events — show timeline
- 2026-03-19 Pending — WNYREIS
- 2026-02-13 Price Changed $50,000 WNYREIS
- 2025-12-02 Price Changed $60,000 WNYREIS
- 2025-10-07 Listed $80,000 WNYREIS
- 2007-04-03 Sold (Public Records) $23,000 Public Records
Property tax history
+2.3%/yrLatest (2025): $1,624 · -32.1% YoY. Source: county tax records.
Cash-flow waterfall
monthlySold comps — $/sqft
last 12 mo · ≤1 miLoading sold comps…