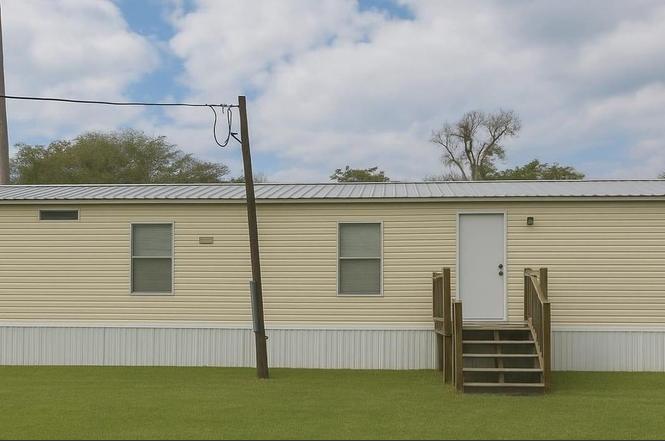
2122 CR 426 · Lake Panasoffkee, FL
Flood risk 1/10 · Minimal
- FEMA flood zone
- X (unshaded)
- Chance of flooding over 30 yrs
- 0.0%
- Est. flood insurance / yr
- $507 – $1,088
Fire risk 2/10 · Minimal
- Est. fire insurance / yr
- $947 – $1,759
Heat risk 8/10 · Major
- Hot days now (above 108°F)
- 7 days/yr
- Hot days in 30 yrs
- 23 days/yr
Wind risk 9/10 · Severe
- Chance of severe wind over 30 yrs
- 99.0%
Air-quality risk 3/10 · Minor
- Unhealthy air days now
- 2 days/yr
- Unhealthy air days in 30 yrs
- 3 days/yr
Risk factors via First Street. Map © Google.
Why this score? — see what drove the C+ grade
The composite is a weighted blend of 9 inputs, each scored 0–100. Each bar is that input's sub-score; the figure is the points it added to the 100-point composite (weight × sub-score).
- Cash flow +21.1/30.0
- ARV discount +7.5/15.0
- Appreciation +7.5/10.0
- DSCR +6.7/10.0
- Schools +5.2/10.0
- 1% rule +4.5/10.0
- Livability +3.6/5.0
- Rent growth +2.5/5.0
- Condition / age +2.5/5.0
$129,500
🖨 Deal sheet (PDF) 📄 Offer letter ✓ Due diligence
Listing remarks
Property eligible for USDA Loan (for qualified buyers) buy with low to no down payment, plus Seller's offering $5,000 toward buyer's closing costs, making this home very affordable with minimal cash needed. Unique Opportunity! The two adjacent vacant lots are also for sale separately. Buyers have the option to purchase all three properties creating a larger parcel with additional space and investment potential. Discover this cozy and immaculately maintained home, perfectly situated just minutes from The Villages and a short drive to Ocala and Orlando’s world-famous theme parks. Featuring a durable metal roof, updated flooring, and a renovated bathroom, this 2-bedroom, 1-bath gem offer
Key facts
- Metal roof
- Renovated bathroom
- City water
Tags
Property features AI
Finance
- Other: Unfurnished; No lease restrictions; Universal property ID available
- HOA & community: No association
Exterior
- Parking: Open parking
- Security: Smoke detector(s)
- Utilities: Public water; Septic tank; Electricity connected; Water connected; Private utilities
- Home design: Manufactured home (single wide); One story; Faces west; Completed condition; Entry on one level
- Construction: Vinyl siding; Metal roof; Crawlspace foundation; Built on a 0 to less than 1/4 acre lot (approximately 0.16 acres, 60x114)
- Exterior features: Cleared lot; Paved lot; Asphalt and paved road access
Interior
- Kitchen: Range; Range hood; Refrigerator; Exhaust fan
- Bedrooms: 2 bedrooms
- Flooring: Linoleum; Vinyl
- Bathrooms: 1 full bathroom
- Heating & cooling: Central heating; Central air
- Interior features: Thermostat; Blinds; Smoke detector(s)
- Laundry & utility: Inside laundry
Neighborhood map
What this means for you Summary
Snapshot
- This is a 2-bed/1.0-bath manufactured listed at $130k.
Deal economics
- At list price, monthly cash flow is $185 ($2k/yr) — positive.
- The deal already cash-flows at list — no discount required.
- To meet the 1% rule (rent ≥ 1% of price), the offer needs to be $122k (5.4% below list).
- Recommended offer: $114k (12.0% below list) — sets the bar for market timing.
- Cap rate 8.0% vs local median 5.1% in Lake Panasoffkee — top-decile yield for the area; either an underpriced asset or a hidden risk that comps aren't pricing in. Stress-test before assuming the spread holds.
Location & tenants
- Location reads 72/100 on livability (#332 in FL) — a middle-class / working-renter tenant base. Strengths: cost of living A+, housing A+, health & safety A+; Watch: amenities F, commute F, employment D-.
- Sumter (rural): math 61% / reading 61% proficiency, ranked #11 of 73 in FL (top 15%) — acceptable for families but not a draw, mixed tenant base, ~2y average lease.
- Market conditions: 86 active listings in the ZIP; 1 comparable units currently listed for rent nearby; 3,961 units permitted in Sumter County in 2024 (248 in 5+ unit buildings).
Forward outlook
- In year one you build about $7k of equity ($895 loan paydown + $6k appreciation (5.0% local appreciation)).
- Sumter County population projected at +45% by 2050 — long-run rental-demand tailwind backs the buy-and-hold thesis.
- At projected returns (5.0% appreciation + 3.0% rent growth), your $36k cash investment doubles in ~4 years — after that, you're playing with house money.
- By year 5, paydown + projected appreciation supports a ~$32k cash-out refi (75% LTV) — recoverable capital for the next deal without selling this one.
Negotiation context
- It's been on market 133 days — a 12% lower offer ($114k) is reasonable based on typical stale-listing flexibility.
- 5 sale attempts since 2y ago with the ask held roughly flat each time — persistent listings suggest the price (not the market) is what's stuck; bring a comps-based counter.
- Current owner paid $11k; list at $130k implies a 1077% gain — meaningful room to come down on a strong offer.
Risks & watch-outs
- Climate carrying-cost: severe wind risk, 99% chance of damaging wind over 30y; extreme-heat days projected 7→23/yr by 2055 (HVAC capex compounding) — expect insurance premiums to compound above CPI over the hold.
Questions for the listing agent
- It's been on market 133 days. Have you received any prior offers? Is the seller open to a 12% concession, seller financing, or rate buy-down credit?
- Why hasn't it sold? Are there any deal-killer items the seller is aware of (foundation, flood, title, zoning, code violations)?
- Is there a deadline driving the sale (1031 exchange, divorce, estate, relocation)? That informs how much negotiation room exists.
- What's the average days-on-market for RENTAL listings here right now (not sales)? A rising rental-DOM trend means longer vacancies and softer asking-rent achievability than the comps imply.
- What's the recent tenant-quality profile in this submarket — average credit score on applications, eviction rate, late-payment / NSF rate, and stable-employment percentage? A property-management company in the area should have these aggregated.
- How much new for-sale + rental construction is in the pipeline within 1–3 miles? Heavy new supply typically softens prices + rents 12–24 months out; constrained supply supports both.
Investment metrics
- 1% rule
- 0.95% ✗
- Cap rate
- 8.00%
- Cash-on-cash
- 6.11%
- DSCR
- 1.27
- GRM
- 8.8
CMA / ARV
- ARV (on-the-fly)
- $64,792
- Comps found
- 5
Show comp detail 5 sales within ~0.75 mi
| Address | Dist | Beds/Ba | Sqft | Sold | Price | $/sf | Match |
|---|---|---|---|---|---|---|---|
| 2574 CR 423 | 0.20mi | 2/1.0 | 784 (+8%) | 9mo | $80,000 | $102 | 71 |
| 3051 CR 430a | 0.39mi | 2/2.0 | 780 (+7%) | 2mo | $25,000 | $32 | 64 |
| 1611 Cr 434 | 0.54mi | 2/1.0 | 768 (+6%) | 9mo | $65,000 | $85 | 58 |
| 1575 CR 434 | 0.58mi | 2/1.5 | 672 (-8%) | 0mo | $82,000 | $122 | 58 |
| 1637 CR 434 | 0.51mi | 2/1.0 | 816 (+12%) | 2mo | $73,000 | $89 | 54 |
Match score weights: distance 35% · size 25% · config 20% · recency 20%. Top-matched comps best support the ARV.
Projected returns pro-forma
4.99% appreciation · 3.0% rent growth · sell at horizon
- IRR
- 18.1%
- Equity multiple
- 2.14×
- Total profit
- $41,459
- Equity at exit
- $73,287
- IRR
- 18.1%
- Equity multiple
- 4.18×
- Total profit
- $115,144
- Equity at exit
- $126,401
Cash invested: $36,260 (down + closing). Projections, not guarantees.
Landlord ↔ Tenant lean methodology
- Overall (STATE)
- 87 Strongly Landlord-Friendly
- State Florida
- 87 Strongly Landlord-Friendly · R+3
- County
- — inherits STATE
- City
- — inherits STATE
ZIP-level market 33538
- Home prices YoY
- 1.5%
- Active inventory
- 86
- Price-to-rent
- 8.8×
Monthly cashflow live
- Estimated rent
- $1,225 medium interval (Pro) →
- Mortgage (P&I)
- −$679
- Tax from tax record
- −$50 /mo · $601/yr
- Insurance
- −$54
- HOA
- −$0
- Vacancy / Maint / Mgmt
- −$257
- Net cashflow
- $185
Break-even live
Sensitivity live
| Price | -10% $258 | -5% $221 | +0% $185 | +5% $148 | +10% $111 |
|---|---|---|---|---|---|
| Rent | -10% $88 | -5% $136 | +0% $185 | +5% $233 | +10% $281 |
| Rate | -1.0pp $250 | -0.5pp $217 | base $185 | +0.5pp $151 | +1.0pp $117 |
UW: 25.0% down · 7.5% · 30yr · 1.5% tax · 5.0% vac · 8.0% maint · 8.0% mgmt
Financing live
Cash to close
- Down payment
- $32,375
- Closing costs
- $3,885
- Reserves months
- —
- Total cash needed
- —
Loan-product check · same deal, 3 products live
Conventional
25% down · 7.5% · 30yr
- Down + closing
- —
- Monthly P&I
- —
- Monthly cashflow
- —
- DSCR
- —
- Eligible?
- —
Personal DTI + credit; lowest rate.
DSCR
20% down · 8.5% · 30yr
- Down + closing
- —
- Monthly P&I
- —
- Monthly cashflow
- —
- DSCR
- —
- Eligible?
- —
No personal income docs; deal must DSCR.
Hard money
10% down · 12.0% · 12mo
- Down + closing
- —
- Monthly P&I
- —
- Monthly cashflow
- —
- DSCR
- —
- Eligible?
- —
Short-term bridge; refi at stabilization.
Rent comps 1 comps
| Address | Beds | Baths | Sqft | Rent | $/sqft | DOM | Units | Dist |
|---|---|---|---|---|---|---|---|---|
| 2248 CR 446 Lake Panasoffkee, FL | 1.0 | 1.0 | 650 | $1,225 | $1.88 | 22d | 1 | 0.70mi |
Listing history 32 events
-
2026-06-19days on market $129,500 Active 133 DOM
-
2026-06-18days on market $129,500 Active 132 DOM
-
2026-06-17days on market $129,500 Active 131 DOM
-
2026-06-16days on market $129,500 Active 130 DOM
-
2026-06-15days on market $129,500 Active 129 DOM
-
2026-06-14days on market $129,500 Active 127 DOM
-
2026-06-13days on market $129,500 Active 126 DOM
-
2026-06-10days on market $129,500 Active 124 DOM
-
2026-06-09days on market $129,500 Active 123 DOM
-
2026-06-08days on market $129,500 Active 122 DOM
-
2026-06-07days on market $129,500 Active 121 DOM
-
2026-06-02days on market $129,500 Active 116 DOM
-
2026-06-01days on market $129,500 Active 115 DOM
-
2026-05-31days on market $129,500 Active 114 DOM
-
2026-05-30days on market $129,500 Active 113 DOM
-
2026-04-21price $129,500
-
2026-02-06$129,900 Active
-
2025-12-31historical
-
2025-09-23$119,000 Active
-
2025-02-05historical
-
2024-11-11status Active
-
2024-10-31historical
-
2024-10-03status Active
-
2024-10-03price $123,900
-
2024-09-30historical
-
2024-09-18price $129,900
-
2024-06-24price $145,000
-
2024-04-24price $149,900
-
2024-02-16$154,900 Active
-
2007-03-15soldstatus $11,000
-
2003-03-03soldstatus $34,400
-
1976-08-01soldstatus $6,500
ⓘ Source: listings_history table (triggers on properties + properties_extension) + one-shot
backfill from property_details.listing_events for pre-trigger history.
Tax reassessment forecast FL · Resets to sale price
- Current annual tax
- $601 · $50/mo
- Projected year-2 tax
- $1,075 · $90/mo
- Expected delta
- +$473/yr (+$39/mo · 78.7%)
ⓘ Screening estimate from a state-policy table — verify with the county assessor before closing.
Climate risk First Street
- Flood 1/10 Low FEMA zone X (unshaded) · 0% chance over 30 yrs
- Wildfire 2/10 Low
- Heat 8/10 Severe 7 d/yr ≥108°F today · 23 d/yr by 30 yrs out
- Wind 9/10 Extreme 99% chance of damaging wind over 30 yrs
- Air quality 3/10 Moderate 2 unhealthy d/yr today · 3 by 30 yrs out
Nearby sold comps map
Loading sold comps map…
Walkable amenities ~0.75 mi
Loading nearby amenities…
Taxation est. · year 1
- Rental income
- $14,700
- − Mortgage interest
- −$7,254
- − Property taxes
- −$601
- − Insurance
- −$648
- − Repairs & maintenance
- −$1,176
- − Management
- −$1,176
- − Depreciation
- −$3,767
- Taxable income
- $78
- Est. tax owed @ 24.0%
- −$19
- After-tax cash flow
- $2,196/yr
For passive investors: Depreciation is non-cash, so a rental often shows a tax loss while cash-flowing — sheltering income. Rental losses are passive: they offset passive income freely, and up to $25,000/yr can offset ordinary (W-2) income if you actively participate and your MAGI is under $100k (phasing out to $0 by $150k); unused losses carry forward. On sale, claimed depreciation is recaptured at up to 25%, and gains may owe capital-gains tax (a 1031 exchange can defer both). Figures are a year-1 estimate at your 24.0% rate — not tax advice; consult a CPA.
Schools (NCES district)
- District
- Sumter
- NCES district ID
- 1201800
- Math proficiency
- 61% ▼ -4.00%
- Reading proficiency
- 61% ▼ -2.00%
- Median HH income
- $48,240
- Composite
- 51.74/100
- National rank
- #1682
- State rank
- #11 of 73 in FL
Livability — Lake Panasoffkee
- Score
- 72/100
- State rank
- #332
- US rank
- #5777
Category grades
Schools grade is shown separately in the Schools card above.
Census & demographics
- Census place
- Lake Panasoffkee, FL
- Population (ZIP)
- 5,748
Population outlook (Sumter County) Hauer SSP2
- Today (2025)
- 161,172 people
- By 2030
- 180,083 · +11.7%
- By 2040
- 209,892 · +30.2%
- By 2050
- 234,186 · +45.3%
- By 2075
- 284,602 · +76.6%
- By 2100
- 317,039 · +96.7%
Race, ethnicity, and origin ACS 2023
- Neighborhood character
- Predominantly White (87%)
- Race & ethnicity
- White 87% Black 7% Hispanic / Latino 3% Two or more races 3%
- Common ancestry
- Lithuanian 2% Slovak 1% Italian 1%
- Foreign-born
- 1% · Canada
Political lean MEDSL · Sumter
- 2024 margin
- Solid R (+37.6) · D 30.9% · R 68.6%
- 2008→2024 swing
- -10.6pp toward R · 2008: -27.0pp · 2024: -37.6pp
- All cycles
- 2024: R+37.6 2020: R+36.1 2016: R+39.2 2012: R+34.9 2008: R+27.0
Not yet ingested
- Civics
- —
Market trends
- HPI YoY
- ▲ 4.99%
- Current HPI
- 329.8431
- Rent YoY
- —
- Metro
- —
- State GDP YoY
- ▲ 3.28%
- F500 in state
- 36
Industry mix (Fortune 500 HQ in FL)
| Industry | F500 HQs | Revenue |
|---|---|---|
| Industrial Technology | 2 | $29B |
|
||
| Insurance | 2 | $17B |
|
||
| Retail | 1 | $60B |
|
||
| Technology Distribution | 1 | $58B |
|
||
| Homebuilding | 1 | $35B |
|
||
| Technology Manufacturing | 1 | $35B |
|
||
Price history
+1892.3% since first listed17 events — show timeline
- 2026-04-21 Price Changed $129,500 Stellar MLS as Distributed by MLS Grid
- 2026-02-06 Listed $129,900 Stellar MLS as Distributed by MLS Grid
- 2025-12-31 Listing Removed — Stellar MLS as Distributed by MLS Grid
- 2025-09-23 Listed $119,000 Stellar MLS as Distributed by MLS Grid
- 2025-02-05 Listing Removed — Stellar MLS as Distributed by MLS Grid
- 2024-11-11 Relisted — Stellar MLS as Distributed by MLS Grid
- 2024-10-31 Listing Removed — Stellar MLS as Distributed by MLS Grid
- 2024-10-03 Relisted — Stellar MLS as Distributed by MLS Grid
- 2024-10-03 Price Changed $123,900 Stellar MLS as Distributed by MLS Grid
- 2024-09-30 Listing Removed — Stellar MLS as Distributed by MLS Grid
- 2024-09-18 Price Changed $129,900 Stellar MLS as Distributed by MLS Grid
- 2024-06-24 Price Changed $145,000 Stellar MLS as Distributed by MLS Grid
- 2024-04-24 Price Changed $149,900 Stellar MLS as Distributed by MLS Grid
- 2024-02-16 Listed $154,900 Stellar MLS as Distributed by MLS Grid
- 2007-03-15 Sold (Public Records) $11,000 Public Records
- 2003-03-03 Sold (Public Records) $34,400 Public Records
- 1976-08-01 Sold (Public Records) $6,500 Public Records
Property tax history
+5.7%/yrLatest (2025): $601 · +3.5% YoY. Source: county tax records.
Cash-flow waterfall
monthlySold comps — $/sqft
last 12 mo · ≤1 miLoading sold comps…