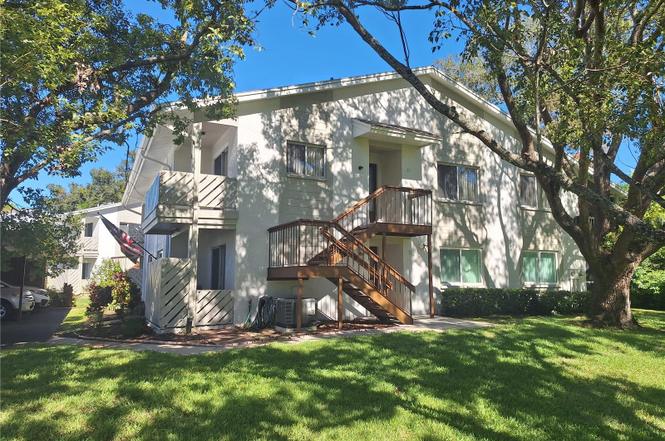
12400 Eagleswood Dr Unit D · Bayonet Point, FL
Flood risk 1/10 · Minimal
- FEMA flood zone
- X (unshaded)
- Chance of flooding over 30 yrs
- 0.0%
- Est. flood insurance / yr
- $507 – $1,088
Fire risk 3/10 · Minor
- Est. fire insurance / yr
- $947 – $1,759
Heat risk 10/10 · Severe
- Hot days now (above 108°F)
- 7 days/yr
- Hot days in 30 yrs
- 25 days/yr
Wind risk 10/10 · Severe
- Chance of severe wind over 30 yrs
- 99.0%
Air-quality risk 2/10 · Minimal
- Unhealthy air days now
- 1 days/yr
- Unhealthy air days in 30 yrs
- 3 days/yr
Risk factors via First Street. Map © Google.
Why this score? — see what drove the B- grade
The composite is a weighted blend of 9 inputs, each scored 0–100. Each bar is that input's sub-score; the figure is the points it added to the 100-point composite (weight × sub-score).
- Cash flow +27.7/30.0
- 1% rule +10.0/10.0
- DSCR +9.7/10.0
- ARV discount +7.5/15.0
- Schools +4.3/10.0
- Livability +3.5/5.0
- Condition / age +2.5/5.0
- Rent growth +1.9/5.0
- Appreciation +0.0/10.0
$94,900
🖨 Deal sheet (PDF) 📄 Offer letter ✓ Due diligence
Listing remarks
Beautiful End Unit in Highly Rated Condominium Community! Welcome to this spacious 2-bedroom, 2-bath end-unit condo perfectly situated in one of Pasco County’s most sought-after active communities. Enjoy privacy and serene views from this ideally located home, just one block from the picturesque Beacon Woods Golf Course, in the heart of the Beacon Woods villages. Inside, you’ll find a split floor plan featuring separate living, dining, and family rooms—perfect for entertaining or relaxing in comfort. The large kitchen offers ample storage and counter space, and the convenient inside laundry adds to the easy living this home provides. Additional perks include a covered ca
Key facts
- End unit
- Covered carport
- Split floor plan
Tags
Neighborhood map
What this means for you Summary
Snapshot
- This is a 2-bed/2.0-bath condo listed at $95k.
Deal economics
- At list price, monthly cash flow is $286 ($3k/yr) — positive.
- The deal already cash-flows at list — no discount required.
- Meets the 1% rule at list price ($2k rent vs $95k).
- Recommended offer: $84k (12.0% below list) — sets the bar for market timing.
- Cap rate 9.9% vs local median 5.3% in Bayonet Point — top-decile yield for the area; either an underpriced asset or a hidden risk that comps aren't pricing in. Stress-test before assuming the spread holds.
Location & tenants
- Location reads 69/100 on livability (#485 in FL) — a middle-class / working-renter tenant base. Strengths: cost of living A+, housing A+, health & safety A+; Watch: crime D+, amenities D+, commute F.
- Pasco (suburban): math 50% / reading 52% proficiency, ranked #32 of 73 in FL (top 44%) — acceptable for families but not a draw, mixed tenant base, ~2y average lease.
- Zoned schools: Hudson Primary Academy (math 29% / reading 31%, grade F, #1,882 of 2,144 statewide, top 88%, 647 students, 90% FRL); Hudson Academy (math 35% / reading 30%, grade F, #443 of 571 statewide, top 78%, 964 students, 80% FRL); Fivay High School (math 20% / reading 28%, grade F, #529 of 667 statewide, top 80%, 1,610 students, 78% FRL) — zoned schools average 82% FRL vs 48% district-wide (34 pts higher); higher-poverty schools than district average — tighter screening recommended.
- Zoned-school proficiency averages 29% at this address vs 51% district-wide (-22 pts) — the specific schools serving this property underperform the Pasco average; the district grade overstates school quality for this exact location.
- Market conditions: Rents soft (-2.3%/yr); 800 active listings in the ZIP; 39 comparable units currently listed for rent nearby; rentals at typical pace (median 23d on market — plan ~3-4 weeks tenant-placement turnaround); 6,765 units permitted in Pasco County in 2024 (1,250 in 5+ unit buildings).
Forward outlook
- Local home prices are declining (-3.0%/yr); year-one equity from $656 of loan paydown is wiped out by about $3k of value loss. Plan a longer hold.
- Pasco County population projected at +29% by 2050 — long-run rental-demand tailwind backs the buy-and-hold thesis.
Negotiation context
- It's been on market 130 days — a 12% lower offer ($84k) is reasonable based on typical stale-listing flexibility.
- 3 sale attempts; this cycle's ask has dropped $30k (24%) from the opening price — seller is motivated, your offer sets the floor, not the list.
- Current owner paid $70k; 36% above their basis — modest negotiation headroom, anchor on the comps not their cost.
Risks & watch-outs
- Watch-outs: HOA is 27% of rent.
- Climate carrying-cost: severe wind risk, 99% chance of damaging wind over 30y; extreme-heat days projected 7→25/yr by 2055 (HVAC capex compounding) — expect insurance premiums to compound above CPI over the hold.
Questions for the listing agent
- It's been on market 130 days. Have you received any prior offers? Is the seller open to a 12% concession, seller financing, or rate buy-down credit?
- What does the HOA fee cover, when was the last increase, and are there any pending special assessments or reserve-fund shortfalls?
- Any open or pending special assessments — roof, HVAC, plumbing, elevator, façade? What's the per-unit balance and payoff schedule, and is the seller paying it off at close or rolling it to the buyer?
- Why hasn't it sold? Are there any deal-killer items the seller is aware of (foundation, flood, title, zoning, code violations)?
- Is there a deadline driving the sale (1031 exchange, divorce, estate, relocation)? That informs how much negotiation room exists.
- Schools are F-rated, which usually means shorter tenancies and higher turnover. Who's the typical renter profile here, and what's been the actual vacancy rate?
- Crime grade is D in this area — have there been break-ins, vandalism, or insurance claims at this property in the last 3 years? What carrier currently insures it and at what premium?
- What's the average days-on-market for RENTAL listings here right now (not sales)? A rising rental-DOM trend means longer vacancies and softer asking-rent achievability than the comps imply.
- What's the recent tenant-quality profile in this submarket — average credit score on applications, eviction rate, late-payment / NSF rate, and stable-employment percentage? A property-management company in the area should have these aggregated.
- How much new apartment / multifamily construction is in the pipeline within 1–3 miles? Heavy new supply (>2% of stock underway) typically softens rents 12–24 months out; light construction supports rent growth.
Investment metrics
- 1% rule
- 1.78% ✓
- Cap rate
- 9.90%
- Cash-on-cash
- 12.90%
- DSCR
- 1.57
- GRM
- 4.7
CMA / ARV
No comps found within radius.
Projected returns pro-forma
-3.0% appreciation · 0.0% rent growth · sell at horizon
- IRR
- -2.0%
- Equity multiple
- 0.93×
- Total profit
- $-1,877
- Equity at exit
- $14,150
- IRR
- 2.4%
- Equity multiple
- 1.14×
- Total profit
- $3,710
- Equity at exit
- $8,205
Cash invested: $26,572 (down + closing). Projections, not guarantees.
Landlord ↔ Tenant lean methodology
- Overall (STATE)
- 87 Strongly Landlord-Friendly
- State Florida
- 87 Strongly Landlord-Friendly · R+3
- County
- — inherits STATE
- City
- — inherits STATE
ZIP-level market 34667
- Rents YoY
- -2.3%
- Active inventory
- 800
- Price-to-rent
- 4.7×
Monthly cashflow live
- Estimated rent
- $1,693 high interval (Pro) →
- Mortgage (P&I)
- −$498
- Tax from tax record
- −$50 /mo · $595/yr
- Insurance
- −$40
- HOA
- −$465
- Vacancy / Maint / Mgmt
- −$356
- Net cashflow
- $286
Break-even live
Sensitivity live
| Price | -10% $339 | -5% $313 | +0% $286 | +5% $259 | +10% $232 |
|---|---|---|---|---|---|
| Rent | -10% $152 | -5% $219 | +0% $286 | +5% $353 | +10% $419 |
| Rate | -1.0pp $333 | -0.5pp $310 | base $286 | +0.5pp $261 | +1.0pp $236 |
UW: 25.0% down · 7.5% · 30yr · 1.5% tax · 5.0% vac · 8.0% maint · 8.0% mgmt
Financing live
Cash to close
- Down payment
- $23,725
- Closing costs
- $2,847
- Reserves months
- —
- Total cash needed
- —
Loan-product check · same deal, 3 products live
Conventional
25% down · 7.5% · 30yr
- Down + closing
- —
- Monthly P&I
- —
- Monthly cashflow
- —
- DSCR
- —
- Eligible?
- —
Personal DTI + credit; lowest rate.
DSCR
20% down · 8.5% · 30yr
- Down + closing
- —
- Monthly P&I
- —
- Monthly cashflow
- —
- DSCR
- —
- Eligible?
- —
No personal income docs; deal must DSCR.
Hard money
10% down · 12.0% · 12mo
- Down + closing
- —
- Monthly P&I
- —
- Monthly cashflow
- —
- DSCR
- —
- Eligible?
- —
Short-term bridge; refi at stabilization.
Rent comps 39 comps
| Address | Beds | Baths | Sqft | Rent | $/sqft | DOM | Units | Dist |
|---|---|---|---|---|---|---|---|---|
| 8304 Mill Creek Ln Hudson, FL | 2.0 | 2.0 | 1000 | $1,650 | $1.65 | 25d | 1 | 0.23mi |
| 8312 Mill Creek Ln Hudson, FL | 2.0 | 2.0 | 1152 | $1,600 | $1.39 | 25d | 1 | 0.28mi |
| 8312 Mill Creek Ln Hudson, FL | 2.0 | 2.0 | 1152 | $1,600 | $1.39 | 0d | 1 | 0.28mi |
| 7602 Danube Dr Unit 7602 Hudson, FL | 2.0 | 2.0 | 1125 | $1,600 | $1.42 | 25d | 1 | 0.40mi |
| 7616 Danube Dr Hudson, FL | 2.0 | 2.0 | 1125 | $1,350 | $1.20 | 25d | 1 | 0.44mi |
| 12200 Hudson Ridge Dr Port Richey, FL | 2.0–3.0 | 2.0 | 1107 | $1,468 | $1.33 | 4d | 10 | 0.44mi |
| 12041 Hoosier Ct #204 Hudson, FL | 2.0 | 2.0 | 1103 | $1,495 | $1.36 | 25d | 1 | 0.47mi |
| 12041 Hoosier Ct #204 Hudson, FL | 2.0 | 2.0 | 1103 | $1,495 | $1.36 | 19d | 1 | 0.47mi |
| 12027 Hoosier Ct #203 Hudson, FL | 2.0 | 2.0 | 1103 | $1,550 | $1.41 | 25d | 1 | 0.51mi |
| 7924 Halsey Dr Port Richey, FL | 3.0 | 2.0 | 1272 | $1,800 | $1.42 | 6d | 1 | 0.61mi |
| 7924 Halsey Dr Port Richey, FL | 3.0 | 2.0 | 1272 | $1,800 | $1.42 | 23d | 1 | 0.61mi |
| 8305 Sandwedge Cir Unit A Hudson, FL | 2.0 | 2.0 | 1144 | $1,450 | $1.27 | 23d | 1 | 0.65mi |
| 7433 Greystone Dr #7433 Hudson, FL | 2.0 | 2.0 | 1029 | $1,300 | $1.26 | 19d | 1 | 0.69mi |
| 11630 Paige Dr Port Richey, FL | 3.0 | 1.0 | 1152 | $1,680 | $1.46 | 14d | 1 | 0.72mi |
| 11611 Constance Dr Port Richey, FL | 3.0 | 1.0 | 984 | $1,540 | $1.57 | 25d | 1 | 0.78mi |
| 11611 Constance Dr Port Richey, FL | 3.0 | 1.0 | 984 | $1,540 | $1.57 | 13d | 1 | 0.78mi |
| 11610 Meadow Dr Port Richey, FL | 2.0 | 2.0 | 1128 | $1,570 | $1.39 | 14d | 1 | 0.79mi |
| 12809 College Hill Dr Hudson, FL | 3.0 | 2.0 | 1114 | $1,780 | $1.60 | 6d | 1 | 0.79mi |
| 12221 Holbrook Dr Bayonet Point, FL | 1.0–2.0 | 1.0–2.0 | 761 | $1,685 | $2.21 | 0d | 55 | 0.79mi |
| 12702 Social Dr Hudson, FL | 2.0 | 1.0 | 1032 | $1,500 | $1.45 | 6d | 1 | 0.82mi |
| 11635 Salmon Dr Port Richey, FL | 2.0 | 1.5 | 816 | $1,500 | $1.84 | 25d | 1 | 0.84mi |
| 7715 Sue Ellen Dr Port Richey, FL | 2.0 | 2.0 | 1080 | $1,495 | $1.38 | 5d | 1 | 0.89mi |
| 7539 Gulf Highlands Dr Port Richey, FL | 2.0 | 1.5 | 936 | $1,550 | $1.66 | 6d | 1 | 0.91mi |
| 7804 Topay Ln Port Richey, FL | 3.0 | 2.0 | 1125 | $1,795 | $1.60 | 0d | 1 | 0.93mi |
| 13102 Pembrook Ct Hudson, FL | 2.0 | 2.0 | 1221 | $1,575 | $1.29 | 25d | 1 | 0.94mi |
| 7300 Country Club Dr Hudson, FL | 2.0 | 1.0 | 926 | $1,400 | $1.51 | 4d | 1 | 0.94mi |
| 7608 Sue Ellen Dr Port Richey, FL | 3.0 | 2.0 | 1310 | $2,400 | $1.83 | 25d | 1 | 0.97mi |
| 8161 Braddock Cir #1 Port Richey, FL | 2.0 | 2.0 | 1000 | $1,595 | $1.59 | 19d | 1 | 1.02mi |
| 7530 Judith Cres Port Richey, FL | 2.0 | 2.0 | 1446 | $2,200 | $1.52 | 25d | 1 | 1.07mi |
| 7530 Judith Cres Port Richey, FL | 2.0 | 2.0 | 1446 | $1,695 | $1.17 | 22d | 1 | 1.07mi |
| 11241 Yewtree Ave Port Richey, FL | 3.0 | 2.0 | 1306 | $1,950 | $1.49 | 25d | 1 | 1.15mi |
| 7520 Hawthorn Dr Unit NA Port Richey, FL | 2.0 | 2.0 | 1303 | $1,900 | $1.46 | 25d | 1 | 1.15mi |
| 7520 Hawthorn Dr Port Richey, FL | 2.0 | 2.0 | 1303 | $1,800 | $1.38 | 25d | 1 | 1.15mi |
| 7531 Greybirch Ter Port Richey, FL | 3.0 | 2.0 | 1400 | $2,000 | $1.43 | 25d | 1 | 1.16mi |
| 11138 Yellowwood Ln Unit NA Port Richey, FL | 3.0 | 1.0 | 1000 | $1,800 | $1.80 | 25d | 1 | 1.20mi |
| 7724 Tyson Dr Port Richey, FL | 2.0 | 2.0 | 1200 | $1,550 | $1.29 | 0d | 1 | 1.30mi |
| 7540 Venice Dr Port Richey, FL | 3.0 | 2.0 | 1394 | $1,775 | $1.27 | 6d | 1 | 1.31mi |
| 7705 Ilex Dr Port Richey, FL | 3.0 | 2.0 | 1349 | $2,000 | $1.48 | 25d | 1 | 1.33mi |
| 7213 Seward Dr Port Richey, FL | 2.0 | 1.0 | 700 | $1,500 | $2.14 | 25d | 1 | 1.50mi |
HOA detail condo
- Monthly dues
- $465 · $5,580/yr
- Assessments
- None detected in remarks — confirm with the listing agent.
Listing history 11 events
-
2026-04-22status Pending
-
2026-03-26status Active
-
2026-03-12status Pending
-
2026-03-11price $94,900
-
2026-02-11status Active
-
2026-02-03status Pending
-
2026-01-26price $99,900
-
2026-01-05price $105,000
-
2025-12-05price $110,000
-
2025-11-21$125,000 Active
-
2003-08-08soldstatus $69,900
ⓘ Source: listings_history table (triggers on properties + properties_extension) + one-shot
backfill from property_details.listing_events for pre-trigger history.
Tax reassessment forecast FL · Resets to sale price
- Current annual tax
- $595 · $50/mo
- Projected year-2 tax
- $788 · $66/mo
- Expected delta
- +$193/yr (+$16/mo · 32.4%)
ⓘ Screening estimate from a state-policy table — verify with the county assessor before closing.
Climate risk First Street
- Flood 1/10 Low FEMA zone X (unshaded) · 0% chance over 30 yrs
- Wildfire 3/10 Moderate
- Heat 10/10 Extreme 7 d/yr ≥108°F today · 25 d/yr by 30 yrs out
- Wind 10/10 Extreme 99% chance of damaging wind over 30 yrs
- Air quality 2/10 Low 1 unhealthy d/yr today · 3 by 30 yrs out
Nearby sold comps map
Loading sold comps map…
Walkable amenities ~0.75 mi
Loading nearby amenities…
Taxation est. · year 1
- Rental income
- $20,316
- − Mortgage interest
- −$5,316
- − Property taxes
- −$595
- − Insurance
- −$474
- − Repairs & maintenance
- −$1,625
- − Management
- −$1,625
- − HOA
- −$5,580
- − Depreciation
- −$2,761
- Taxable income
- $2,339
- Est. tax owed @ 24.0%
- −$561
- After-tax cash flow
- $2,866/yr
For passive investors: Depreciation is non-cash, so a rental often shows a tax loss while cash-flowing — sheltering income. Rental losses are passive: they offset passive income freely, and up to $25,000/yr can offset ordinary (W-2) income if you actively participate and your MAGI is under $100k (phasing out to $0 by $150k); unused losses carry forward. On sale, claimed depreciation is recaptured at up to 25%, and gains may owe capital-gains tax (a 1031 exchange can defer both). Figures are a year-1 estimate at your 24.0% rate — not tax advice; consult a CPA.
Schools (NCES district)
- District
- Pasco
- NCES district ID
- 1201530
- Math proficiency
- 50% ▼ -10.00%
- Reading proficiency
- 52% ▼ -5.00%
- Median HH income
- $45,039
- Composite
- 43.14/100
- National rank
- #3074
- State rank
- #32 of 73 in FL
Livability — Bayonet Point
- Score
- 69/100
- State rank
- #485
- US rank
- #8934
Category grades
Schools grade is shown separately in the Schools card above.
Census & demographics
- Census place
- Bayonet Point, FL
- County
- Pasco County · 524,098 people
- Metro
- Tampa-St. Petersburg-Clearwater, FL
- Population (ZIP)
- 30,689
- Household income
- $51,280
- Rent vs Own
- Severe rent burden
- 946.0
Population outlook (Pasco County) Hauer SSP2
- Today (2025)
- 570,045 people
- By 2030
- 605,844 · +6.3%
- By 2040
- 674,806 · +18.4%
- By 2050
- 736,022 · +29.1%
- By 2075
- 862,900 · +51.4%
- By 2100
- 906,364 · +59.0%
Race, ethnicity, and origin ACS 2023
- Neighborhood character
- Predominantly White (86%)
- Race & ethnicity
- White 86% Hispanic / Latino 7% Two or more races 6% Black 2% Asian 2%
- Hispanic origin (detail)
- Mexican 1% Puerto Rican 2%
- Common ancestry
- Romanian 4% Lithuanian 3% Slovak 2%
- Foreign-born
- 7% · Canada, Jamaica, Vietnam
- Languages at home
- 91% English-only · Spanish 5% Other Indo-European 2% French/Haitian/Cajun 0%
Political lean MEDSL · Pasco
- 2024 margin
- Strong R (+25.2) · D 36.9% · R 62.1% · Other 1.0%
- 2008→2024 swing
- -21.6pp toward R · 2008: -3.6pp · 2024: -25.2pp
- All cycles
- 2024: R+25.2 2020: R+20.1 2016: R+21.6 2012: R+6.7 2008: R+3.6
Not yet ingested
- Civics
- —
Market trends
- HPI YoY
- ▼ -183.96%
- Current HPI
- 307.5552
- Rent YoY
- ▼ -2.26%
- Metro
- Tampa-St. Petersburg-Clearwater, FL
- State GDP YoY
- ▲ 3.28%
- F500 in state
- 36
Industry mix (Fortune 500 HQ in FL)
| Industry | F500 HQs | Revenue |
|---|---|---|
| Industrial Technology | 2 | $29B |
|
||
| Insurance | 2 | $17B |
|
||
| Retail | 1 | $60B |
|
||
| Technology Distribution | 1 | $58B |
|
||
| Homebuilding | 1 | $35B |
|
||
| Technology Manufacturing | 1 | $35B |
|
||
Price history
+35.8% since first listed11 events — show timeline
- 2026-04-22 Pending — Stellar MLS as Distributed by MLS Grid
- 2026-03-26 Relisted — Stellar MLS as Distributed by MLS Grid
- 2026-03-12 Pending — Stellar MLS as Distributed by MLS Grid
- 2026-03-11 Price Changed $94,900 Stellar MLS as Distributed by MLS Grid
- 2026-02-11 Relisted — Stellar MLS as Distributed by MLS Grid
- 2026-02-03 Pending — Stellar MLS as Distributed by MLS Grid
- 2026-01-26 Price Changed $99,900 Stellar MLS as Distributed by MLS Grid
- 2026-01-05 Price Changed $105,000 Stellar MLS as Distributed by MLS Grid
- 2025-12-05 Price Changed $110,000 Stellar MLS as Distributed by MLS Grid
- 2025-11-21 Listed $125,000 Stellar MLS as Distributed by MLS Grid
- 2003-08-08 Sold (Public Records) $69,900 Public Records
Property tax history
+4.5%/yrLatest (2025): $595 · +4.5% YoY. Source: county tax records.
Cash-flow waterfall
monthlySold comps — $/sqft
last 12 mo · ≤1 miLoading sold comps…