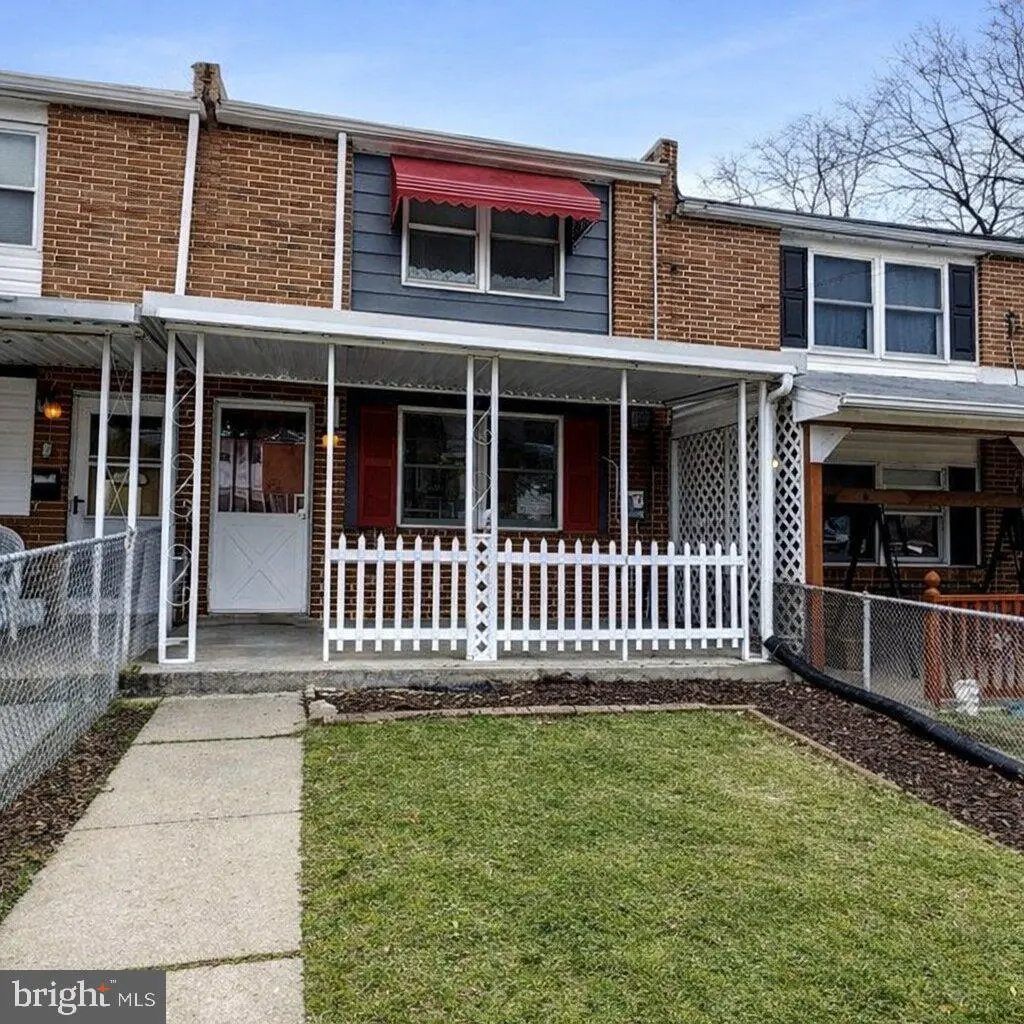
3311 Kessler Ct · Lansdowne, MD
Flood risk 1/10 · Minimal
- FEMA flood zone
- X (unshaded)
- Chance of flooding over 30 yrs
- 0.0%
- Est. flood insurance / yr
- $507 – $1,088
Fire risk 1/10 · Minimal
- Est. fire insurance / yr
- $755 – $1,403
Heat risk 7/10 · Major
- Hot days now (above 103°F)
- 7 days/yr
- Hot days in 30 yrs
- 15 days/yr
Wind risk 6/10 · Moderate
- Chance of severe wind over 30 yrs
- 27.0%
Air-quality risk 4/10 · Minor
- Unhealthy air days now
- 5 days/yr
- Unhealthy air days in 30 yrs
- 6 days/yr
Risk factors via First Street. Map © Google.
Why this score? — see what drove the C- grade
The composite is a weighted blend of 9 inputs, each scored 0–100. Each bar is that input's sub-score; the figure is the points it added to the 100-point composite (weight × sub-score).
- Cash flow +20.9/30.0
- ARV discount +9.7/15.0
- DSCR +6.7/10.0
- 1% rule +5.1/10.0
- Livability +3.3/5.0
- Rent growth +2.8/5.0
- Condition / age +2.5/5.0
- Schools +2.3/10.0
- Appreciation +0.0/10.0
$184,900
🖨 Deal sheet 📄 Offer letter ✓ Due diligence
Listing remarks MLS
Beautifully maintained and ready for you to move in and relax in the Riverview Neighborhood! Enjoy nice room sizes, carpet throughout, and a great rear patio, perfect for warm weather outdoor living. Use the shed as added storage! A convenient location, just blocks from Riverview and Sandy Hills Parks! Don't miss this one!
Key facts
- Built 1957
- Listed 18 days
Property features AI
Exterior
- Parking: On-street parking; Parking lot
- Utilities: Public water; Public sewer; Natural gas available
- Home design: Interior townhouse / rowhouse; Fee simple ownership
- Construction: Brick construction; Other foundation
- Exterior features: Rear privacy fencing; Shed
Interior
- Kitchen: Refrigerator; Icemaker
- Bedrooms: Three bedrooms on the upper level
- Bathrooms: One full bathroom
- Heating & cooling: Forced air heating; Central air conditioning; Cooling uses electric and natural gas; Hot water heated by natural gas
- Interior features: Living room; Full bathroom
- Laundry & utility: Washer; Laundry hookups on the main floor
Neighborhood map
What this means for you Summary
Snapshot
- This is a 3-bed/1.0-bath townhouse listed at $185k.
Deal economics
- At list price, monthly cash flow is $258 ($3k/yr) — positive.
- The deal already cash-flows at list — no discount required.
- Meets the 1% rule at list price ($2k rent vs $185k).
- Recommended offer: $182k (1.5% below list) — sets the bar for market timing.
- Cap rate 8.0% vs local median 4.5% in Lansdowne — top-decile yield for the area; either an underpriced asset or a hidden risk that comps aren't pricing in. Stress-test before assuming the spread holds.
Location & tenants
- Location reads 66/100 on livability (#235 in MD) — a middle-class / working-renter tenant base. Strengths: commute A+, cost of living A, housing A-; Watch: employment D, crime F, amenities F.
- Baltimore County Public Schools (suburban): math 15% / reading 34% proficiency, ranked #11 of 24 in MD (top 46%) — low school quality limits family demand, transient renter base, plan for 1-2y turnover.
- Zoned schools: Riverview Elementary (math 5% / reading 9%, grade F, #726 of 860 statewide, top 86%, 546 students, 74% FRL); Lansdowne Middle (math 2% / reading 18%, grade F, #209 of 225 statewide, top 93%, 869 students, 62% FRL); Lansdowne High (math 3% / reading 25%, grade F, #190 of 222 statewide, top 86%, 1,410 students, 60% FRL) — zoned schools average 65% FRL vs 39% district-wide (27 pts higher); higher-poverty schools than district average — tighter screening recommended.
- Zoned-school proficiency averages 10% at this address vs 24% district-wide (-14 pts) — the specific schools serving this property underperform the Baltimore County Public Schools average; the district grade overstates school quality for this exact location.
- Market conditions: Rents rising (+1.2%/yr); 99 active listings in the ZIP; 11 comparable units currently listed for rent nearby; rentals at typical pace (median 22d on market — plan ~3-4 weeks tenant-placement turnaround); solid renter incomes; 1,511 units permitted in Baltimore County in 2024 (643 in 5+ unit buildings).
Forward outlook
- Local home prices are declining (-3.0%/yr); year-one equity from $1k of loan paydown is wiped out by about $6k of value loss. Plan a longer hold.
- Baltimore County population projected at +12% by 2050 — modest demand growth; plan on rents tracking national, not racing it.
Negotiation context
- It's been on market 18 days — a 2% lower offer ($182k) is reasonable based on typical stale-listing flexibility.
- 2 sale attempts since 6y ago; this cycle's ask has dropped $20k (10%) from the opening price — seller is motivated, your offer sets the floor, not the list.
- Current owner paid $125k; 48% above their basis — modest negotiation headroom, anchor on the comps not their cost.
Risks & watch-outs
- Watch-outs: built in 1957 — expect roof / HVAC / electrical / plumbing capex.
- Climate carrying-cost: major wind risk, 27% chance of damaging wind over 30y; extreme-heat days projected 7→15/yr by 2055 (HVAC capex compounding) — expect insurance premiums to compound above CPI over the hold.
Questions for the listing agent
- Built in 1957 — when were the roof, HVAC, electrical panel, plumbing, and water heater last replaced?
- Is there a deadline driving the sale (1031 exchange, divorce, estate, relocation)? That informs how much negotiation room exists.
- Schools are F-rated, which usually means shorter tenancies and higher turnover. Who's the typical renter profile here, and what's been the actual vacancy rate?
- Crime grade is F in this area — have there been break-ins, vandalism, or insurance claims at this property in the last 3 years? What carrier currently insures it and at what premium?
- What's the average days-on-market for RENTAL listings here right now (not sales)? A rising rental-DOM trend means longer vacancies and softer asking-rent achievability than the comps imply.
- What's the recent tenant-quality profile in this submarket — average credit score on applications, eviction rate, late-payment / NSF rate, and stable-employment percentage? A property-management company in the area should have these aggregated.
- How much new for-sale + rental construction is in the pipeline within 1–3 miles? Heavy new supply typically softens prices + rents 12–24 months out; constrained supply supports both.
Investment metrics
- 1% rule
- 1.01% ✓
- Cap rate
- 7.97%
- Cash-on-cash
- 5.98%
- DSCR
- 1.27
- GRM
- 8.3
CMA / ARV
- ARV (on-the-fly)
- $194,560
- Comps found
- 12
Show comp detail 12 sales within ~0.75 mi
| Address | Dist | Beds/Ba | Sqft | Sold | Price | $/sf | Match |
|---|---|---|---|---|---|---|---|
| 430 Burbank Ct | 0.04mi | 3/1.0 | 1,024 (0%) | 6mo | $195,000 | $190 | 93 |
| 3167 Bero Rd | 0.25mi | 3/1.0 | 1,024 (0%) | 4mo | $165,000 | $161 | 85 |
| 1017 Fredonia Ct | 0.24mi | 3/1.0 | 1,024 (0%) | 8mo | $140,000 | $137 | 82 |
| 446 Bigley Ave | 0.36mi | 3/1.0 | 1,024 (0%) | 5mo | $150,000 | $146 | 80 |
| 3055 Freeway | 0.36mi | 3/1.0 | 1,024 (0%) | 6mo | $160,000 | $156 | 79 |
| 925 Catawba Ct | 0.36mi | 3/1.0 | 1,024 (0%) | 9mo | $195,000 | $190 | 76 |
| 800 Seckel Ct | 0.43mi | 2/1.0 (-1) | 1,024 (0%) | 6mo | $135,000 | $132 | 70 |
| 2725 Yarnall Rd | 0.55mi | 3/1.0 | 1,024 (0%) | 5mo | $210,000 | $205 | 70 |
| 3103 Ryerson Cir | 0.26mi | 3/1.0 | 1,116 (+9%) | 6mo | $179,900 | $161 | 68 |
| 2754 Yarnall Rd | 0.62mi | 3/1.0 | 1,024 (0%) | 7mo | $265,000 | $259 | 65 |
| 4432 Annapolis Rd | 0.68mi | 3/1.5 | 1,024 (0%) | 6mo | $228,000 | $223 | 62 |
| 2773 Yarnall Rd | 0.65mi | 3/1.0 | 1,101 (+8%) | 3mo | $229,500 | $208 | 55 |
Match score weights: distance 35% · size 25% · config 20% · recency 20%. Top-matched comps best support the ARV.
Projected returns pro-forma
-3.0% appreciation · 1.17% rent growth · sell at horizon
- IRR
- -9.1%
- Equity multiple
- 0.67×
- Total profit
- $-16,916
- Equity at exit
- $27,569
- IRR
- -2.1%
- Equity multiple
- 0.87×
- Total profit
- $-6,946
- Equity at exit
- $15,987
Cash invested: $51,772 (down + closing). Projections, not guarantees.
Landlord ↔ Tenant lean methodology
- Overall (STATE)
- 27 Tenant-Leaning
- State Maryland
- 27 Tenant-Leaning · D+14
- County
- — inherits STATE
- City
- — inherits STATE
ZIP-level market 21227
- Rents YoY
- 1.2%
- Active inventory
- 99
- Price-to-rent
- 8.3×
Monthly cashflow live
- Estimated rent
- $1,862 high interval (Pro) →
- Mortgage (P&I)
- −$970
- Tax from tax record
- −$166 /mo · $1,996/yr
- Insurance
- −$77
- HOA
- −$0
- Vacancy / Maint / Mgmt
- −$391
- Net cashflow
- $258
Break-even live
UW: 25.0% down · 7.5% · 30yr · 1.5% tax · 5.0% vac · 8.0% maint · 8.0% mgmt
Financing live
Cash to close
- Down payment
- $46,225
- Closing costs
- $5,547
- Reserves months
- —
- Total cash needed
- —
Loan-product check · same deal, 3 products live
Conventional
25% down · 7.5% · 30yr
- Down + closing
- —
- Monthly P&I
- —
- Monthly cashflow
- —
- DSCR
- —
- Eligible?
- —
Personal DTI + credit; lowest rate.
DSCR
20% down · 8.5% · 30yr
- Down + closing
- —
- Monthly P&I
- —
- Monthly cashflow
- —
- DSCR
- —
- Eligible?
- —
No personal income docs; deal must DSCR.
Hard money
10% down · 12.0% · 12mo
- Down + closing
- —
- Monthly P&I
- —
- Monthly cashflow
- —
- DSCR
- —
- Eligible?
- —
Short-term bridge; refi at stabilization.
Rent comps 11 comps
| Address | Beds | Baths | Sqft | Rent | $/sqft | DOM | Units | Dist |
|---|---|---|---|---|---|---|---|---|
| 3167 Ryerson Cir Halethorpe, MD | 3.0 | 1.5 | 1116 | $1,995 | $1.79 | 5d | 1 | 0.19mi |
| 3269 Ryerson Cir Halethorpe, MD | 3.0 | 2.0 | 1303 | $1,700 | $1.30 | 10d | 1 | 0.31mi |
| 3111 Bero Rd Halethorpe, MD | 3.0 | 2.0 | 1024 | $1,750 | $1.71 | 43d | 1 | 0.35mi |
| 902 Catawba Ct Halethorpe, MD | 3.0 | 1.0 | 906 | $1,495 | $1.65 | 22d | 1 | 0.40mi |
| 4369 Hollins Ferry Rd Halethorpe, MD | 3.0 | 1.0 | 1152 | $1,900 | $1.65 | 43d | 1 | 0.42mi |
| 2715 Hammonds Ferry Rd Halethorpe, MD | 2.0 | 1.0 | 992 | $1,500 | $1.51 | 43d | 1 | 0.86mi |
| 3010 Alabama Ave Halethorpe, MD | 2.0 | 1.0 | 900 | $2,200 | $2.44 | 18d | 1 | 1.20mi |
| 2200 W Patapsco Ave Baltimore, MD | 3.0 | 1.0 | 890 | $1,569 | $1.76 | 43d | 1 | 1.30mi |
| 2600 W Patapsco Ave Baltimore, MD | 1.0–2.0 | 1.0 | 856 | $1,309 | $1.53 | 2d | 24 | 1.35mi |
| 3017 Janice Ave Baltimore, MD | 3.0 | 1.0 | 1024 | $1,995 | $1.95 | 24d | 1 | 1.48mi |
| 3004 Elizabeth Ave Unit 1 Baltimore, MD | 3.0 | 1.0 | 1024 | $1,395 | $1.36 | 4d | 1 | 1.49mi |
Listing history 14 events
-
2026-06-19price $184,900 Active 18 DOM
-
2026-06-18days on market $189,000 Active 18 DOM
-
2026-06-17days on market $189,000 Active 17 DOM
-
2026-06-16days on market $189,000 Active 16 DOM
-
2026-06-15days on market $189,000 Active 15 DOM
-
2026-06-13days on market $189,000 Active 13 DOM
-
2026-06-09days on market $189,000 Active 9 DOM
-
2026-06-08days on market $189,000 Active 8 DOM
-
2026-06-07days on market $189,000 Active 7 DOM
-
2026-06-04days on market $189,000 Active 4 DOM
-
2026-06-03days on market $189,000 Active 3 DOM
-
2026-06-02days on market $189,000 Active 2 DOM
-
2026-06-01statusdays on market $189,000 Active 1 DOM
-
2026-05-31days on market $189,000 Coming Soon 2 DOM
ⓘ Source: listings_history table (triggers on properties + properties_extension) + one-shot
backfill from property_details.listing_events for pre-trigger history.
Tax reassessment forecast MD · Partial reset (capped growth)
- Current annual tax
- $1,996 · $166/mo
- Projected year-2 tax
- $2,006 · $167/mo
- Expected delta
- +$10/yr (+$1/mo · 0.5%)
ⓘ Screening estimate from a state-policy table — verify with the county assessor before closing.
Climate risk First Street
- Flood 1/10 Low FEMA zone X (unshaded) · 0% chance over 30 yrs
- Wildfire 1/10 Low
- Heat 7/10 Severe 7 d/yr ≥103°F today · 15 d/yr by 30 yrs out
- Wind 6/10 Major 27% chance of damaging wind over 30 yrs
- Air quality 4/10 Moderate 5 unhealthy d/yr today · 6 by 30 yrs out
Nearby sold comps map
Loading sold comps map…
Walkable amenities ~0.75 mi
Loading nearby amenities…
Taxation est. · year 1
- Rental income
- $22,342
- − Mortgage interest
- −$10,357
- − Property taxes
- −$1,996
- − Insurance
- −$924
- − Repairs & maintenance
- −$1,787
- − Management
- −$1,787
- − Depreciation
- −$5,379
- Taxable income
- $111
- Est. tax owed @ 24.0%
- −$27
- After-tax cash flow
- $3,068/yr
For passive investors: Depreciation is non-cash, so a rental often shows a tax loss while cash-flowing — sheltering income. Rental losses are passive: they offset passive income freely, and up to $25,000/yr can offset ordinary (W-2) income if you actively participate and your MAGI is under $100k (phasing out to $0 by $150k); unused losses carry forward. On sale, claimed depreciation is recaptured at up to 25%, and gains may owe capital-gains tax (a 1031 exchange can defer both). Figures are a year-1 estimate at your 24.0% rate — not tax advice; consult a CPA.
Schools (NCES district)
- District
- Baltimore County Public Schools
- NCES district ID
- 2400120
- Math proficiency
- 15% ▼ -16.00%
- Reading proficiency
- 34% ▼ -5.00%
- Median HH income
- $66,746
- Composite
- 23.17/100
- National rank
- #7948
- State rank
- #11 of 24 in MD
Livability — Lansdowne
- Score
- 66/100
- State rank
- #235
- US rank
- #11670
Category grades
Schools grade is shown separately in the Schools card above.
Census & demographics
- Census place
- Lansdowne, MD
- County
- Baltimore County · 769,527 people
- Metro
- Baltimore-Columbia-Towson, MD
- Population (ZIP)
- 34,907
- Household income
- $85,986
- Rent vs Own
- Severe rent burden
- 930.0
Population outlook (Baltimore County) Hauer SSP2
- Today (2025)
- 885,518 people
- By 2030
- 909,272 · +2.7%
- By 2040
- 951,547 · +7.5%
- By 2050
- 990,955 · +11.9%
- By 2075
- 1,086,411 · +22.7%
- By 2100
- 1,135,078 · +28.2%
Race, ethnicity, and origin ACS 2023
- Neighborhood character
- Diverse neighborhood (Simpson 0.59)
- Race & ethnicity
- White 61% Black 16% Hispanic / Latino 12% Two or more races 7% Asian 4%
- Hispanic origin (detail)
- Mexican 2%
- Common ancestry
- Romanian 2% Italian 2% Slovak 2%
- Foreign-born
- 13% · Canada, Philippines, China
- Languages at home
- 83% English-only · Spanish 10% Other Asian/Pacific 2% Other Indo-European 2%
Political lean MEDSL · Baltimore
- 2024 margin
- Strong D (+24.5) · D 61.0% · R 36.5% · Other 2.5%
- 2008→2024 swing
- +9.9pp toward D · 2008: 14.6pp · 2024: 24.5pp
- All cycles
- 2024: D+24.5 2020: D+27.0 2016: D+17.4 2012: D+16.4 2008: D+14.6
Not yet ingested
- Civics
- —
Market trends
- HPI YoY
- ▼ -294.07%
- Current HPI
- 281.9628
- Rent YoY
- ▲ 1.17%
- Metro
- Baltimore-Columbia-Towson, MD
- State GDP YoY
- ▲ 2.97%
- F500 in state
- 12
Industry mix (Fortune 500 HQ in MD)
| Industry | F500 HQs | Revenue |
|---|---|---|
| Aerospace / Defense | 1 | $71B |
|
||
| Utilities | 1 | $25B |
|
||
| Hotels | 1 | $24B |
|
||
| Consumer Goods | 1 | $7B |
|
||
| Real Estate | 1 | $6B |
|
||
| Chemicals | 1 | $2B |
|
||
Price history
+204.8% since first listed10 events — show timeline
- 2026-05-29 Coming Soon $189,000 BRIGHT MLS
- 2026-01-02 Listing Removed — BRIGHT MLS
- 2025-07-11 Price Changed $190,000 BRIGHT MLS
- 2025-02-07 Listed $205,000 BRIGHT MLS
- 2020-06-17 Sold (Public Records) $124,900 Public Records
- 2020-06-08 Sold (MLS) $124,900 BRIGHT MLS
- 2020-04-08 Pending — BRIGHT MLS
- 2020-02-20 Listed $124,900 BRIGHT MLS
- 2020-01-07 Sold (Public Records) $74,000 Public Records
- 1992-06-30 Sold (Public Records) $62,000 Public Records
Property tax history
+2.2%/yrLatest (2025): $1,996 · +10.5% YoY. Source: county tax records.
Cash-flow waterfall
monthlySold comps — $/sqft
last 12 mo · ≤1 miLoading sold comps…