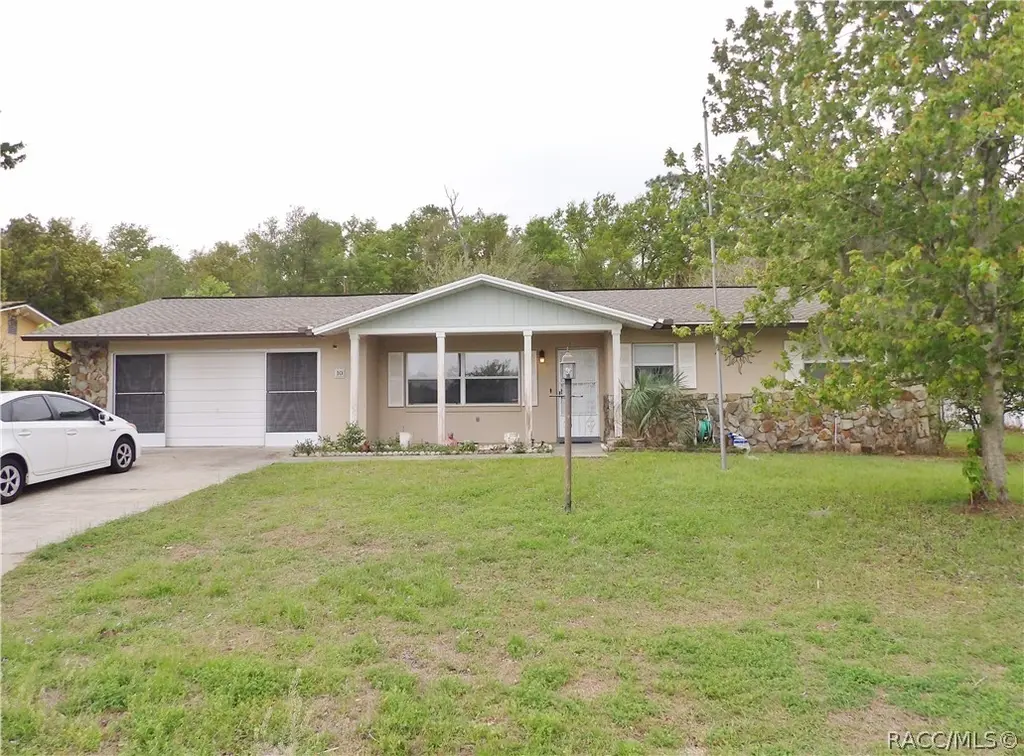
10 New Florida Ave · Pine Ridge, FL
Flood risk 1/10 · Minimal
- FEMA flood zone
- X (unshaded)
- Chance of flooding over 30 yrs
- 0.0%
- Est. flood insurance / yr
- $507 – $1,088
Fire risk 5/10 · Moderate
- Est. fire insurance / yr
- $947 – $1,759
Heat risk 9/10 · Severe
- Hot days now (above 108°F)
- 7 days/yr
- Hot days in 30 yrs
- 24 days/yr
Wind risk 9/10 · Severe
- Chance of severe wind over 30 yrs
- 99.0%
Air-quality risk 1/10 · Minimal
- Unhealthy air days now
- 0 days/yr
- Unhealthy air days in 30 yrs
- 0 days/yr
Risk factors via First Street. Map © Google.
Why this score? — see what drove the C- grade
The composite is a weighted blend of 9 inputs, each scored 0–100. Each bar is that input's sub-score; the figure is the points it added to the 100-point composite (weight × sub-score).
- Cash flow +20.2/30.0
- ARV discount +10.7/15.0
- DSCR +6.4/10.0
- 1% rule +4.1/10.0
- Schools +4.1/10.0
- Livability +3.4/5.0
- Rent growth +2.5/5.0
- Condition / age +2.5/5.0
- Appreciation +0.0/10.0
$210,000
🖨 Deal sheet 📄 Offer letter ✓ Due diligence
Listing remarks MLS
WOW!!!! SAME FAMILY OWNED SINCE NEW * IMPERIAL EXECUTIVE MODEL WITH OVER 2300 SQ. FT. UNDER ROOF * CAGED INGROUND POOL * FENCED REAR YARD WITH GREENBELT BEHIND * ROOF SHINGLES NEW IN 2005 * TWO CAR GARAGE WITH SCREENING * ALL APPLIANCES REMAIN * KITCHEN CABINETS GALORE * FLORIDA ROOM HAS SLIDING GLASS WINDOWS AND SCREENS * MASTERBEDROOM HAS WALK-IN CEDAR CLOSET * AC UNIT UNDER BAY AREA GOLD CONTRACT-UP FOR RENEWAL 3/31/2008.BEVERLY HILL RECREATION ASSOCIATION IS VOLUNTARY $212.00 * * PER YEAR FOR TWO. * ALL SIZES AND SQ. FT. APPROX.
Key facts
- Covered front porch
- Newer roof
- Caged pool
Tags
Neighborhood map
What this means for you Summary
Snapshot
- This is a 2-bed/2.0-bath single-family listed at $210k.
Deal economics
- At list price, monthly cash flow is $265 ($3k/yr) — positive.
- The deal already cash-flows at list — no discount required.
- To meet the 1% rule (rent ≥ 1% of price), the offer needs to be $190k (9.4% below list).
- Recommended offer: $190k (9.4% below list) — sets the bar for 1% rule.
- Cap rate 7.8% vs local median 3.4% in Pine Ridge — top-decile yield for the area; either an underpriced asset or a hidden risk that comps aren't pricing in. Stress-test before assuming the spread holds.
Location & tenants
- Location reads 67/100 on livability (#565 in FL) — a middle-class / working-renter tenant base. Strengths: crime A+, housing A+, cost of living A-; Watch: health & safety C-, amenities F, commute F.
- Citrus (rural): math 49% / reading 50% proficiency, ranked #44 of 73 in FL (top 60%) — families likely to look elsewhere, expect single-tenant / working-renter base with shorter leases.
- Zoned schools: Forest Ridge Elementary School (math 55% / reading 59%, grade C+, #781 of 2,144 statewide, top 38%, 708 students, 67% FRL); Lecanto Middle School (math 49% / reading 49%, grade C-, #265 of 571 statewide, top 48%, 809 students, 55% FRL); Lecanto High School (math 46% / reading 53%, grade D, #179 of 667 statewide, top 29%, 1,630 students, 46% FRL) — zoned schools at 56% FRL track the district average.
- Market conditions: 396 active listings in the ZIP; 16 comparable units currently listed for rent nearby; rentals at typical pace (median 21d on market — plan ~3-4 weeks tenant-placement turnaround); 2,443 units permitted in Citrus County in 2024 (0 in 5+ unit buildings).
- This rent runs 42% of the median local income ($55k/yr) — at the standard rent-burdened threshold; future hikes will face affordability resistance.
Forward outlook
- Local home prices are declining (-3.0%/yr); year-one equity from $1k of loan paydown is wiped out by about $6k of value loss. Plan a longer hold.
- Citrus County population projected to shrink 10% by 2050 — rents likely to lag national; underwrite the cash flow, not the appreciation.
Negotiation context
- It's been on market 21 days — a 2% lower offer ($207k) is reasonable based on typical stale-listing flexibility.
- 2 sale attempts since 19y ago with the ask held roughly flat each time — persistent listings suggest the price (not the market) is what's stuck; bring a comps-based counter.
- Current owner paid $97k; list at $210k implies a 116% gain — meaningful room to come down on a strong offer.
Risks & watch-outs
- Climate carrying-cost: severe wind risk, 99% chance of damaging wind over 30y; moderate wildfire risk; extreme-heat days projected 7→24/yr by 2055 (HVAC capex compounding) — expect insurance premiums to compound above CPI over the hold.
Questions for the listing agent
- Is there a deadline driving the sale (1031 exchange, divorce, estate, relocation)? That informs how much negotiation room exists.
- Schools are F-rated, which usually means shorter tenancies and higher turnover. Who's the typical renter profile here, and what's been the actual vacancy rate?
- What's the average days-on-market for RENTAL listings here right now (not sales)? A rising rental-DOM trend means longer vacancies and softer asking-rent achievability than the comps imply.
- What's the recent tenant-quality profile in this submarket — average credit score on applications, eviction rate, late-payment / NSF rate, and stable-employment percentage? A property-management company in the area should have these aggregated.
- How much new for-sale + rental construction is in the pipeline within 1–3 miles? Heavy new supply typically softens prices + rents 12–24 months out; constrained supply supports both.
Investment metrics
- 1% rule
- 0.91% ✗
- Cap rate
- 7.81%
- Cash-on-cash
- 5.40%
- DSCR
- 1.24
- GRM
- 9.2
CMA / ARV
- ARV (on-the-fly)
- $226,164
- Comps found
- 12
Show comp detail 12 sales within ~0.75 mi
| Address | Dist | Beds/Ba | Sqft | Sold | Price | $/sf | Match |
|---|---|---|---|---|---|---|---|
| 10 New Florida Ave | 0.00mi | 2/2.0 | 1,692 (+6%) | 1mo | $192,500 | $114 | 90 |
| 2661 N Ezra Ter | 0.42mi | 2/2.0 | 1,606 (+0%) | 1mo | $399,900 | $249 | 80 |
| 2383 N Brentwood Cir | 0.53mi | 2/2.0 | 1,654 (+3%) | 5mo | $245,000 | $148 | 66 |
| 2299 N Brentwood Cir | 0.56mi | 3/2.0 (+1) | 1,625 (+1%) | 4mo | $215,000 | $132 | 63 |
| 1876 W Caroline Path | 0.63mi | 3/2.0 (+1) | 1,625 (+1%) | 3mo | $194,900 | $120 | 61 |
| 1883 W Shanelle Path | 0.63mi | 3/2.0 (+1) | 1,655 (+3%) | 1mo | $226,500 | $137 | 60 |
| 316 S Lincoln Ave | 0.70mi | 2/2.0 | 1,548 (-4%) | 3mo | $197,000 | $127 | 60 |
| 2451 N Brentwood Cir | 0.63mi | 3/2.0 (+1) | 1,645 (+3%) | 5mo | $260,000 | $158 | 57 |
| 1873 W Shanelle Path | 0.64mi | 2/2.0 | 1,444 (-10%) | 1mo | $199,000 | $138 | 53 |
| 1835 W Caroline Path | 0.65mi | 2/2.0 | 1,468 (-8%) | 4mo | $265,000 | $181 | 52 |
| 328 S Monroe St | 0.52mi | 3/2.0 (+1) | 1,743 (+9%) | 6mo | $246,500 | $141 | 51 |
| 1826 W Shanelle Path | 0.72mi | 3/2.0 (+1) | 1,720 (+7%) | 6mo | $279,000 | $162 | 44 |
Match score weights: distance 35% · size 25% · config 20% · recency 20%. Top-matched comps best support the ARV.
Projected returns pro-forma
-3.0% appreciation · 3.0% rent growth · sell at horizon
- IRR
- -8.0%
- Equity multiple
- 0.71×
- Total profit
- $-17,273
- Equity at exit
- $31,312
- IRR
- 1.5%
- Equity multiple
- 1.11×
- Total profit
- $6,253
- Equity at exit
- $18,157
Cash invested: $58,800 (down + closing). Projections, not guarantees.
Landlord ↔ Tenant lean methodology
- Overall (STATE)
- 87 Strongly Landlord-Friendly
- State Florida
- 87 Strongly Landlord-Friendly · R+3
- County
- — inherits STATE
- City
- — inherits STATE
ZIP-level market 34465
- Home prices YoY
- -33.1%
- Active inventory
- 396
- Price-to-rent
- 9.2×
Monthly cashflow live
- Estimated rent
- $1,904 high interval (Pro) →
- Mortgage (P&I)
- −$1,101
- Tax from tax record
- −$50 /mo · $604/yr
- Insurance
- −$88
- HOA
- −$0
- Vacancy / Maint / Mgmt
- −$400
- Net cashflow
- $265
Break-even live
UW: 25.0% down · 7.5% · 30yr · 1.5% tax · 5.0% vac · 8.0% maint · 8.0% mgmt
Financing live
Cash to close
- Down payment
- $52,500
- Closing costs
- $6,300
- Reserves months
- —
- Total cash needed
- —
Loan-product check · same deal, 3 products live
Conventional
25% down · 7.5% · 30yr
- Down + closing
- —
- Monthly P&I
- —
- Monthly cashflow
- —
- DSCR
- —
- Eligible?
- —
Personal DTI + credit; lowest rate.
DSCR
20% down · 8.5% · 30yr
- Down + closing
- —
- Monthly P&I
- —
- Monthly cashflow
- —
- DSCR
- —
- Eligible?
- —
No personal income docs; deal must DSCR.
Hard money
10% down · 12.0% · 12mo
- Down + closing
- —
- Monthly P&I
- —
- Monthly cashflow
- —
- DSCR
- —
- Eligible?
- —
Short-term bridge; refi at stabilization.
Rent comps 16 comps
| Address | Beds | Baths | Sqft | Rent | $/sqft | DOM | Units | Dist |
|---|---|---|---|---|---|---|---|---|
| 12 Montana St Beverly Hills, FL | 2.0 | 1.0 | 1088 | $1,700 | $1.56 | 21d | 1 | 0.18mi |
| 1984 W Marsten Ct Lecanto, FL | 3.0 | 2.0 | 1854 | $2,000 | $1.08 | 21d | 1 | 0.51mi |
| 1882 W Angelica Loop Lecanto, FL | 3.0 | 2.0 | 1706 | $1,900 | $1.11 | 21d | 1 | 0.56mi |
| 1933 W Shanelle Path Lecanto, FL | 3.0 | 2.0 | 1690 | $2,300 | $1.36 | 21d | 1 | 0.56mi |
| 1876 W Shanelle Path Lecanto, FL | 3.0 | 2.0 | 1675 | $2,100 | $1.25 | 21d | 1 | 0.63mi |
| 2131 N Pinecone Ave Lecanto, FL | 2.0 | 2.0 | 1438 | $2,000 | $1.39 | 21d | 1 | 0.68mi |
| 2443 N Andrea Pt Lecanto, FL | 3.0 | 2.5 | 1988 | $2,500 | $1.26 | 21d | 1 | 0.79mi |
| 209 S Tyler St Beverly Hills, FL | 2.0 | 2.0 | 1604 | $1,500 | $0.94 | 21d | 1 | 0.97mi |
| 1610 W Spring Meadow Loop Lecanto, FL | 2.0 | 2.5 | 1359 | $2,700 | $1.99 | 21d | 1 | 0.99mi |
| 1658 W Spring Meadow Loop Lecanto, FL | 2.0 | 2.5 | 1359 | $1,775 | $1.31 | 21d | 1 | 1.00mi |
| 1973 N Ember Path Hernando, FL | 2.0 | 2.0 | 1786 | $2,800 | $1.57 | 21d | 1 | 1.03mi |
| 95 S Fillmore St Beverly Hills, FL | 2.0 | 1.0 | 1056 | $1,300 | $1.23 | 21d | 1 | 1.16mi |
| 95 S Desoto St Beverly Hills, FL | 2.0 | 2.0 | 1152 | $1,435 | $1.25 | 21d | 1 | 1.24mi |
| 42 Roosevelt Blvd Unit 1 Beverly Hills, FL | 3.0 | 1.5 | 1612 | $1,449 | $0.90 | 21d | 1 | 1.32mi |
| 1281 W Diamond Shore Loop Hernando, FL | 2.0 | 2.0 | 1686 | $3,000 | $1.78 | 21d | 1 | 1.42mi |
| 3263 N Maidencane Dr Beverly Hills, FL | 2.0 | 1.0 | 1380 | $1,350 | $0.98 | 21d | 1 | 1.46mi |
Listing history 6 events
-
2026-04-15status Pending
-
2026-04-07price $210,000
-
2026-03-25$219,900 Active
-
2008-01-11soldstatus $97,000 563-char remark
Show marketing remark (563 chars)
WOW!!!! SAME FAMILY OWNED SINCE NEW * IMPERIAL EXECUTIVE MODEL WITH OVER 2300 SQ. FT. UNDER ROOF * CAGED INGROUND POOL * FENCED REAR YARD WITH GREENBELT BEHIND * ROOF SHINGLES NEW IN 2005 * TWO CAR GARAGE WITH SCREENING * ALL APPLIANCES REMAIN * KITCHEN CABINETS GALORE * FLORIDA ROOM HAS SLIDING GLASS WINDOWS AND SCREENS * MASTERBEDROOM HAS WALK-IN CEDAR CLOSET * AC UNIT UNDER BAY AREA GOLD CONTRACT-UP FOR RENEWAL 3/31/2008.BEVERLY HILL RECREATION ASSOCIATION IS VOLUNTARY $212.00 * * PER YEAR FOR TWO. * ALL SIZES AND SQ. FT. APPROX.
-
2007-07-18$115,900 563-char remark
Show marketing remark (563 chars)
WOW!!!! SAME FAMILY OWNED SINCE NEW * IMPERIAL EXECUTIVE MODEL WITH OVER 2300 SQ. FT. UNDER ROOF * CAGED INGROUND POOL * FENCED REAR YARD WITH GREENBELT BEHIND * ROOF SHINGLES NEW IN 2005 * TWO CAR GARAGE WITH SCREENING * ALL APPLIANCES REMAIN * KITCHEN CABINETS GALORE * FLORIDA ROOM HAS SLIDING GLASS WINDOWS AND SCREENS * MASTERBEDROOM HAS WALK-IN CEDAR CLOSET * AC UNIT UNDER BAY AREA GOLD CONTRACT-UP FOR RENEWAL 3/31/2008.BEVERLY HILL RECREATION ASSOCIATION IS VOLUNTARY $212.00 * * PER YEAR FOR TWO. * ALL SIZES AND SQ. FT. APPROX.
-
1982-09-01soldstatus $62,900
ⓘ Source: listings_history table (triggers on properties + properties_extension) + one-shot
backfill from property_details.listing_events for pre-trigger history.
Tax reassessment forecast FL · Resets to sale price
- Current annual tax
- $604 · $50/mo
- Projected year-2 tax
- $1,743 · $145/mo
- Expected delta
- +$1,139/yr (+$95/mo · 188.5%)
ⓘ Screening estimate from a state-policy table — verify with the county assessor before closing.
Climate risk First Street
- Flood 1/10 Low FEMA zone X (unshaded) · 0% chance over 30 yrs
- Wildfire 5/10 Major
- Heat 9/10 Extreme 7 d/yr ≥108°F today · 24 d/yr by 30 yrs out
- Wind 9/10 Extreme 99% chance of damaging wind over 30 yrs
- Air quality 1/10 Low 0 unhealthy d/yr today · 0 by 30 yrs out
Nearby sold comps map
Loading sold comps map…
Walkable amenities ~0.75 mi
Loading nearby amenities…
Taxation est. · year 1
- Rental income
- $22,842
- − Mortgage interest
- −$11,763
- − Property taxes
- −$604
- − Insurance
- −$1,050
- − Repairs & maintenance
- −$1,827
- − Management
- −$1,827
- − Depreciation
- −$6,109
- Taxable loss
- −$339
- Est. tax savings @ 24.0%
- +$81
- After-tax cash flow
- $3,257/yr
For passive investors: Depreciation is non-cash, so a rental often shows a tax loss while cash-flowing — sheltering income. Rental losses are passive: they offset passive income freely, and up to $25,000/yr can offset ordinary (W-2) income if you actively participate and your MAGI is under $100k (phasing out to $0 by $150k); unused losses carry forward. On sale, claimed depreciation is recaptured at up to 25%, and gains may owe capital-gains tax (a 1031 exchange can defer both). Figures are a year-1 estimate at your 24.0% rate — not tax advice; consult a CPA.
Schools (NCES district)
- District
- Citrus
- NCES district ID
- 1200270
- Math proficiency
- 49% ▼ -10.00%
- Reading proficiency
- 50% ▼ -6.00%
- Median HH income
- $38,618
- Composite
- 41.28/100
- National rank
- #3519
- State rank
- #44 of 73 in FL
Livability — Pine Ridge
- Score
- 67/100
- State rank
- #565
- US rank
- #10798
Category grades
Schools grade is shown separately in the Schools card above.
Census & demographics
- Census place
- Pine Ridge, FL
- County
- Citrus County · 111,314 people
- City population
- 18,514
- Metro
- Homosassa Springs, FL
- Population (ZIP)
- 18,879
- Household income
- $54,869
- Rent vs Own
- Severe rent burden
- 334.0
Population outlook (Citrus County) Hauer SSP2
- Today (2025)
- 138,622 people
- By 2030
- 136,886 · -1.3%
- By 2040
- 132,009 · -4.8%
- By 2050
- 125,196 · -9.7%
- By 2075
- 108,570 · -21.7%
- By 2100
- 84,454 · -39.1%
Race, ethnicity, and origin ACS 2023
- Neighborhood character
- Predominantly White (82%)
- Race & ethnicity
- White 82% Hispanic / Latino 8% Black 4% Two or more races 3% Asian 2%
- Hispanic origin (detail)
- Mexican 1% Puerto Rican 3%
- Common ancestry
- Romanian 4% Lithuanian 3% Slovak 2%
- Foreign-born
- 8% · Canada, Vietnam, Dominican Republic
- Languages at home
- 93% English-only · Spanish 4% French/Haitian/Cajun 1% Other Asian/Pacific 1%
Political lean MEDSL · Citrus
- 2024 margin
- Solid R (+45.9) · D 26.8% · R 72.6%
- 2008→2024 swing
- -29.8pp toward R · 2008: -16.1pp · 2024: -45.9pp
- All cycles
- 2024: R+45.9 2020: R+41.0 2016: R+39.7 2012: R+21.9 2008: R+16.1
Not yet ingested
- Civics
- —
Market trends
- HPI YoY
- ▼ -138.62%
- Current HPI
- 279.7183
- Rent YoY
- —
- Metro
- Homosassa Springs, FL
- State GDP YoY
- ▲ 3.28%
- F500 in state
- 36
Industry mix (Fortune 500 HQ in FL)
| Industry | F500 HQs | Revenue |
|---|---|---|
| Industrial Technology | 2 | $29B |
|
||
| Insurance | 2 | $17B |
|
||
| Retail | 1 | $60B |
|
||
| Technology Distribution | 1 | $58B |
|
||
| Homebuilding | 1 | $35B |
|
||
| Technology Manufacturing | 1 | $35B |
|
||
Price history
+233.9% since first listed6 events — show timeline
- 2026-04-15 Pending — RACC
- 2026-04-07 Price Changed $210,000 RACC
- 2026-03-25 Listed $219,900 RACC
- 2008-01-11 Sold (MLS) $97,000 RACC
- 2007-07-18 Listed $115,900 RACC
- 1982-09-01 Sold (Public Records) $62,900 Public Records
Property tax history
+1.3%/yrLatest (2025): $604 · +10.2% YoY. Source: county tax records.
Cash-flow waterfall
monthlySold comps — $/sqft
last 12 mo · ≤1 miLoading sold comps…