8074 Lower Miamisburg Rd · Miamisburg, OH
Flood risk 1/10 · Minimal
- FEMA flood zone
- X (unshaded)
- Chance of flooding over 30 yrs
- 0.0%
- Est. flood insurance / yr
- $507 – $1,088
Fire risk 1/10 · Minimal
- Est. fire insurance / yr
- $713 – $1,323
Heat risk 4/10 · Minor
- Hot days now (above 101°F)
- 7 days/yr
- Hot days in 30 yrs
- 19 days/yr
Wind risk 2/10 · Minimal
- Chance of severe wind over 30 yrs
- 1.0%
Air-quality risk 3/10 · Minor
- Unhealthy air days now
- 2 days/yr
- Unhealthy air days in 30 yrs
- 4 days/yr
Risk factors via First Street. Map © Google.
Why this score? — see what drove the C- grade
The composite is a weighted blend of 9 inputs, each scored 0–100. Each bar is that input's sub-score; the figure is the points it added to the 100-point composite (weight × sub-score).
- Cash flow +18.3/30.0
- ARV discount +7.5/15.0
- DSCR +5.7/10.0
- Schools +5.3/10.0
- 1% rule +4.9/10.0
- Livability +3.8/5.0
- Rent growth +2.5/5.0
- Condition / age +2.5/5.0
- Appreciation +0.0/10.0
$200,000
🖨 Deal sheet 📄 Offer letter ✓ Due diligence
Listing remarks
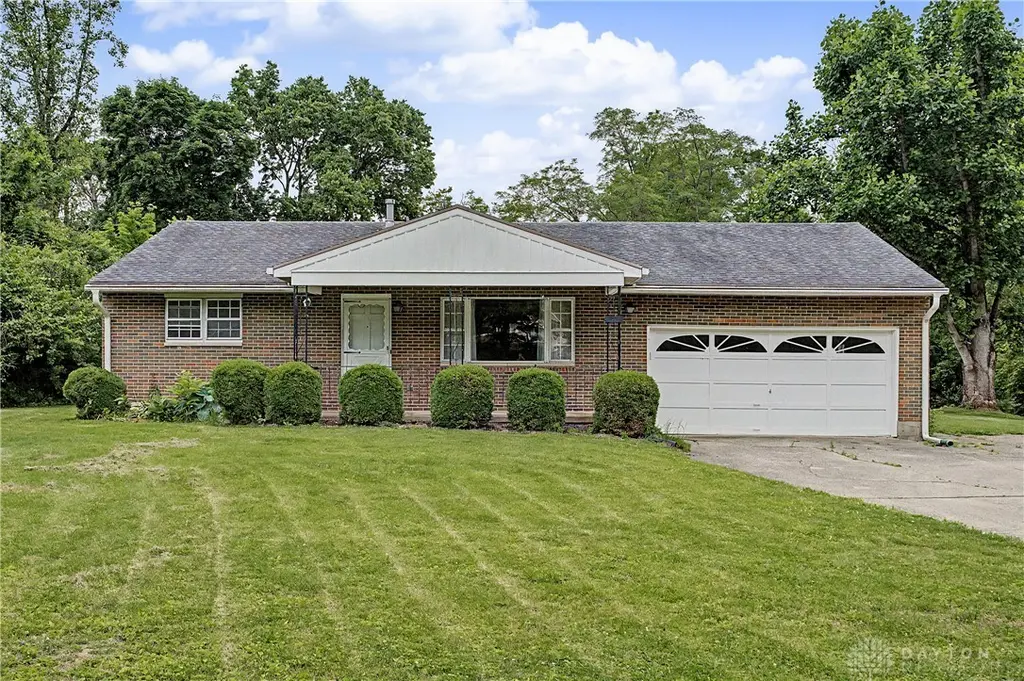
Opportunity awaits with this one-owner brick ranch situated on 1.3 acres in the Valley View School District. Offering timeless curb appeal, the home welcomes you with a circular driveway, covered front porch, and a spacious lot with room to enjoy quiet living. Inside, natural light fills the living room through a large picture window. The thoughtfully designed floor plan offers comfortable everyday living, with the kitchen opening seamlessly to the family room and providing convenient access to the oversized two-car garage. Three generously sized bedrooms feature ample closet space, including a primary suite with an attached bath, direct access to the laundry area, and access to the backyar
Key facts
- Covered front porch
- Large picture window
- Natural light
Tags
Property features AI
Finance
- Financial info: Property offered for sale
Exterior
- Parking: Attached two-car garage with automatic door opener
- Utilities: Natural gas available; Well water; Septic system
- Home design: Single-story brick home
- Construction: Brick construction; Crawl space foundation
- Exterior features: 1.29-acre residential lot; Storage shed on property; Additional storage
Interior
- Kitchen: Refrigerator
- Bedrooms: Three main-level bedrooms (14 x 9; 11 x 10; 14 x 10)
- Bathrooms: Two full bathrooms (both on main level)
- Heating & cooling: Natural gas forced-air heating; Central air conditioning
- Interior features: Kitchen open to family room; Double-hung vinyl windows
- Laundry & utility: Main-level laundry (6 x 5); Gas water heater
Neighborhood map
What this means for you Summary
Snapshot
- This is a 3-bed/1.5-bath single-family listed at $200k.
Deal economics
- At list price, monthly cash flow is $184 ($2k/yr) — positive.
- The deal already cash-flows at list — no discount required.
- To meet the 1% rule (rent ≥ 1% of price), the offer needs to be $198k (1.2% below list).
- Recommended offer: $198k (1.2% below list) — sets the bar for 1% rule.
- Cap rate 7.4% vs local median 2.9% in Miamisburg — top-decile yield for the area; either an underpriced asset or a hidden risk that comps aren't pricing in. Stress-test before assuming the spread holds.
Location & tenants
- Location reads 76/100 on livability (#228 in OH, #3,550 nationally) — a middle-class / working-renter tenant base. Strengths: cost of living A+, housing A+, crime A-; Watch: health & safety C-, amenities F, commute F.
- Valley View Local (suburban): math 54% / reading 69% proficiency, ranked #250 of 656 in OH (top 38%) — acceptable for families but not a draw, mixed tenant base, ~2y average lease.
- Market conditions: 29 active listings in the ZIP; 2 comparable units currently listed for rent nearby; solid renter incomes; 907 units permitted in Montgomery County in 2024 (416 in 5+ unit buildings).
Forward outlook
- Local home prices are declining (-3.0%/yr); year-one equity from $1k of loan paydown is wiped out by about $6k of value loss. Plan a longer hold.
- Montgomery County population projected at -10% by 2050 — secular population decline; favor cash flow + early exit over multi-decade hold.
Negotiation context
- Only 1 days on market — expect competitive offers; lowballing is unlikely to land.
Questions for the listing agent
- Built in 1970 — when were the roof, HVAC, electrical panel, plumbing, and water heater last replaced?
- Is there a deadline driving the sale (1031 exchange, divorce, estate, relocation)? That informs how much negotiation room exists.
- Schools are B-rated — typically a magnet for longer-tenancy family renters. What's the average tenant stay here, and is there a school-zone premium baked into asking?
- What's the average days-on-market for RENTAL listings here right now (not sales)? A rising rental-DOM trend means longer vacancies and softer asking-rent achievability than the comps imply.
- What's the recent tenant-quality profile in this submarket — average credit score on applications, eviction rate, late-payment / NSF rate, and stable-employment percentage? A property-management company in the area should have these aggregated.
- How much new for-sale + rental construction is in the pipeline within 1–3 miles? Heavy new supply typically softens prices + rents 12–24 months out; constrained supply supports both.
Investment metrics
- 1% rule
- 0.99% ✗
- Cap rate
- 7.39%
- Cash-on-cash
- 3.93%
- DSCR
- 1.17
- GRM
- 8.4
CMA / ARV
- ARV (on-the-fly)
- $400,728
- Comps found
- 2
Show comp detail 2 sales within ~0.75 mi
| Address | Dist | Beds/Ba | Sqft | Sold | Price | $/sf | Match |
|---|---|---|---|---|---|---|---|
| 7519 Lower Miamisburg Rd | 0.56mi | 3/2.0 | 1,404 (-1%) | 1mo | $340,000 | $242 | 70 |
| 7300 Jamaica Rd | 0.74mi | 3/1.0 | 1,344 (-5%) | 22mo | $380,000 | $283 | 36 |
Match score weights: distance 35% · size 25% · config 20% · recency 20%. Top-matched comps best support the ARV.
Projected returns pro-forma
-3.0% appreciation · 3.0% rent growth · sell at horizon
- IRR
- -10.1%
- Equity multiple
- 0.63×
- Total profit
- $-20,694
- Equity at exit
- $29,821
- IRR
- -0.7%
- Equity multiple
- 0.95×
- Total profit
- $-2,861
- Equity at exit
- $17,292
Cash invested: $56,000 (down + closing). Projections, not guarantees.
Landlord ↔ Tenant lean methodology
- Overall (STATE)
- 73 Landlord-Friendly
- State Ohio
- 73 Landlord-Friendly · R+6
- County
- — inherits STATE
- City
- — inherits STATE
ZIP-level market 45327
- Active inventory
- 29
- Price-to-rent
- 8.4×
Monthly cashflow live
- Estimated rent
- $1,975 medium interval (Pro) →
- Mortgage (P&I)
- −$1,049
- Tax from tax record
- −$245 /mo · $2,938/yr
- Insurance
- −$83
- HOA
- −$0
- Vacancy / Maint / Mgmt
- −$415
- Net cashflow
- $184
Break-even live
UW: 25.0% down · 7.5% · 30yr · 1.5% tax · 5.0% vac · 8.0% maint · 8.0% mgmt
Financing live
Cash to close
- Down payment
- $50,000
- Closing costs
- $6,000
- Reserves months
- —
- Total cash needed
- —
Loan-product check · same deal, 3 products live
Conventional
25% down · 7.5% · 30yr
- Down + closing
- —
- Monthly P&I
- —
- Monthly cashflow
- —
- DSCR
- —
- Eligible?
- —
Personal DTI + credit; lowest rate.
DSCR
20% down · 8.5% · 30yr
- Down + closing
- —
- Monthly P&I
- —
- Monthly cashflow
- —
- DSCR
- —
- Eligible?
- —
No personal income docs; deal must DSCR.
Hard money
10% down · 12.0% · 12mo
- Down + closing
- —
- Monthly P&I
- —
- Monthly cashflow
- —
- DSCR
- —
- Eligible?
- —
Short-term bridge; refi at stabilization.
Rent comps 2 comps
| Address | Beds | Baths | Sqft | Rent | $/sqft | DOM | Units | Dist |
|---|---|---|---|---|---|---|---|---|
| 136 Rogers Dr Germantown, OH | 3.0 | 1.0 | 1118 | $1,425 | $1.27 | 2d | 1 | 1.18mi |
| 849 Johnson Ave Miamisburg, OH | 4.0 | 2.5 | 1442 | $2,500 | $1.73 | 2d | 1 | 1.40mi |
Listing history 3 events
-
2026-06-07status $200,000 Pending 1 DOM
-
2026-06-02remarks 699-char remark
-
2026-06-02$200,000 Active 1 DOM
ⓘ Source: listings_history table (triggers on properties + properties_extension) + one-shot
backfill from property_details.listing_events for pre-trigger history.
Tax reassessment forecast OH · Partial reset (capped growth)
- Current annual tax
- $2,938 · $245/mo
- Projected year-2 tax
- $3,029 · $252/mo
- Expected delta
- +$91/yr (+$8/mo · 3.1%)
ⓘ Screening estimate from a state-policy table — verify with the county assessor before closing.
Climate risk First Street
- Flood 1/10 Low FEMA zone X (unshaded) · 0% chance over 30 yrs
- Wildfire 1/10 Low
- Heat 4/10 Moderate 7 d/yr ≥101°F today · 19 d/yr by 30 yrs out
- Wind 2/10 Low 100% chance of damaging wind over 30 yrs
- Air quality 3/10 Moderate 2 unhealthy d/yr today · 4 by 30 yrs out
Nearby sold comps map
Loading sold comps map…
Walkable amenities ~0.75 mi
Loading nearby amenities…
Taxation est. · year 1
- Rental income
- $23,703
- − Mortgage interest
- −$11,203
- − Property taxes
- −$2,938
- − Insurance
- −$1,000
- − Repairs & maintenance
- −$1,896
- − Management
- −$1,896
- − Depreciation
- −$5,818
- Taxable loss
- −$1,048
- Est. tax savings @ 24.0%
- +$252
- After-tax cash flow
- $2,454/yr
For passive investors: Depreciation is non-cash, so a rental often shows a tax loss while cash-flowing — sheltering income. Rental losses are passive: they offset passive income freely, and up to $25,000/yr can offset ordinary (W-2) income if you actively participate and your MAGI is under $100k (phasing out to $0 by $150k); unused losses carry forward. On sale, claimed depreciation is recaptured at up to 25%, and gains may owe capital-gains tax (a 1031 exchange can defer both). Figures are a year-1 estimate at your 24.0% rate — not tax advice; consult a CPA.
Schools (NCES district)
- District
- Valley View Local
- NCES district ID
- 3904874
- Math proficiency
- 54% ▼ -17.00%
- Reading proficiency
- 69% ▼ -7.00%
- Median HH income
- $60,457
- Composite
- 53.26/100
- National rank
- #1495
- State rank
- #250 of 656 in OH
Livability — Miamisburg
- Score
- 76/100
- State rank
- #228
- US rank
- #3550
Category grades
Schools grade is shown separately in the Schools card above.
Census & demographics
- County
- Montgomery · 506,435 people
- City population
- 36,152
- Metro
- Dayton-Kettering-Beavercreek, OH
- Population (ZIP)
- 8,949
- Household income
- $84,538
- Rent vs Own
Population outlook (Montgomery County) Hauer SSP2
- Today (2025)
- 523,241 people
- By 2030
- 514,948 · -1.6%
- By 2040
- 493,378 · -5.7%
- By 2050
- 469,639 · -10.2%
- By 2075
- 418,360 · -20.0%
- By 2100
- 353,315 · -32.5%
Race, ethnicity, and origin ACS 2023
- Neighborhood character
- Predominantly White (94%)
- Race & ethnicity
- White 94% Two or more races 4% Hispanic / Latino 2%
- Common ancestry
- Lithuanian 4% Italian 3% Slovak 2%
- Foreign-born
- 0%
Political lean MEDSL · Montgomery
- 2024 margin
- Toss-up / Even · D 49.8% · R 49.3%
- 2008→2024 swing
- -5.8pp toward R · 2008: 6.2pp · 2024: 0.5pp
- All cycles
- 2024: D+0.5 2020: D+2.2 2016: R+1.2 2012: D+3.1 2008: D+6.2
Not yet ingested
- Civics
- —
Market trends
- HPI YoY
- ▼ -116.46%
- Current HPI
- 198.3053
- Rent YoY
- —
- Metro
- —
- State GDP YoY
- ▲ 1.98%
- F500 in state
- 48
Industry mix (Fortune 500 HQ in OH)
| Industry | F500 HQs | Revenue |
|---|---|---|
| Insurance | 3 | $145B |
|
||
| Industrial Machinery | 3 | $49B |
|
||
| Financial Services | 3 | $24B |
|
||
| Consumer Goods | 2 | $93B |
|
||
| Aerospace / Defense | 2 | $47B |
|
||
| Utilities | 2 | $33B |
|
||
Price history
1 event — show timeline
- 2026-06-01 Listed $200,000 Dayton MLS
Property tax history
+4.4%/yrLatest (2025): $2,938 · +6.7% YoY. Source: county tax records.
Cash-flow waterfall
monthlySold comps — $/sqft
last 12 mo · ≤1 miLoading sold comps…