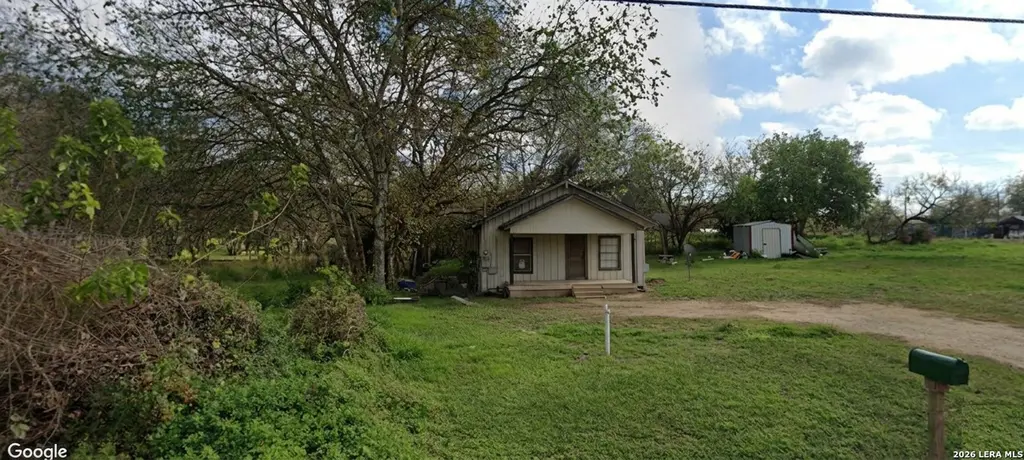
708 Peach · Floresville, TX
Flood risk 7/10 · Major
- FEMA flood zone
- AE
- Chance of flooding over 30 yrs
- 0.99%
- Est. flood insurance / yr
- $1,737 – $8,500
Fire risk 4/10 · Minor
- Est. fire insurance / yr
- $1,222 – $2,270
Heat risk 8/10 · Major
- Hot days now (above 110°F)
- 7 days/yr
- Hot days in 30 yrs
- 20 days/yr
Wind risk 8/10 · Major
- Chance of severe wind over 30 yrs
- 80.0%
Air-quality risk 1/10 · Minimal
- Unhealthy air days now
- 0 days/yr
- Unhealthy air days in 30 yrs
- 0 days/yr
Risk factors via First Street. Map © Google.
Why this score? — see what drove the B- grade
The composite is a weighted blend of 9 inputs, each scored 0–100. Each bar is that input's sub-score; the figure is the points it added to the 100-point composite (weight × sub-score).
- Cash flow +30.0/30.0
- 1% rule +10.0/10.0
- DSCR +10.0/10.0
- ARV discount +7.5/15.0
- Livability +3.2/5.0
- Schools +3.0/10.0
- Rent growth +2.5/5.0
- Condition / age +2.5/5.0
- Appreciation +0.0/10.0
$70,000
🖨 Deal sheet 📄 Offer letter ✓ Due diligence
Listing remarks
0.54-Acre Investor Special - Multiple Exit Strategies & Utilities Ready. Prime opportunity in Wilson County! This expansive 0.54-acre lot offers maximum flexibility for your next project. Utilities are already in place with water and electric connected on-site. Choose Your Strategy: Renovate: Restore the existing structure to its full potential. New Build: Clear the site for a custom dream home. Rapid Turn: Perfect for MFR, Modular, or Pier & Beam placement. Value Advantage: Land alone valued at $85,780 per Tax Assessor. This is a high-equity play ready for immediate development.
Key facts
- Existing structure
- Land valued at 85780
- 0.54-acre lot
Tags
Property features AI
Finance
- HOA & community: Subdivision: FLORESVILLE SECTIONS
Exterior
- Utilities: City water/sewer
- Home design: Pre-owned property; Approximate age: 116 years
- Construction: Composition roof
- Exterior features: Siding exterior
Interior
- Kitchen: Kitchen approx. 10 x 10
- Bedrooms: Master bedroom (lower level) — approx. 12 x 12; Bedroom 2 — approx. 10 x 10; Bedroom 3 — approx. 10 x 10
- Flooring: Carpeting; Wood floors
- Bathrooms: One full bathroom
- Heating & cooling: Propane (owned) heating; Other heating (see remarks); Other air conditioning (see remarks)
- Interior features: One living area; Some window coverings remain
Neighborhood map
What this means for you Summary
Snapshot
- This is a 3-bed/1.0-bath single-family listed at $70k.
Deal economics
- At list price, monthly cash flow is $166 ($2k/yr) — positive.
- The deal already cash-flows at list — no discount required.
- Meets the 1% rule at list price ($1k rent vs $70k).
- Recommended offer: $68k (3.0% below list) — sets the bar for market timing.
- Cap rate 16.4% vs local median 2.0% in Floresville — top-decile yield for the area; either an underpriced asset or a hidden risk that comps aren't pricing in. Stress-test before assuming the spread holds.
Location & tenants
- Location reads 65/100 on livability (#681 in TX) — a middle-class / working-renter tenant base. Strengths: cost of living A+, housing A+, crime A-; Watch: employment D+, health & safety D+, amenities F.
- Floresville ISD (town): math 32% / reading 36% proficiency, ranked #504 of 826 in TX (top 61%) — families likely to look elsewhere, expect single-tenant / working-renter base with shorter leases.
- Zoned schools: Floresville North El (math 30% / reading 37%, grade F, #2,174 of 4,322 statewide, top 51%, 844 students, 58% FRL); Floresville H S (math 36% / reading 45%, grade F, #798 of 1,632 statewide, top 49%, 1,246 students, 52% FRL).
- Market conditions: 302 active listings in the ZIP; 1 comparable units currently listed for rent nearby; solid renter incomes; 135 units permitted in Wilson County in 2024 (0 in 5+ unit buildings).
Forward outlook
- Local home prices are declining (-3.0%/yr); year-one equity from $484 of loan paydown is wiped out by about $2k of value loss. Plan a longer hold.
- Wilson County population projected at +46% by 2050 — long-run rental-demand tailwind backs the buy-and-hold thesis.
- At projected returns (-3.0% appreciation + 3.0% rent growth), your $20k cash investment doubles in ~10 years — after that, you're playing with house money.
Negotiation context
- It's been on market 47 days — a 3% lower offer ($68k) is reasonable based on typical stale-listing flexibility.
Risks & watch-outs
- Watch-outs: property tax is 2.9% of price; flood insurance adds $427/mo; built in 1910 — expect roof / HVAC / electrical / plumbing capex.
- Climate carrying-cost: in FEMA flood zone AE (mandatory federal flood insurance); severe wind risk, 80% chance of damaging wind over 30y; extreme-heat days projected 7→20/yr by 2055 (HVAC capex compounding) — expect insurance premiums to compound above CPI over the hold.
Questions for the listing agent
- It's been on market 47 days. Have you received any prior offers? Is the seller open to a 3% concession, seller financing, or rate buy-down credit?
- Built in 1910 — when were the roof, HVAC, electrical panel, plumbing, and water heater last replaced?
- Property tax is high relative to price — has the assessment been appealed recently, and will the sale trigger a re-assessment?
- What's the actual annual flood-insurance premium (NFIP or private), and is the property in a SFHA with mandatory coverage?
- Is there a deadline driving the sale (1031 exchange, divorce, estate, relocation)? That informs how much negotiation room exists.
- What's the average days-on-market for RENTAL listings here right now (not sales)? A rising rental-DOM trend means longer vacancies and softer asking-rent achievability than the comps imply.
- What's the recent tenant-quality profile in this submarket — average credit score on applications, eviction rate, late-payment / NSF rate, and stable-employment percentage? A property-management company in the area should have these aggregated.
- How much new for-sale + rental construction is in the pipeline within 1–3 miles? Heavy new supply typically softens prices + rents 12–24 months out; constrained supply supports both.
Investment metrics
- 1% rule
- 2.10% ✓
- Cap rate
- 16.44%
- Cash-on-cash
- 36.25%
- DSCR
- 2.61
- GRM
- 4.0
CMA / ARV
- ARV (median comp)
- $142,639
- List price
- $70,000
- Delta
- -50.93%
- Verdict
- UNDERPRICED
- Comps
- 12 within 1.0 mi
Projected returns pro-forma
-3.0% appreciation · 3.0% rent growth · sell at horizon
- IRR
- -0.6%
- Equity multiple
- 0.98×
- Total profit
- $-463
- Equity at exit
- $10,437
- IRR
- 9.5%
- Equity multiple
- 1.74×
- Total profit
- $14,539
- Equity at exit
- $6,052
Cash invested: $19,600 (down + closing). Projections, not guarantees.
Landlord ↔ Tenant lean methodology
- Overall (STATE)
- 87 Strongly Landlord-Friendly
- State Texas
- 87 Strongly Landlord-Friendly · R+5
- County
- — inherits STATE
- City
- — inherits STATE
ZIP-level market 78114
- Home prices YoY
- -27.3%
- Active inventory
- 302
- Price-to-rent
- 4.0×
Monthly cashflow live
- Estimated rent
- $1,468 medium interval (Pro) →
- Mortgage (P&I)
- −$367
- Tax from tax record
- −$172 /mo · $2,059/yr
- Insurance
- −$29
- Flood insurance flood zone
- −$427 /mo · $5,118/yr
- HOA
- −$0
- Vacancy / Maint / Mgmt
- −$308
- Net cashflow
- $166
Break-even live
UW: 25.0% down · 7.5% · 30yr · 1.5% tax · 5.0% vac · 8.0% maint · 8.0% mgmt
Financing live
Cash to close
- Down payment
- $17,500
- Closing costs
- $2,100
- Reserves months
- —
- Total cash needed
- —
Loan-product check · same deal, 3 products live
Conventional
25% down · 7.5% · 30yr
- Down + closing
- —
- Monthly P&I
- —
- Monthly cashflow
- —
- DSCR
- —
- Eligible?
- —
Personal DTI + credit; lowest rate.
DSCR
20% down · 8.5% · 30yr
- Down + closing
- —
- Monthly P&I
- —
- Monthly cashflow
- —
- DSCR
- —
- Eligible?
- —
No personal income docs; deal must DSCR.
Hard money
10% down · 12.0% · 12mo
- Down + closing
- —
- Monthly P&I
- —
- Monthly cashflow
- —
- DSCR
- —
- Eligible?
- —
Short-term bridge; refi at stabilization.
Rent comps 1 comps
| Address | Beds | Baths | Sqft | Rent | $/sqft | DOM | Units | Dist |
|---|---|---|---|---|---|---|---|---|
| 1310 S 4th St Floresville, TX | 2.0 | 1.0 | 932 | $1,450 | $1.56 | 1d | 1 | 1.08mi |
Listing history 14 events
-
2026-06-18days on market $70,000 Active 47 DOM
-
2026-06-17days on market $70,000 Active 46 DOM
-
2026-06-16days on market $70,000 Active 45 DOM
-
2026-06-15days on market $70,000 Active 44 DOM
-
2026-06-13days on market $70,000 Active 42 DOM
-
2026-06-09days on market $70,000 Active 38 DOM
-
2026-06-08days on market $70,000 Active 37 DOM
-
2026-06-07days on market $70,000 Active 36 DOM
-
2026-06-04days on market $70,000 Active 33 DOM
-
2026-06-03days on market $70,000 Active 32 DOM
-
2026-06-02days on market $70,000 Active 31 DOM
-
2026-06-01days on market $70,000 Active 30 DOM
-
2026-05-31days on market $70,000 Active 29 DOM
-
2026-05-02$70,000 New 606-char remark
ⓘ Source: listings_history table (triggers on properties + properties_extension) + one-shot
backfill from property_details.listing_events for pre-trigger history.
Tax reassessment forecast TX · Resets to sale price
- Current annual tax
- $2,059 · $172/mo
- Projected year-2 tax
- $2,059 · $172/mo
- Expected delta
- $0/yr ($0/mo · 0.0%)
ⓘ Screening estimate from a state-policy table — verify with the county assessor before closing.
Climate risk First Street
- Flood 7/10 Severe FEMA zone AE · 99% chance over 30 yrs
- Wildfire 4/10 Moderate
- Heat 8/10 Severe 7 d/yr ≥110°F today · 20 d/yr by 30 yrs out
- Wind 8/10 Severe 80% chance of damaging wind over 30 yrs
- Air quality 1/10 Low 0 unhealthy d/yr today · 0 by 30 yrs out
Nearby sold comps map
Loading sold comps map…
Walkable amenities ~0.75 mi
Loading nearby amenities…
Taxation est. · year 1
- Rental income
- $17,619
- − Mortgage interest
- −$3,921
- − Property taxes
- −$2,059
- − Insurance
- −$5,468
- − Repairs & maintenance
- −$1,410
- − Management
- −$1,410
- − Depreciation
- −$2,036
- Taxable income
- $1,315
- Est. tax owed @ 24.0%
- −$316
- After-tax cash flow
- $1,671/yr
For passive investors: Depreciation is non-cash, so a rental often shows a tax loss while cash-flowing — sheltering income. Rental losses are passive: they offset passive income freely, and up to $25,000/yr can offset ordinary (W-2) income if you actively participate and your MAGI is under $100k (phasing out to $0 by $150k); unused losses carry forward. On sale, claimed depreciation is recaptured at up to 25%, and gains may owe capital-gains tax (a 1031 exchange can defer both). Figures are a year-1 estimate at your 24.0% rate — not tax advice; consult a CPA.
Schools (NCES district)
- District
- Floresville ISD
- NCES district ID
- 4819350
- Math proficiency
- 32% ▼ -14.00%
- Reading proficiency
- 36% ▼ -5.00%
- Median HH income
- $59,736
- Composite
- 30.44/100
- National rank
- #6234
- State rank
- #504 of 826 in TX
Livability — Floresville
- Score
- 65/100
- State rank
- #681
- US rank
- #12747
Category grades
Schools grade is shown separately in the Schools card above.
Census & demographics
- Census place
- Floresville, TX
- County
- Wilson County · 24,283 people
- City population
- 24,283
- Metro
- San Antonio-New Braunfels, TX
- Population (ZIP)
- 24,283
- Household income
- $88,087
- Rent vs Own
- Severe rent burden
- 400.0
Population outlook (Wilson County) Hauer SSP2
- Today (2025)
- 58,434 people
- By 2030
- 63,912 · +9.4%
- By 2040
- 74,704 · +27.8%
- By 2050
- 85,024 · +45.5%
- By 2075
- 111,025 · +90.0%
- By 2100
- 126,692 · +116.8%
Race, ethnicity, and origin ACS 2023
- Neighborhood character
- Majority Hispanic (51%)
- Race & ethnicity
- Hispanic / Latino 51% White 44% Two or more races 23% Black 2%
- Hispanic origin (detail)
- Mexican 46%
- Common ancestry
- Romanian 6% Italian 1% Lithuanian 1%
- Foreign-born
- 4% · Canada, Vietnam
- Languages at home
- 71% English-only · Spanish 27% Russian/Polish/Slavic 1%
Political lean MEDSL · Wilson
- 2024 margin
- Solid R (+53.7) · D 22.9% · R 76.6%
- 2008→2024 swing
- -19.8pp toward R · 2008: -33.9pp · 2024: -53.7pp
- All cycles
- 2024: R+53.7 2020: R+48.4 2016: R+47.8 2012: R+43.0 2008: R+33.9
Not yet ingested
- Civics
- —
Market trends
- HPI YoY
- ▼ -79.16%
- Current HPI
- 210.9474
- Rent YoY
- —
- Metro
- San Antonio-New Braunfels, TX
- State GDP YoY
- ▲ 3.95%
- F500 in state
- 110
Industry mix (Fortune 500 HQ in TX)
| Industry | F500 HQs | Revenue |
|---|---|---|
| Energy | 16 | $1,198B |
|
||
| Technology | 5 | $198B |
|
||
| Engineering / Construction | 4 | $72B |
|
||
| Energy Services | 3 | $60B |
|
||
| Utilities | 3 | $41B |
|
||
| Healthcare | 2 | $330B |
|
||
Price history
1 event — show timeline
- 2026-05-02 Listed $70,000 LERA
Property tax history
+6.3%/yrLatest (2025): $2,059 · +16.2% YoY. Source: county tax records.
Cash-flow waterfall
monthlySold comps — $/sqft
last 12 mo · ≤1 miLoading sold comps…