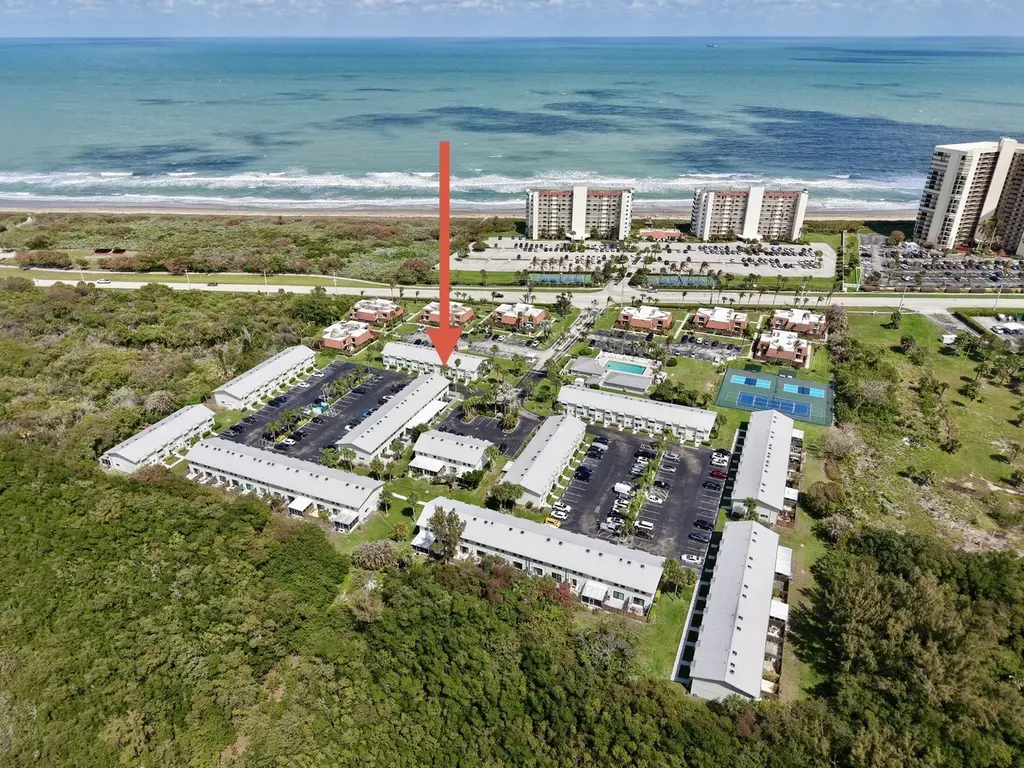
9409 S Ocean Dr #31 · Hutchinson Island South, FL
Flood risk 8/10 · Major
- FEMA flood zone
- X (shaded)
- Chance of flooding over 30 yrs
- 0.96%
- Est. flood insurance / yr
- $507 – $1,088
Fire risk 1/10 · Minimal
- Est. fire insurance / yr
- $947 – $1,759
Heat risk 10/10 · Severe
- Hot days now (above 106°F)
- 7 days/yr
- Hot days in 30 yrs
- 26 days/yr
Wind risk 10/10 · Severe
- Chance of severe wind over 30 yrs
- 99.0%
Air-quality risk 2/10 · Minimal
- Unhealthy air days now
- 1 days/yr
- Unhealthy air days in 30 yrs
- 2 days/yr
Risk factors via First Street. Map © Google.
Why this score? — see what drove the B- grade
The composite is a weighted blend of 9 inputs, each scored 0–100. Each bar is that input's sub-score; the figure is the points it added to the 100-point composite (weight × sub-score).
- Cash flow +24.1/30.0
- ARV discount +15.0/15.0
- 1% rule +7.8/10.0
- DSCR +7.8/10.0
- Schools +3.7/10.0
- Livability +3.1/5.0
- Rent growth +2.8/5.0
- Condition / age +2.5/5.0
- Appreciation +0.0/10.0
$299,000
🖨 Deal sheet 📄 Offer letter ✓ Due diligence
Listing remarks MLS
FABULOUS BEACH AREA COMPLEX! Beautifully Maintained Community across street from BEACH on Hutchinson Island, TENNIS & COMMUNITY POOL are JUST STEPS away. This 2BR/2BA TOWNHOUSE is FRESHLY PAINTED. LOW, LOW PRICE. . GREAT LOCATION!!! PRIVATE FENCED PATIO!GREAT LAYOUT! FULL SIZE WASHER/DRYER - and SHUTTERS TOO!!! THIS COULD BE YOUR LAST CHANCE TO LIVE NEAR THE BEACH AT SUCH A LOW, LOW PRICE!!!! CALL TODAY!!!
Key facts
- $650 HOA
- 2 parking spots
- Community pool
Property features AI
Finance
- Other: Pets allowed with restrictions (breed, number, and size limits)
- Financial info: No land lease
- HOA & community: Community association (Islad Village II); Monthly HOA fee: $650; Association amenities include beach access, clubhouse, heated pool, pool, sauna, tennis courts, pickleball courts, shuffleboard court, recreation facilities, maintained community, sidewalks, street lights, parking, library, internet included; HOA covers cable TV, insurance, internet, grounds and structure maintenance, sewer, trash, water, common areas, legal/accounting, reserve funds, roof repairs, recreation facility, and pool service
Exterior
- Parking: Open parking (2 spaces total)
- Security: Smoke detector(s)
- Utilities: Public water; Public sewer; Cable connected; Electricity connected; Water connected; Sewer connected
- Home design: Townhouse; Two levels; Resale, updated/remodeled condition; Faces west
- Construction: Stucco / CBS (concrete block with stucco) construction; Metal roof; Block foundation; Built as part of a 2-story building
- Exterior features: Open patio; Open porch; Wood fencing; Deeded beach access
Interior
- Kitchen: Disposal; Dishwasher; Electric range; Microwave; Refrigerator
- Bedrooms: No main-level bedrooms
- Flooring: Tile; Vinyl; Wood
- Bathrooms: 1 full bathroom; 1 half bathroom (2 total bathrooms)
- Heating & cooling: Central individual heating; Central individual cooling; Attic fan; Ceiling fan(s); Electric cooling
- Interior features: Kitchen island; Walk-in closet(s); Split bedroom layout
- Laundry & utility: In-unit laundry; Electric water heater
Neighborhood map
What this means for you Summary
Snapshot
- This is a 2-bed/1.5-bath single-family listed at $299k.
Deal economics
- At list price, monthly cash flow is $527 ($6k/yr) — positive.
- The deal already cash-flows at list — no discount required.
- Meets the 1% rule at list price ($4k rent vs $299k).
- Recommended offer: $281k (6.0% below list) — sets the bar for market timing.
- Cap rate 8.7% vs local median 1.9% in Hutchinson Island South — top-decile yield for the area; either an underpriced asset or a hidden risk that comps aren't pricing in. Stress-test before assuming the spread holds.
Location & tenants
- Location reads 61/100 on livability (#783 in FL) — a middle-class / working-renter tenant base. Strengths: crime A+, housing B; Watch: cost of living C-, amenities F, commute F.
- St. Lucie (urban): math 40% / reading 48% proficiency, ranked #51 of 73 in FL (top 70%) — families likely to look elsewhere, expect single-tenant / working-renter base with shorter leases.
- Zoned schools: Mariposa Elementary School (math 51% / reading 50%, grade D+, #1,055 of 2,144 statewide, top 50%, 734 students, 75% FRL); Port St. Lucie High School (math 21% / reading 43%, grade F, #415 of 667 statewide, top 63%, 1,748 students, 67% FRL).
- Market conditions: Rents rising (+1.0%/yr); 536 active listings in the ZIP; 40 comparable units currently listed for rent nearby; rentals at typical pace (median 23d on market — plan ~3-4 weeks tenant-placement turnaround); 4,868 units permitted in St. Lucie County in 2024 (268 in 5+ unit buildings).
- At $3,836/mo this rent would consume 65% of the median local household income ($70k/yr) (locally 946% of renters already pay >50% of income on rent) — very limited rent-growth headroom before tenants either downsize or default.
Forward outlook
- Local home prices are declining (-3.0%/yr); year-one equity from $2k of loan paydown is wiped out by about $9k of value loss. Plan a longer hold.
- St. Lucie County population projected at +20% by 2050 — long-run rental-demand tailwind backs the buy-and-hold thesis.
Negotiation context
- It's been on market 88 days — a 6% lower offer ($281k) is reasonable based on typical stale-listing flexibility.
- 2 sale attempts since 20y ago with the ask held roughly flat each time — persistent listings suggest the price (not the market) is what's stuck; bring a comps-based counter.
- Current owner paid $140k; list at $299k implies a 114% gain — meaningful room to come down on a strong offer.
Risks & watch-outs
- Watch-outs: flood insurance adds $66/mo.
- Climate carrying-cost: severe flood risk; severe wind risk, 99% chance of damaging wind over 30y; extreme-heat days projected 7→26/yr by 2055 (HVAC capex compounding) — expect insurance premiums to compound above CPI over the hold.
Questions for the listing agent
- It's been on market 88 days. Have you received any prior offers? Is the seller open to a 6% concession, seller financing, or rate buy-down credit?
- What's the actual annual flood-insurance premium (NFIP or private), and is the property in a SFHA with mandatory coverage?
- What does the HOA fee cover, when was the last increase, and are there any pending special assessments or reserve-fund shortfalls?
- Why hasn't it sold? Are there any deal-killer items the seller is aware of (foundation, flood, title, zoning, code violations)?
- Is there a deadline driving the sale (1031 exchange, divorce, estate, relocation)? That informs how much negotiation room exists.
- Schools are D-rated, which usually means shorter tenancies and higher turnover. Who's the typical renter profile here, and what's been the actual vacancy rate?
- What's the average days-on-market for RENTAL listings here right now (not sales)? A rising rental-DOM trend means longer vacancies and softer asking-rent achievability than the comps imply.
- What's the recent tenant-quality profile in this submarket — average credit score on applications, eviction rate, late-payment / NSF rate, and stable-employment percentage? A property-management company in the area should have these aggregated.
- How much new for-sale + rental construction is in the pipeline within 1–3 miles? Heavy new supply typically softens prices + rents 12–24 months out; constrained supply supports both.
Investment metrics
- 1% rule
- 1.28% ✓
- Cap rate
- 8.67%
- Cash-on-cash
- 8.50%
- DSCR
- 1.38
- GRM
- 6.5
CMA / ARV
- ARV (on-the-fly)
- $468,630
- Comps found
- 3
Show comp detail 3 sales within ~0.75 mi
| Address | Dist | Beds/Ba | Sqft | Sold | Price | $/sf | Match |
|---|---|---|---|---|---|---|---|
| 709 Nettles Blvd | 0.61mi | 2/1.5 | 1,275 (+0%) | 14mo | $525,000 | $412 | 59 |
| 196 Nettles Blvd | 0.73mi | 2/2.0 | 1,195 (-6%) | 15mo | $419,000 | $351 | 42 |
| 350 Nettles Blvd | 0.65mi | 2/2.0 | 1,450 (+14%) | 14mo | $535,000 | $369 | 32 |
Match score weights: distance 35% · size 25% · config 20% · recency 20%. Top-matched comps best support the ARV.
Projected returns pro-forma
-3.0% appreciation · 1.0% rent growth · sell at horizon
- IRR
- -7.3%
- Equity multiple
- 0.74×
- Total profit
- $-22,159
- Equity at exit
- $44,582
- IRR
- -0.9%
- Equity multiple
- 0.94×
- Total profit
- $-4,623
- Equity at exit
- $25,852
Cash invested: $83,720 (down + closing). Projections, not guarantees.
Landlord ↔ Tenant lean methodology
- Overall (STATE)
- 87 Strongly Landlord-Friendly
- State Florida
- 87 Strongly Landlord-Friendly · R+3
- County
- — inherits STATE
- City
- — inherits STATE
ZIP-level market 34957
- Rents YoY
- 1.0%
- Active inventory
- 536
- Price-to-rent
- 6.5×
Monthly cashflow live
- Estimated rent
- $3,836 high interval (Pro) →
- Mortgage (P&I)
- −$1,568
- Tax from tax record
- −$95 /mo · $1,138/yr
- Insurance
- −$125
- Flood insurance flood zone
- −$66 /mo · $798/yr
- HOA
- −$650
- Vacancy / Maint / Mgmt
- −$806
- Net cashflow
- $527
Break-even live
UW: 25.0% down · 7.5% · 30yr · 1.5% tax · 5.0% vac · 8.0% maint · 8.0% mgmt
Financing live
Cash to close
- Down payment
- $74,750
- Closing costs
- $8,970
- Reserves months
- —
- Total cash needed
- —
Loan-product check · same deal, 3 products live
Conventional
25% down · 7.5% · 30yr
- Down + closing
- —
- Monthly P&I
- —
- Monthly cashflow
- —
- DSCR
- —
- Eligible?
- —
Personal DTI + credit; lowest rate.
DSCR
20% down · 8.5% · 30yr
- Down + closing
- —
- Monthly P&I
- —
- Monthly cashflow
- —
- DSCR
- —
- Eligible?
- —
No personal income docs; deal must DSCR.
Hard money
10% down · 12.0% · 12mo
- Down + closing
- —
- Monthly P&I
- —
- Monthly cashflow
- —
- DSCR
- —
- Eligible?
- —
Short-term bridge; refi at stabilization.
Rent comps 40 comps
| Address | Beds | Baths | Sqft | Rent | $/sqft | DOM | Units | Dist |
|---|---|---|---|---|---|---|---|---|
| 9403 S Ocean Dr Unit 3D Jensen Beach, FL | 2.0 | 2.0 | 1328 | $1,800 | $1.36 | 23d | 1 | 0.04mi |
| 9425 S Ocean Dr #67 Jensen Beach, FL | 2.0 | 1.5 | 1270 | $2,400 | $1.89 | 21d | 1 | 0.07mi |
| 9400 S Ocean Dr Unit 706B Jensen Beach, FL | 2.0 | 2.0 | 1053 | $3,500 | $3.32 | 23d | 1 | 0.13mi |
| 9400 S Ocean Dr Unit 608B Jensen Beach, FL | 2.0 | 2.0 | 1112 | $6,500 | $5.85 | 23d | 1 | 0.13mi |
| 9400 S Ocean Dr #307 Jensen Beach, FL | 2.0 | 2.0 | 1053 | $2,500 | $2.37 | 23d | 1 | 0.13mi |
| 9400 S Ocean Dr #707 Jensen Beach, FL | 2.0 | 2.0 | 1053 | $3,000 | $2.85 | 23d | 1 | 0.13mi |
| 9400 S Ocean Dr #202 Jensen Beach, FL | 2.0 | 2.0 | 1053 | $5,600 | $5.32 | 23d | 1 | 0.13mi |
| 9400 S Ocean Dr Unit 604B Jensen Beach, FL | 2.0 | 2.0 | 1053 | $5,400 | $5.13 | 23d | 1 | 0.14mi |
| 9400 S Ocean Dr Unit 504B Jensen Beach, FL | 2.0 | 2.0 | 1053 | $2,400 | $2.28 | 23d | 1 | 0.14mi |
| 9400 S Ocean Dr Unit 1003B Jensen Beach, FL | 2.0 | 2.0 | 1053 | $2,700 | $2.56 | 23d | 1 | 0.14mi |
| 9490 S Ocean Dr Unit 113 A Jensen Beach, FL | 2.0 | 2.0 | 1053 | $4,200 | $3.99 | 23d | 1 | 0.16mi |
| 9490 S Ocean Dr #611 Jensen Beach, FL | 2.0 | 2.0 | 1053 | $2,750 | $2.61 | 13d | 1 | 0.18mi |
| 9490 S Ocean Dr #213 Jensen Beach, FL | 2.0 | 2.0 | 1053 | $2,600 | $2.47 | 23d | 1 | 0.18mi |
| 9490 S Ocean Dr Unit 912-A Jensen Beach, FL | 2.0 | 2.0 | 1053 | $3,200 | $3.04 | 23d | 1 | 0.18mi |
| 9490 S Ocean Dr Unit 615A Jensen Beach, FL | 2.0 | 2.0 | 1100 | $2,900 | $2.64 | 23d | 1 | 0.18mi |
| 9500 S Ocean Dr #9 Jensen Beach, FL | 2.0 | 2.0 | 1228 | $4,950 | $4.03 | 23d | 1 | 0.22mi |
| 9500 S Ocean Dr #201 Jensen Beach, FL | 2.0 | 2.0 | 1437 | $5,400 | $3.76 | 23d | 1 | 0.22mi |
| 9500 S Ocean Dr #1307 Jensen Beach, FL | 2.0 | 2.0 | 1228 | $3,000 | $2.44 | 13d | 1 | 0.22mi |
| 9500 S Ocean Dr #10 Jensen Beach, FL | 2.0 | 2.0 | 1437 | $4,000 | $2.78 | 23d | 1 | 0.22mi |
| 9500 S Ocean Dr #809 Jensen Beach, FL | 2.0 | 2.0 | 1228 | $5,500 | $4.48 | 23d | 1 | 0.22mi |
| 9500 S Ocean Dr #1310 Jensen Beach, FL | 2.0 | 2.0 | 1437 | $6,000 | $4.18 | 23d | 1 | 0.22mi |
| 9500 S Ocean Dr Unit 9500PH10 Jensen Beach, FL | 2.0 | 2.0 | 1437 | $6,500 | $4.52 | 23d | 1 | 0.22mi |
| 9500 S Ocean Dr #1308 Jensen Beach, FL | 2.0 | 2.0 | 1224 | $3,100 | $2.53 | 23d | 1 | 0.22mi |
| 9550 S Ocean Dr #4 Jensen Beach, FL | 2.0 | 2.0 | 1228 | $6,500 | $5.29 | 13d | 1 | 0.29mi |
| 9550 S Ocean Dr #705 Jensen Beach, FL | 3.0 | 2.0 | 1544 | $7,000 | $4.53 | 23d | 1 | 0.29mi |
| 9550 S Ocean Dr #4 Jensen Beach, FL | 2.0 | 2.0 | 1228 | $6,500 | $5.29 | 23d | 1 | 0.29mi |
| 9600 S Ocean Dr Jensen Beach, FL | 2.0–4.0 | 2.0–3.5 | 2051 | $2,500 | $1.22 | 23d | 3 | 0.38mi |
| 8880 S Ocean Dr #1102 Jensen Beach, FL | 1.0 | 2.0 | 1011 | $5,200 | $5.14 | 23d | 1 | 0.45mi |
| 8800 S Ocean Dr #102 Jensen Beach, FL | 2.0 | 2.0 | 1228 | $3,200 | $2.61 | 23d | 1 | 0.56mi |
| 8800 S Ocean Dr #1201 Jensen Beach, FL | 3.0 | 2.0 | 1587 | $6,500 | $4.10 | 23d | 1 | 0.56mi |
| 8800 S Ocean Dr #806 Jensen Beach, FL | 3.0 | 2.0 | 1485 | $6,000 | $4.04 | 23d | 1 | 0.56mi |
| 9900 S Ocean Dr Jensen Beach, FL | 1.0–2.0 | 2.0 | 1009 | $3,500 | $3.47 | 23d | 5 | 0.66mi |
| 1333 Nettles Blvd Unit 1546511P Jensen Beach, FL | 2.0 | 2.0 | 1797 | $3,122 | $1.74 | 13d | 1 | 0.68mi |
| 8750 S Ocean Dr #1134 Jensen Beach, FL | 2.0 | 2.0 | 1377 | $6,000 | $4.36 | 21d | 1 | 0.68mi |
| 9940 S Ocean Dr Jensen Beach, FL | 1.0–2.0 | 1.5–2.0 | 1009 | $3,500 | $3.47 | 13d | 5 | 0.76mi |
| 9950 S Ocean Dr #4 Jensen Beach, FL | 2.0 | 2.0 | 1411 | $3,500 | $2.48 | 23d | 1 | 0.84mi |
| 9960 S Ocean Dr #5 Jensen Beach, FL | 2.0 | 2.0 | 1703 | $5,000 | $2.94 | 23d | 1 | 0.86mi |
| 9960 S Ocean Dr #502 Jensen Beach, FL | 2.0 | 2.0 | 1434 | $3,000 | $2.09 | 23d | 1 | 0.90mi |
| 10000 S Ocean Dr #206 Jensen Beach, FL | 2.0 | 2.0 | 1264 | $5,100 | $4.03 | 23d | 1 | 0.97mi |
| 10044 S Ocean Dr Jensen Beach, FL | 2.0–3.0 | 2.0 | 1305 | $2,500 | $1.91 | 23d | 6 | 1.05mi |
HOA detail
- Monthly dues
- $650 · $7,800/yr
- Likely covers
- pool
Listing history 20 events
-
2026-06-18days on market $299,000 Active 88 DOM
-
2026-06-17days on market $299,000 Active 87 DOM
-
2026-06-16days on market $299,000 Active 86 DOM
-
2026-06-15days on market $299,000 Active 85 DOM
-
2026-06-14days on market $299,000 Active 83 DOM
-
2026-06-13days on market $299,000 Active 82 DOM
-
2026-06-10days on market $299,000 Active 80 DOM
-
2026-06-09days on market $299,000 Active 79 DOM
-
2026-06-08days on market $299,000 Active 78 DOM
-
2026-06-07days on market $299,000 Active 77 DOM
-
2026-06-05days on market $299,000 Active 74 DOM
-
2026-06-03days on market $299,000 Active 73 DOM
-
2026-06-02days on market $299,000 Active 72 DOM
-
2026-06-01days on market $299,000 Active 71 DOM
-
2026-05-31days on market $299,000 Active 70 DOM
-
2026-05-30days on market $299,000 Active 69 DOM
-
2026-03-22$299,000 Active
-
2007-08-08soldstatus $140,000 420-char remark
Show marketing remark (420 chars)
FABULOUS BEACH AREA COMPLEX! Beautifully Maintained Community across street from BEACH on Hutchinson Island, TENNIS & COMMUNITY POOL are JUST STEPS away. This 2BR/2BA TOWNHOUSE is FRESHLY PAINTED. LOW, LOW PRICE. . GREAT LOCATION!!! PRIVATE FENCED PATIO!GREAT LAYOUT! FULL SIZE WASHER/DRYER - and SHUTTERS TOO!!! THIS COULD BE YOUR LAST CHANCE TO LIVE NEAR THE BEACH AT SUCH A LOW, LOW PRICE!!!! CALL TODAY!!!
-
2007-08-08price $159,000 420-char remark
Show marketing remark (420 chars)
FABULOUS BEACH AREA COMPLEX! Beautifully Maintained Community across street from BEACH on Hutchinson Island, TENNIS & COMMUNITY POOL are JUST STEPS away. This 2BR/2BA TOWNHOUSE is FRESHLY PAINTED. LOW, LOW PRICE. . GREAT LOCATION!!! PRIVATE FENCED PATIO!GREAT LAYOUT! FULL SIZE WASHER/DRYER - and SHUTTERS TOO!!! THIS COULD BE YOUR LAST CHANCE TO LIVE NEAR THE BEACH AT SUCH A LOW, LOW PRICE!!!! CALL TODAY!!!
-
2006-04-28$140,000 420-char remark
Show marketing remark (420 chars)
FABULOUS BEACH AREA COMPLEX! Beautifully Maintained Community across street from BEACH on Hutchinson Island, TENNIS & COMMUNITY POOL are JUST STEPS away. This 2BR/2BA TOWNHOUSE is FRESHLY PAINTED. LOW, LOW PRICE. . GREAT LOCATION!!! PRIVATE FENCED PATIO!GREAT LAYOUT! FULL SIZE WASHER/DRYER - and SHUTTERS TOO!!! THIS COULD BE YOUR LAST CHANCE TO LIVE NEAR THE BEACH AT SUCH A LOW, LOW PRICE!!!! CALL TODAY!!!
ⓘ Source: listings_history table (triggers on properties + properties_extension) + one-shot
backfill from property_details.listing_events for pre-trigger history.
Tax reassessment forecast FL · Resets to sale price
- Current annual tax
- $1,138 · $95/mo
- Projected year-2 tax
- $2,482 · $207/mo
- Expected delta
- +$1,344/yr (+$112/mo · 118.2%)
ⓘ Screening estimate from a state-policy table — verify with the county assessor before closing.
Climate risk First Street
- Flood 8/10 Severe FEMA zone X (shaded) · 96% chance over 30 yrs
- Wildfire 1/10 Low
- Heat 10/10 Extreme 7 d/yr ≥106°F today · 26 d/yr by 30 yrs out
- Wind 10/10 Extreme 99% chance of damaging wind over 30 yrs
- Air quality 2/10 Low 1 unhealthy d/yr today · 2 by 30 yrs out
Nearby sold comps map
Loading sold comps map…
Walkable amenities ~0.75 mi
Loading nearby amenities…
Taxation est. · year 1
- Rental income
- $46,030
- − Mortgage interest
- −$16,749
- − Property taxes
- −$1,138
- − Insurance
- −$2,292
- − Repairs & maintenance
- −$3,682
- − Management
- −$3,682
- − HOA
- −$7,800
- − Depreciation
- −$8,698
- Taxable income
- $1,989
- Est. tax owed @ 24.0%
- −$477
- After-tax cash flow
- $5,841/yr
For passive investors: Depreciation is non-cash, so a rental often shows a tax loss while cash-flowing — sheltering income. Rental losses are passive: they offset passive income freely, and up to $25,000/yr can offset ordinary (W-2) income if you actively participate and your MAGI is under $100k (phasing out to $0 by $150k); unused losses carry forward. On sale, claimed depreciation is recaptured at up to 25%, and gains may owe capital-gains tax (a 1031 exchange can defer both). Figures are a year-1 estimate at your 24.0% rate — not tax advice; consult a CPA.
Schools (NCES district)
- District
- St. Lucie
- NCES district ID
- 1201770
- Math proficiency
- 40% ▼ -11.00%
- Reading proficiency
- 48% ▼ -4.00%
- Median HH income
- $44,737
- Composite
- 37.28/100
- National rank
- #4449
- State rank
- #51 of 73 in FL
Livability — Hutchinson Island South
- Score
- 61/100
- State rank
- #783
- US rank
- #17768
Category grades
Schools grade is shown separately in the Schools card above.
Census & demographics
- Census place
- Hutchinson Island South, FL
- County
- Martin County · 165,223 people
- Metro
- Port St. Lucie, FL
- Population (ZIP)
- 23,462
- Household income
- $70,403
- Rent vs Own
- Severe rent burden
- 946.0
Population outlook (St. Lucie County) Hauer SSP2
- Today (2025)
- 338,016 people
- By 2030
- 355,687 · +5.2%
- By 2040
- 385,521 · +14.1%
- By 2050
- 406,106 · +20.1%
- By 2075
- 441,054 · +30.5%
- By 2100
- 436,885 · +29.2%
Race, ethnicity, and origin ACS 2023
- Neighborhood character
- Predominantly White (85%)
- Race & ethnicity
- White 85% Hispanic / Latino 7% Two or more races 6% Asian 2% Black 2%
- Hispanic origin (detail)
- Mexican 1% Puerto Rican 2% Cuban 1%
- Common ancestry
- Romanian 4% Slovak 3% Lithuanian 3%
- Foreign-born
- 10% · Canada, Jamaica
- Languages at home
- 90% English-only · Spanish 5% Other Indo-European 2% Tagalog/Filipino 1%
Political lean MEDSL · St. Lucie
- 2024 margin
- Lean R (+9.1) · D 45.1% · R 54.2%
- 2008→2024 swing
- -21.2pp toward R · 2008: 12.1pp · 2024: -9.1pp
- All cycles
- 2024: R+9.1 2020: R+1.6 2016: R+2.5 2012: D+7.9 2008: D+12.1
Not yet ingested
- Civics
- —
Market trends
- HPI YoY
- ▼ -319.66%
- Current HPI
- 340.0172
- Rent YoY
- ▲ 1.00%
- Metro
- Port St. Lucie, FL
- State GDP YoY
- ▲ 3.28%
- F500 in state
- 36
Industry mix (Fortune 500 HQ in FL)
| Industry | F500 HQs | Revenue |
|---|---|---|
| Industrial Technology | 2 | $29B |
|
||
| Insurance | 2 | $17B |
|
||
| Retail | 1 | $60B |
|
||
| Technology Distribution | 1 | $58B |
|
||
| Homebuilding | 1 | $35B |
|
||
| Technology Manufacturing | 1 | $35B |
|
||
Price history
+113.6% since first listed4 events — show timeline
- 2026-03-22 Listed $299,000 Beaches MLS
- 2007-08-08 Price Changed $159,000 MCRTC
- 2007-08-08 Sold (MLS) $140,000 MCRTC
- 2006-04-28 Listed $140,000 MCRTC
Property tax history
+3.5%/yrLatest (2025): $1,138 · +4.4% YoY. Source: county tax records.
Cash-flow waterfall
monthlySold comps — $/sqft
last 12 mo · ≤1 miLoading sold comps…