909 Ives Creek Rd · Bellville, TX
Flood risk 1/10 · Minimal
- FEMA flood zone
- X (unshaded)
- Chance of flooding over 30 yrs
- 0.0%
- Est. flood insurance / yr
- $507 – $1,088
Fire risk 4/10 · Minor
- Est. fire insurance / yr
- $1,222 – $2,270
Heat risk 8/10 · Major
- Hot days now (above 111°F)
- 7 days/yr
- Hot days in 30 yrs
- 22 days/yr
Wind risk 8/10 · Major
- Chance of severe wind over 30 yrs
- 99.0%
Air-quality risk 1/10 · Minimal
- Unhealthy air days now
- 0 days/yr
- Unhealthy air days in 30 yrs
- 0 days/yr
Risk factors via First Street. Map © Google.
Why this score? — see what drove the D- grade
The composite is a weighted blend of 9 inputs, each scored 0–100. Each bar is that input's sub-score; the figure is the points it added to the 100-point composite (weight × sub-score).
- ARV discount +15.0/15.0
- Cash flow +7.9/30.0
- Schools +3.4/10.0
- Livability +3.2/5.0
- Rent growth +2.5/5.0
- Condition / age +2.5/5.0
- DSCR +2.0/10.0
- 1% rule +1.9/10.0
- Appreciation +0.0/10.0
$214,990
🖨 Deal sheet (PDF) 📄 Offer letter ✓ Due diligence
Listing remarks MLS
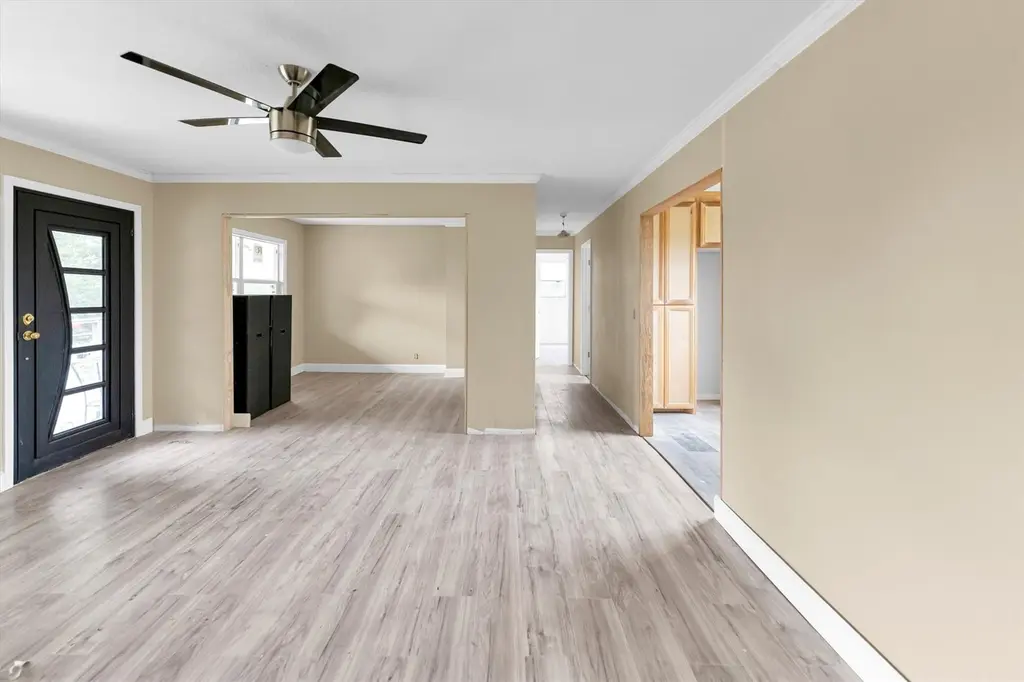
Endless possibilities await at this 3 bed, 2 bath home on 2 acres in Austin County. With unlimited potential, this property is perfect for a new owner seeking country living. Situated between Brenham and Bellville, with easy access to Hempstead, Sealy, and Katy. Featuring a private well and septic, this unrestricted land is ideal for a second home or more. Don't miss out on this unique opportunity!
Key facts
- Easy access
- Private well
- Unrestricted land
Tags
Neighborhood map
What this means for you Summary
Snapshot
- This is a 3-bed/2.0-bath single-family listed at $215k.
Deal economics
- At list price, monthly cash flow is $-231 ($-3k/yr) — negative.
- To cash-flow at today's rent, offer at most $174k (19.0% below list).
- To meet the 1% rule (rent ≥ 1% of price), the offer needs to be $148k (31.0% below list).
- Recommended offer: $148k (31.0% below list) — sets the bar for 1% rule.
- Cap rate 5.0% vs local median 1.5% in Bellville — top-decile yield for the area; either an underpriced asset or a hidden risk that comps aren't pricing in. Stress-test before assuming the spread holds.
Location & tenants
- Location reads 65/100 on livability (#676 in TX) — a middle-class / working-renter tenant base. Strengths: cost of living A+, housing A+; Watch: amenities F, commute F, employment D-.
- Bellville ISD (town): math 35% / reading 44% proficiency, ranked #407 of 826 in TX (top 49%) — families likely to look elsewhere, expect single-tenant / working-renter base with shorter leases.
- Market conditions: 182 active listings in the ZIP; 410 units permitted in Austin County in 2024 (0 in 5+ unit buildings).
Forward outlook
- Local home prices are declining (-3.0%/yr); year-one equity from $1k of loan paydown is wiped out by about $6k of value loss. Plan a longer hold.
- Austin County population projected at +18% by 2050 — long-run rental-demand tailwind backs the buy-and-hold thesis.
Negotiation context
- It's been on market 191 days — a 12% lower offer ($189k) is reasonable based on typical stale-listing flexibility.
- 2 sale attempts with the ask held roughly flat each time — persistent listings suggest the price (not the market) is what's stuck; bring a comps-based counter.
Risks & watch-outs
- Climate carrying-cost: severe wind risk, 99% chance of damaging wind over 30y; extreme-heat days projected 7→22/yr by 2055 (HVAC capex compounding) — expect insurance premiums to compound above CPI over the hold.
Questions for the listing agent
- What do current leases actually rent for vs. the listed asking? Can we see a recent rent roll and the last 12 months of T-12 income?
- It's been on market 191 days. Have you received any prior offers? Is the seller open to a 31% concession, seller financing, or rate buy-down credit?
- Why hasn't it sold? Are there any deal-killer items the seller is aware of (foundation, flood, title, zoning, code violations)?
- Is there a deadline driving the sale (1031 exchange, divorce, estate, relocation)? That informs how much negotiation room exists.
- The area grade is low — what's the realistic commute time and amenity access for the typical tenant pool here? Any planned neighborhood developments (good or bad) we should know about?
- What's the average days-on-market for RENTAL listings here right now (not sales)? A rising rental-DOM trend means longer vacancies and softer asking-rent achievability than the comps imply.
- What's the recent tenant-quality profile in this submarket — average credit score on applications, eviction rate, late-payment / NSF rate, and stable-employment percentage? A property-management company in the area should have these aggregated.
- How much new for-sale + rental construction is in the pipeline within 1–3 miles? Heavy new supply typically softens prices + rents 12–24 months out; constrained supply supports both.
Investment metrics
- 1% rule
- 0.69% ✗
- Cap rate
- 5.00%
- Cash-on-cash
- -4.61%
- DSCR
- 0.80
- GRM
- 12.1
CMA / ARV
- ARV (median comp)
- $333,696
- List price
- $214,990
- Delta
- -35.57%
- Verdict
- UNDERPRICED
- Comps
- 1 within 2.0 mi
Projected returns pro-forma
-3.0% appreciation · 3.0% rent growth · sell at horizon
- IRR
- -24.1%
- Equity multiple
- 0.18×
- Total profit
- $-49,582
- Equity at exit
- $32,056
- IRR
- -19.4%
- Equity multiple
- -0.03×
- Total profit
- $-62,240
- Equity at exit
- $18,588
Cash invested: $60,197 (down + closing). Projections, not guarantees.
Landlord ↔ Tenant lean methodology
- Overall (STATE)
- 87 Strongly Landlord-Friendly
- State Texas
- 87 Strongly Landlord-Friendly · R+5
- County
- — inherits STATE
- City
- — inherits STATE
ZIP-level market 77418
- Active inventory
- 182
- Price-to-rent
- 12.1×
Monthly cashflow live
- Estimated rent
- $1,484 medium interval (Pro) →
- Mortgage (P&I)
- −$1,127
- Tax from tax record
- −$187 /mo · $2,238/yr
- Insurance
- −$90
- HOA
- −$0
- Vacancy / Maint / Mgmt
- −$312
- Net cashflow
- $-231
Break-even live
Sensitivity live
| Price | -10% $-109 | -5% $-170 | +0% $-231 | +5% $-292 | +10% $-353 |
|---|---|---|---|---|---|
| Rent | -10% $-348 | -5% $-290 | +0% $-231 | +5% $-172 | +10% $-114 |
| Rate | -1.0pp $-123 | -0.5pp $-176 | base $-231 | +0.5pp $-287 | +1.0pp $-343 |
UW: 25.0% down · 7.5% · 30yr · 1.5% tax · 5.0% vac · 8.0% maint · 8.0% mgmt
Financing live
Cash to close
- Down payment
- $53,748
- Closing costs
- $6,450
- Reserves months
- —
- Total cash needed
- —
Loan-product check · same deal, 3 products live
Conventional
25% down · 7.5% · 30yr
- Down + closing
- —
- Monthly P&I
- —
- Monthly cashflow
- —
- DSCR
- —
- Eligible?
- —
Personal DTI + credit; lowest rate.
DSCR
20% down · 8.5% · 30yr
- Down + closing
- —
- Monthly P&I
- —
- Monthly cashflow
- —
- DSCR
- —
- Eligible?
- —
No personal income docs; deal must DSCR.
Hard money
10% down · 12.0% · 12mo
- Down + closing
- —
- Monthly P&I
- —
- Monthly cashflow
- —
- DSCR
- —
- Eligible?
- —
Short-term bridge; refi at stabilization.
Listing history 18 events
-
2026-06-19days on market $214,990 Active 191 DOM
-
2026-06-18days on market $214,990 Active 190 DOM
-
2026-06-17days on market $214,990 Active 189 DOM
-
2026-06-16days on market $214,990 Active 188 DOM
-
2026-06-15days on market $214,990 Active 187 DOM
-
2026-06-14days on market $214,990 Active 185 DOM
-
2026-06-12days on market $214,990 Active 184 DOM
-
2026-06-07days on market $214,990 Active 181 DOM
-
2026-06-03days on market $214,990 Active 177 DOM
-
2026-06-02days on market $214,990 Active 176 DOM
-
2026-06-01days on market $214,990 Active 175 DOM
-
2026-05-31days on market $214,990 Active 174 DOM
-
2026-05-30days on market $214,990 Active 173 DOM
-
2025-12-08$214,990 Active 401-char remark
Show marketing remark (401 chars)
Endless possibilities await at this 3 bed, 2 bath home on 2 acres in Austin County. With unlimited potential, this property is perfect for a new owner seeking country living. Situated between Brenham and Bellville, with easy access to Hempstead, Sealy, and Katy. Featuring a private well and septic, this unrestricted land is ideal for a second home or more. Don't miss out on this unique opportunity!
-
2025-08-31historical
-
2025-07-01price $215,000
-
2025-03-20price $225,000
-
2025-01-23$230,000 Active
ⓘ Source: listings_history table (triggers on properties + properties_extension) + one-shot
backfill from property_details.listing_events for pre-trigger history.
Tax reassessment forecast TX · Resets to sale price
- Current annual tax
- $2,238 · $187/mo
- Projected year-2 tax
- $3,934 · $328/mo
- Expected delta
- +$1,696/yr (+$141/mo · 75.8%)
ⓘ Screening estimate from a state-policy table — verify with the county assessor before closing.
Climate risk First Street
- Flood 1/10 Low FEMA zone X (unshaded) · 0% chance over 30 yrs
- Wildfire 4/10 Moderate
- Heat 8/10 Severe 7 d/yr ≥111°F today · 22 d/yr by 30 yrs out
- Wind 8/10 Severe 99% chance of damaging wind over 30 yrs
- Air quality 1/10 Low 0 unhealthy d/yr today · 0 by 30 yrs out
Nearby sold comps map
Loading sold comps map…
Walkable amenities ~0.75 mi
Loading nearby amenities…
Taxation est. · year 1
- Rental income
- $17,809
- − Mortgage interest
- −$12,043
- − Property taxes
- −$2,238
- − Insurance
- −$1,075
- − Repairs & maintenance
- −$1,425
- − Management
- −$1,425
- − Depreciation
- −$6,254
- Taxable loss
- −$6,650
- Est. tax savings @ 24.0%
- +$1,596
- After-tax cash flow
- $-1,177/yr
For passive investors: Depreciation is non-cash, so a rental often shows a tax loss while cash-flowing — sheltering income. Rental losses are passive: they offset passive income freely, and up to $25,000/yr can offset ordinary (W-2) income if you actively participate and your MAGI is under $100k (phasing out to $0 by $150k); unused losses carry forward. On sale, claimed depreciation is recaptured at up to 25%, and gains may owe capital-gains tax (a 1031 exchange can defer both). Figures are a year-1 estimate at your 24.0% rate — not tax advice; consult a CPA.
Schools (NCES district)
- District
- Bellville ISD
- NCES district ID
- 4809810
- Math proficiency
- 35% ▼ -13.00%
- Reading proficiency
- 44% ▼ -6.00%
- Median HH income
- $53,064
- Composite
- 34.34/100
- National rank
- #5228
- State rank
- #407 of 826 in TX
Livability — Bellville
- Score
- 65/100
- State rank
- #676
- US rank
- #12694
Category grades
Schools grade is shown separately in the Schools card above.
Census & demographics
- Population (ZIP)
- 10,467
Population outlook (Austin County) Hauer SSP2
- Today (2025)
- 32,206 people
- By 2030
- 33,459 · +3.9%
- By 2040
- 35,809 · +11.2%
- By 2050
- 37,933 · +17.8%
- By 2075
- 44,179 · +37.2%
- By 2100
- 47,870 · +48.6%
Race, ethnicity, and origin ACS 2023
- Neighborhood character
- Predominantly White (68%)
- Race & ethnicity
- White 68% Hispanic / Latino 22% Black 8% Two or more races 2%
- Hispanic origin (detail)
- Mexican 20%
- Common ancestry
- Italian 3% Romanian 3% Slovak 2%
- Foreign-born
- 9% · Canada
- Languages at home
- 82% English-only · Spanish 16% Other Indo-European 1% French/Haitian/Cajun 1%
Political lean MEDSL · Austin
- 2024 margin
- Solid R (+62.7) · D 18.3% · R 81.0%
- 2008→2024 swing
- -11.8pp toward R · 2008: -50.9pp · 2024: -62.7pp
- All cycles
- 2024: R+62.7 2020: R+58.4 2016: R+59.7 2012: R+60.3 2008: R+50.9
Not yet ingested
- Civics
- —
Market trends
- HPI YoY
- ▼ -153.20%
- Current HPI
- 196.2441
- Rent YoY
- —
- Metro
- —
- State GDP YoY
- ▲ 3.95%
- F500 in state
- 110
Industry mix (Fortune 500 HQ in TX)
| Industry | F500 HQs | Revenue |
|---|---|---|
| Energy | 16 | $1,198B |
|
||
| Technology | 5 | $198B |
|
||
| Engineering / Construction | 4 | $72B |
|
||
| Energy Services | 3 | $60B |
|
||
| Utilities | 3 | $41B |
|
||
| Healthcare | 2 | $330B |
|
||
Price history
-6.5% since first listed5 events — show timeline
- 2025-12-08 Listed $214,990 HARMLS
- 2025-08-31 Listing Removed — HARMLS
- 2025-07-01 Price Changed $215,000 HARMLS
- 2025-03-20 Price Changed $225,000 HARMLS
- 2025-01-23 Listed $230,000 HARMLS
Property tax history
+25.2%/yrLatest (2025): $2,238 · +10.8% YoY. Source: county tax records.
Cash-flow waterfall
monthlySold comps — $/sqft
last 12 mo · ≤1 miLoading sold comps…