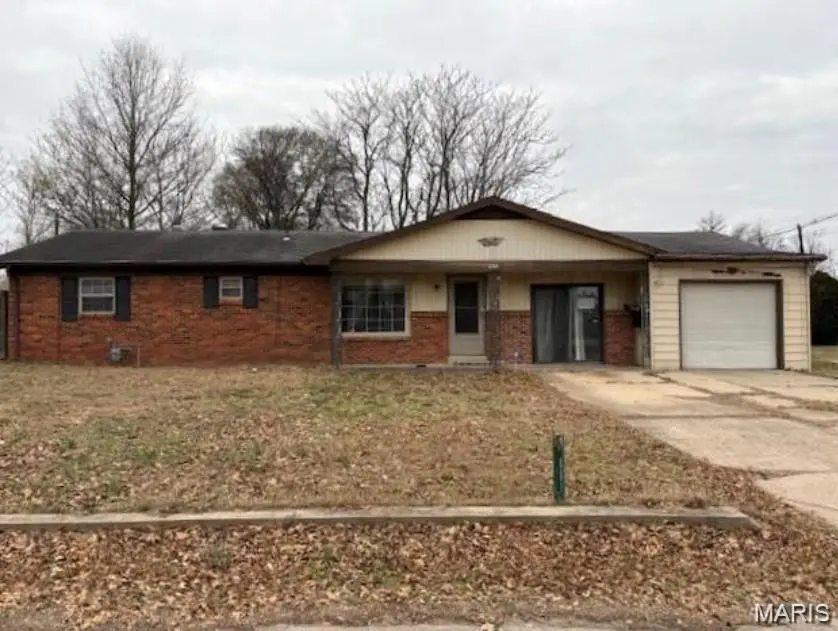
601 S Hopper St · Kennett, MO
Flood risk 1/10 · Minimal
- FEMA flood zone
- X
- Chance of flooding over 30 yrs
- 0.0%
- Est. flood insurance / yr
- $473 – $860
Fire risk 1/10 · Minimal
- Est. fire insurance / yr
- $1,054 – $1,958
Heat risk 6/10 · Moderate
- Hot days now (above 110°F)
- 7 days/yr
- Hot days in 30 yrs
- 20 days/yr
Wind risk 4/10 · Minor
- Chance of severe wind over 30 yrs
- 8.0%
Air-quality risk 1/10 · Minimal
- Unhealthy air days now
- 0 days/yr
- Unhealthy air days in 30 yrs
- 0 days/yr
Risk factors via First Street. Map © Google.
Why this score? — see what drove the B+ grade
The composite is a weighted blend of 9 inputs, each scored 0–100. Each bar is that input's sub-score; the figure is the points it added to the 100-point composite (weight × sub-score).
- Cash flow +30.0/30.0
- ARV discount +15.0/15.0
- 1% rule +10.0/10.0
- DSCR +10.0/10.0
- Livability +3.0/5.0
- Schools +2.6/10.0
- Rent growth +2.5/5.0
- Condition / age +2.5/5.0
- Appreciation +0.0/10.0
$59,900
🖨 Deal sheet (PDF) 📄 Offer letter ✓ Due diligence
Listing remarks
Just listed! 3 beds/1.5 bath home with large living room, kitchen/dining room and laundry room. Spacious home that`s ready for new owners!
Key facts
- 8,799 sq ft lot
- Garage
- Built 1973
Property features AI
Finance
- Other: No additional financial amenities provided
- Financial info: No financial details provided beyond tax info
Exterior
- Parking: Has garage
- Security: No security details provided
- Utilities: Public water; Public sewer; Single phase electric service; Cable available; Electricity available
- Home design: Single-family residence; One story
- Construction: Brick and vinyl siding construction; Assessor-reported living area above grade
- Exterior features: City lot
Interior
- Kitchen: No kitchen appliance details provided
- Bedrooms: 3 bedrooms (all on the main level)
- Flooring: No flooring details provided
- Bathrooms: 1 full bathroom; 1 half bathroom
- Heating & cooling: Electric heating; Central air
- Interior features: Central air conditioning; Electric heating
- Laundry & utility: No laundry details provided
Neighborhood map
What this means for you Summary
Snapshot
- This is a 3-bed/1.5-bath other listed at $60k.
Deal economics
- At list price, monthly cash flow is $520 ($6k/yr) — positive.
- The deal already cash-flows at list — no discount required.
- Meets the 1% rule at list price ($1k rent vs $60k).
- Recommended offer: $58k (3.0% below list) — sets the bar for market timing.
- Cap rate 16.7% vs local median 6.5% in Kennett — top-decile yield for the area; either an underpriced asset or a hidden risk that comps aren't pricing in. Stress-test before assuming the spread holds.
Location & tenants
- Location reads 59/100 on livability (#561 in MO) — a working-class tenant base; expect higher turnover. Strengths: cost of living A+, housing A; Watch: health & safety C-, crime F, amenities F.
- Kennett 39 (town): math 28% / reading 36% proficiency, ranked #262 of 324 in MO (top 81%) — families likely to look elsewhere, expect single-tenant / working-renter base with shorter leases; 67% free/reduced lunch — lower-income household profile, screen leases tightly.
- Zoned schools: H. Byron Masterson Elem. (451 students, 99% FRL); Kennett Middle (math 21% / reading 28%, grade F, #324 of 391 statewide, top 83%, 417 students, 99% FRL); Kennett High (math 27% / reading 52%, grade F, #247 of 521 statewide, top 55%, 497 students, 99% FRL) — zoned schools average 99% FRL vs 67% district-wide (33 pts higher); higher-poverty schools than district average — tighter screening recommended.
- Market conditions: 59 active listings in the ZIP; 30 units permitted in Dunklin County in 2024 (0 in 5+ unit buildings).
Forward outlook
- Local home prices are declining (-3.0%/yr); year-one equity from $414 of loan paydown is wiped out by about $2k of value loss. Plan a longer hold.
- Dunklin County population projected at -22% by 2050 — secular population decline; favor cash flow + early exit over multi-decade hold.
- At projected returns (-3.0% appreciation + 3.0% rent growth), your $17k cash investment doubles in ~4 years — after that, you're playing with house money.
Negotiation context
- It's been on market 44 days — a 3% lower offer ($58k) is reasonable based on typical stale-listing flexibility.
- 2 sale attempts with the ask held roughly flat each time — persistent listings suggest the price (not the market) is what's stuck; bring a comps-based counter.
Risks & watch-outs
- Climate carrying-cost: extreme-heat days projected 7→20/yr by 2055 (HVAC capex compounding) — expect insurance premiums to compound above CPI over the hold.
Questions for the listing agent
- It's been on market 44 days. Have you received any prior offers? Is the seller open to a 3% concession, seller financing, or rate buy-down credit?
- Built in 1973 — when were the roof, HVAC, electrical panel, plumbing, and water heater last replaced?
- Is there a deadline driving the sale (1031 exchange, divorce, estate, relocation)? That informs how much negotiation room exists.
- Schools are D-rated, which usually means shorter tenancies and higher turnover. Who's the typical renter profile here, and what's been the actual vacancy rate?
- Crime grade is F in this area — have there been break-ins, vandalism, or insurance claims at this property in the last 3 years? What carrier currently insures it and at what premium?
- What's the average days-on-market for RENTAL listings here right now (not sales)? A rising rental-DOM trend means longer vacancies and softer asking-rent achievability than the comps imply.
- What's the recent tenant-quality profile in this submarket — average credit score on applications, eviction rate, late-payment / NSF rate, and stable-employment percentage? A property-management company in the area should have these aggregated.
- How much new for-sale + rental construction is in the pipeline within 1–3 miles? Heavy new supply typically softens prices + rents 12–24 months out; constrained supply supports both.
Investment metrics
- 1% rule
- 1.93% ✓
- Cap rate
- 16.71%
- Cash-on-cash
- 37.21%
- DSCR
- 2.66
- GRM
- 4.3
CMA / ARV
- ARV (median comp)
- $77,368
- List price
- $59,900
- Delta
- -22.58%
- Verdict
- UNDERPRICED
- Comps
- 20 within 1.0 mi
Projected returns pro-forma
-3.0% appreciation · 3.0% rent growth · sell at horizon
- IRR
- 33.1%
- Equity multiple
- 2.40×
- Total profit
- $23,423
- Equity at exit
- $8,931
- IRR
- 40.1%
- Equity multiple
- 4.76×
- Total profit
- $63,070
- Equity at exit
- $5,179
Cash invested: $16,772 (down + closing). Projections, not guarantees.
Landlord ↔ Tenant lean methodology
- Overall (STATE)
- 81 Strongly Landlord-Friendly
- State Missouri
- 81 Strongly Landlord-Friendly · R+10
- County
- — inherits STATE
- City
- — inherits STATE
ZIP-level market 63857
- Home prices YoY
- -12.7%
- Active inventory
- 59
- Price-to-rent
- 4.3×
Monthly cashflow live
- Estimated rent
- $1,157 medium interval (Pro) →
- Mortgage (P&I)
- −$314
- Tax from tax record
- −$55 /mo · $660/yr
- Insurance
- −$25
- HOA
- −$0
- Vacancy / Maint / Mgmt
- −$243
- Net cashflow
- $520
Break-even live
Sensitivity live
| Price | -10% $554 | -5% $537 | +0% $520 | +5% $503 | +10% $486 |
|---|---|---|---|---|---|
| Rent | -10% $429 | -5% $474 | +0% $520 | +5% $566 | +10% $611 |
| Rate | -1.0pp $550 | -0.5pp $535 | base $520 | +0.5pp $505 | +1.0pp $489 |
UW: 25.0% down · 7.5% · 30yr · 1.5% tax · 5.0% vac · 8.0% maint · 8.0% mgmt
Financing live
Cash to close
- Down payment
- $14,975
- Closing costs
- $1,797
- Reserves months
- —
- Total cash needed
- —
Loan-product check · same deal, 3 products live
Conventional
25% down · 7.5% · 30yr
- Down + closing
- —
- Monthly P&I
- —
- Monthly cashflow
- —
- DSCR
- —
- Eligible?
- —
Personal DTI + credit; lowest rate.
DSCR
20% down · 8.5% · 30yr
- Down + closing
- —
- Monthly P&I
- —
- Monthly cashflow
- —
- DSCR
- —
- Eligible?
- —
No personal income docs; deal must DSCR.
Hard money
10% down · 12.0% · 12mo
- Down + closing
- —
- Monthly P&I
- —
- Monthly cashflow
- —
- DSCR
- —
- Eligible?
- —
Short-term bridge; refi at stabilization.
Listing history 22 events
-
2026-06-21days on market $59,900 Active 44 DOM
-
2026-06-21days on market $59,900 Active 43 DOM
-
2026-06-18days on market $59,900 Active 41 DOM
-
2026-06-17days on market $59,900 Active 40 DOM
-
2026-06-16days on market $59,900 Active 39 DOM
-
2026-06-15days on market $59,900 Active 38 DOM
-
2026-06-13days on market $59,900 Active 36 DOM
-
2026-06-12days on market $59,900 Active 35 DOM
-
2026-06-09days on market $59,900 Active 32 DOM
-
2026-06-08days on market $59,900 Active 31 DOM
-
2026-06-07days on market $59,900 Active 30 DOM
-
2026-06-05days on market $59,900 Active 28 DOM
-
2026-06-04days on market $59,900 Active 26 DOM
-
2026-06-02days on market $59,900 Active 25 DOM
-
2026-06-01days on market $59,900 Active 24 DOM
-
2026-05-31days on market $59,900 Active 23 DOM
-
2026-05-08$59,900 Active 138-char remark
-
2026-05-07historical $59,900 138-char remark
-
2026-03-05price $59,900
-
2026-02-04price $64,900
-
2025-12-30$69,900 Active
-
1997-12-01soldstatus
ⓘ Source: listings_history table (triggers on properties + properties_extension) + one-shot
backfill from property_details.listing_events for pre-trigger history.
Tax reassessment forecast MO · Resets to sale price
- Current annual tax
- $660 · $55/mo
- Projected year-2 tax
- $660 · $55/mo
- Expected delta
- $0/yr ($0/mo · 0.0%)
ⓘ Screening estimate from a state-policy table — verify with the county assessor before closing.
Climate risk First Street
- Flood 1/10 Low FEMA zone X · 0% chance over 30 yrs
- Wildfire 1/10 Low
- Heat 6/10 Major 7 d/yr ≥110°F today · 20 d/yr by 30 yrs out
- Wind 4/10 Moderate 8% chance of damaging wind over 30 yrs
- Air quality 1/10 Low 0 unhealthy d/yr today · 0 by 30 yrs out
Nearby sold comps map
Loading sold comps map…
Walkable amenities ~0.75 mi
Loading nearby amenities…
Taxation est. · year 1
- Rental income
- $13,886
- − Mortgage interest
- −$3,355
- − Property taxes
- −$660
- − Insurance
- −$300
- − Repairs & maintenance
- −$1,111
- − Management
- −$1,111
- − Depreciation
- −$1,743
- Taxable income
- $5,607
- Est. tax owed @ 24.0%
- −$1,346
- After-tax cash flow
- $4,895/yr
For passive investors: Depreciation is non-cash, so a rental often shows a tax loss while cash-flowing — sheltering income. Rental losses are passive: they offset passive income freely, and up to $25,000/yr can offset ordinary (W-2) income if you actively participate and your MAGI is under $100k (phasing out to $0 by $150k); unused losses carry forward. On sale, claimed depreciation is recaptured at up to 25%, and gains may owe capital-gains tax (a 1031 exchange can defer both). Figures are a year-1 estimate at your 24.0% rate — not tax advice; consult a CPA.
Schools (NCES district)
- District
- Kennett 39
- NCES district ID
- 2916500
- Math proficiency
- 28% ▼ -16.00%
- Reading proficiency
- 36% ▼ -5.00%
- Median HH income
- $32,065
- Composite
- 26.12/100
- National rank
- #7284
- State rank
- #262 of 324 in MO
Livability — Kennett
- Score
- 59/100
- State rank
- #561
- US rank
- #20397
Category grades
Schools grade is shown separately in the Schools card above.
Census & demographics
- Census place
- Kennett, MO
- Population (ZIP)
- 11,964
Population outlook (Dunklin County) Hauer SSP2
- Today (2025)
- 28,599 people
- By 2030
- 27,230 · -4.8%
- By 2040
- 24,696 · -13.6%
- By 2050
- 22,402 · -21.7%
- By 2075
- 17,776 · -37.8%
- By 2100
- 13,890 · -51.4%
Race, ethnicity, and origin ACS 2023
- Neighborhood character
- Predominantly White (75%)
- Race & ethnicity
- White 75% Black 12% Two or more races 10% Hispanic / Latino 4%
- Common ancestry
- Slovak 3% Iranian 2% Serbian 2%
- Foreign-born
- 2% · Canada
- Languages at home
- 94% English-only · Spanish 5%
Political lean MEDSL · Dunklin
- 2024 margin
- Solid R (+61.8) · D 18.8% · R 80.5%
- 2008→2024 swing
- -40.5pp toward R · 2008: -21.3pp · 2024: -61.8pp
- All cycles
- 2024: R+61.8 2020: R+57.0 2016: R+53.6 2012: R+30.2 2008: R+21.3
Not yet ingested
- Civics
- —
Market trends
- HPI YoY
- ▼ -18.51%
- Current HPI
- 127.6077
- Rent YoY
- —
- Metro
- —
- State GDP YoY
- ▲ 1.84%
- F500 in state
- 20
Industry mix (Fortune 500 HQ in MO)
| Industry | F500 HQs | Revenue |
|---|---|---|
| Healthcare | 1 | $163B |
|
||
| Insurance | 1 | $21B |
|
||
| Industrial Technology | 1 | $17B |
|
||
| Retail | 1 | $16B |
|
||
| Industrial Distribution | 1 | $10B |
|
||
| Utilities | 1 | $9B |
|
||
Price history
-14.3% since first listed6 events — show timeline
- 2026-05-08 Listed $59,900 MARIS as Distributed by MLS Grid
- 2026-05-07 Coming Soon $59,900 MARIS as Distributed by MLS Grid
- 2026-03-05 Price Changed $59,900 MARIS as Distributed by MLS Grid
- 2026-02-04 Price Changed $64,900 MARIS as Distributed by MLS Grid
- 2025-12-30 Listed $69,900 MARIS as Distributed by MLS Grid
- 1997-12-01 Sold (Public Records) — Public Records
Property tax history
+0.9%/yrLatest (2025): $660 · +0.6% YoY. Source: county tax records.
Cash-flow waterfall
monthlySold comps — $/sqft
last 12 mo · ≤1 miLoading sold comps…