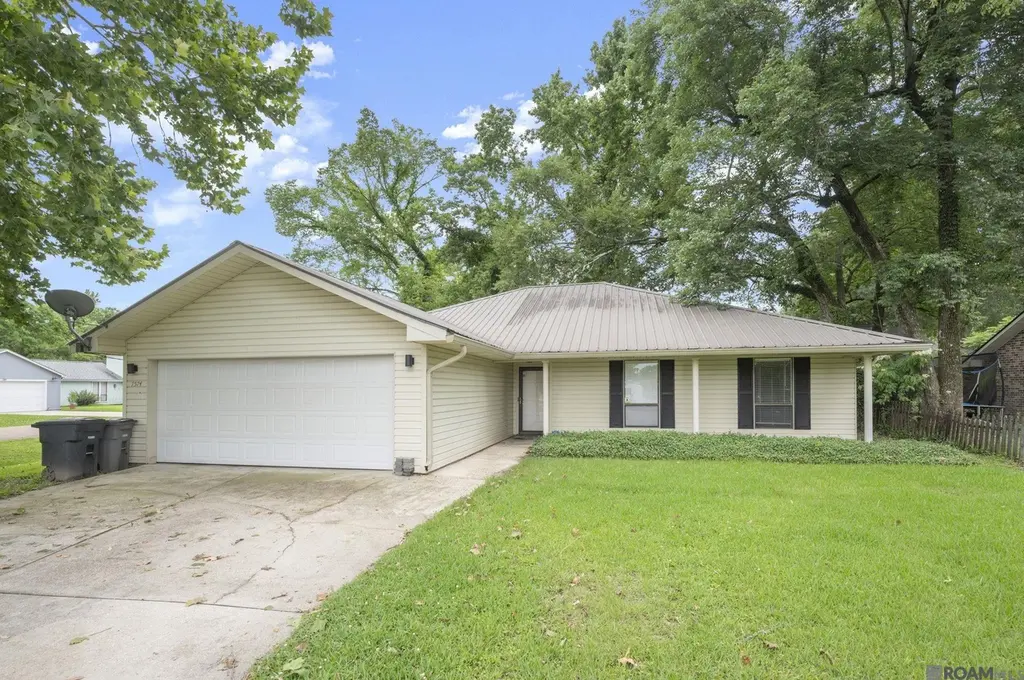
7574 Pennhill Dr · Baton Rouge, LA
Flood risk 1/10 · Minimal
- FEMA flood zone
- X
- Chance of flooding over 30 yrs
- 0.0%
- Est. flood insurance / yr
- $507 – $1,088
Fire risk 1/10 · Minimal
- Est. fire insurance / yr
- $1,269 – $2,357
Heat risk 8/10 · Major
- Hot days now (above 108°F)
- 7 days/yr
- Hot days in 30 yrs
- 21 days/yr
Wind risk 9/10 · Severe
- Chance of severe wind over 30 yrs
- 99.0%
Air-quality risk 3/10 · Minor
- Unhealthy air days now
- 2 days/yr
- Unhealthy air days in 30 yrs
- 3 days/yr
Risk factors via First Street. Map © Google.
Why this score? — see what drove the C grade
The composite is a weighted blend of 9 inputs, each scored 0–100. Each bar is that input's sub-score; the figure is the points it added to the 100-point composite (weight × sub-score).
- Cash flow +21.2/30.0
- ARV discount +15.0/15.0
- DSCR +6.8/10.0
- 1% rule +5.2/10.0
- Livability +3.7/5.0
- Rent growth +3.0/5.0
- Condition / age +2.5/5.0
- Schools +2.4/10.0
- Appreciation +0.0/10.0
$242,000
🖨 Deal sheet (PDF) 📄 Offer letter ✓ Due diligence
Listing remarks MLS
Updated 3BR/2BA home for sale in Baton Rouge located in desirable Briar Place Subdivision! This move-in ready home offers NO carpet, a durable metal roof, and a functional floor plan designed for comfortable living. Step inside to a spacious living room featuring vaulted ceilings, a stunning stone fireplace, and custom built-ins that create a warm and inviting focal point. The kitchen is perfect for everyday living and entertaining, complete with granite countertops, double ovens, abundant cabinet space, and a spacious eat-in dining area. The private primary suite and additional bedrooms are all generously sized with large closets, offering plenty of room for family, guests, or a home office setup. One of the standout features is the oversized air-conditioned storage room located just off the garage--ideal for a workshop, hobby room, home gym, or extra storage. Step outside to enjoy the private fenced backyard and spacious deck, creating the perfect setting for outdoor entertaining, weekend BBQs, or relaxing evenings at home. Located in Flood Zone X and did NOT flood in 2016, this Baton Rouge home combines peace of mind with convenience, just minutes from shopping, dining, schools, and everyday amenities. If you're searching for an updated Baton Rouge home with no carpet, granite countertops, a metal roof, and outdoor living space, this Briar Place beauty is one you do not want to miss. Schedule your private showing today!
Key facts
- Metal roof
- No carpet
- Custom built-ins
Tags
Property features AI
Finance
- Other: Located in the Briar Place subdivision
- HOA & community: Homeowners association with an annual fee of $290 (about $24.17/month)
Exterior
- Parking: Garage with garage door opener
- Security: Smoke detectors
- Utilities: Public water; Public sewer
- Home design: Single-family detached residence; Residential property
- Construction: Vinyl siding; Frame construction; Slab foundation; Built in 2026
- Exterior features: Outdoor lighting; Wood fencing; Deck
Interior
- Kitchen: Electric cooktop; Dishwasher; Garbage disposal
- Flooring: Tile; Ceramic tile; Laminate
- Bathrooms: 2 full bathrooms
- Heating & cooling: Central heating; Central air; Ceiling fans
- Interior features: Vaulted ceilings; Built-in features; Fireplace (1)
Neighborhood map
What this means for you Summary
Snapshot
- This is a 3-bed/2.0-bath single-family listed at $242k.
Deal economics
- At list price, monthly cash flow is $351 ($4k/yr) — positive.
- The deal already cash-flows at list — no discount required.
- Meets the 1% rule at list price ($2k rent vs $242k).
- Recommended offer: $238k (1.5% below list) — sets the bar for market timing.
- Cap rate 8.0% vs local median 4.2% in Baton Rouge — top-decile yield for the area; either an underpriced asset or a hidden risk that comps aren't pricing in. Stress-test before assuming the spread holds.
Location & tenants
- Location reads 74/100 on livability (#24 in LA, #4,535 nationally) — a middle-class / working-renter tenant base. Strengths: commute A+, cost of living A+, health & safety A+; Watch: amenities D, crime F, employment D-.
- East Baton Rouge Parish (urban): math 22% / reading 34% proficiency, ranked #47 of 98 in LA (top 48%) — low school quality limits family demand, transient renter base, plan for 1-2y turnover; 77% free/reduced lunch — lower-income household profile, screen leases tightly.
- Zoned schools: Woodlawn Elementary (math 37% / reading 56%, grade D-, #159 of 646 statewide, top 25%, 718 students, 65% FRL); Woodlawn Middle School (math 20% / reading 39%, grade F, #116 of 218 statewide, top 53%, 887 students, 69% FRL); Woodlawn High School (math 25% / reading 30%, grade F, #133 of 265 statewide, top 51%, 1,527 students, 62% FRL).
- Market conditions: Rents rising (+2.0%/yr); 361 active listings in the ZIP; 8 comparable units currently listed for rent nearby; rentals at typical pace (median 26d on market — plan ~3-4 weeks tenant-placement turnaround); solid renter incomes; 2,252 units permitted in East Baton Rouge Parish in 2024 (440 in 5+ unit buildings).
Forward outlook
- Local home prices are declining (-3.0%/yr); year-one equity from $2k of loan paydown is wiped out by about $7k of value loss. Plan a longer hold.
- East Baton Rouge County population projected at +4% by 2050 — modest demand growth; plan on rents tracking national, not racing it.
Negotiation context
- It's been on market 23 days — a 2% lower offer ($238k) is reasonable based on typical stale-listing flexibility.
- 22 sale attempts since 25y ago with the ask held roughly flat each time — persistent listings suggest the price (not the market) is what's stuck; bring a comps-based counter.
Risks & watch-outs
- Climate carrying-cost: severe wind risk, 99% chance of damaging wind over 30y; extreme-heat days projected 7→21/yr by 2055 (HVAC capex compounding) — expect insurance premiums to compound above CPI over the hold.
Questions for the listing agent
- Built in 1978 — when were the roof, HVAC, electrical panel, plumbing, and water heater last replaced?
- What does the HOA fee cover, when was the last increase, and are there any pending special assessments or reserve-fund shortfalls?
- Is there a deadline driving the sale (1031 exchange, divorce, estate, relocation)? That informs how much negotiation room exists.
- Crime grade is F in this area — have there been break-ins, vandalism, or insurance claims at this property in the last 3 years? What carrier currently insures it and at what premium?
- What's the average days-on-market for RENTAL listings here right now (not sales)? A rising rental-DOM trend means longer vacancies and softer asking-rent achievability than the comps imply.
- What's the recent tenant-quality profile in this submarket — average credit score on applications, eviction rate, late-payment / NSF rate, and stable-employment percentage? A property-management company in the area should have these aggregated.
- How much new for-sale + rental construction is in the pipeline within 1–3 miles? Heavy new supply typically softens prices + rents 12–24 months out; constrained supply supports both.
Investment metrics
- 1% rule
- 1.02% ✓
- Cap rate
- 8.03%
- Cash-on-cash
- 6.21%
- DSCR
- 1.28
- GRM
- 8.2
CMA / ARV
- ARV (on-the-fly)
- $406,524
- Comps found
- 12
Show comp detail 12 sales within ~0.75 mi
| Address | Dist | Beds/Ba | Sqft | Sold | Price | $/sf | Match |
|---|---|---|---|---|---|---|---|
| 14072 Pinehurst Ave | 0.14mi | 3/2.0 | 1,736 (-3%) | 8mo | $245,000 | $141 | 83 |
| 13968 Pinehurst Ave | 0.09mi | 3/2.0 | 1,893 (+6%) | 6mo | $194,000 | $102 | 81 |
| 14301 Spalding Way | 0.33mi | 3/2.0 | 1,836 (+3%) | 1mo | $436,017 | $237 | 79 |
| 7529 Mcmahon Dr | 0.16mi | 3/2.5 | 1,908 (+7%) | 2mo | $450,000 | $236 | 78 |
| 7714 Jeter Dr | 0.31mi | 3/2.0 | 1,836 (+3%) | 4mo | $419,400 | $228 | 78 |
| 7702 Jeter Dr | 0.31mi | 3/2.0 | 1,862 (+4%) | 1mo | $475,107 | $255 | 77 |
| 7714 Jeter Dr | 0.37mi | 3/2.0 | 1,836 (+3%) | 4mo | $419,400 | $228 | 75 |
| 14114 Pinehurst Ave | 0.18mi | 3/2.0 | 1,927 (+8%) | 5mo | $235,000 | $122 | 74 |
| 6261 Ridge Way Ave | 0.34mi | 3/2.0 | 1,901 (+7%) | 0mo | $315,000 | $166 | 73 |
| 14428 Farris Dr | 0.36mi | 3/2.0 | 1,962 (+10%) | 2mo | $492,085 | $251 | 65 |
| 8116 President Dr | 0.59mi | 3/2.0 | 1,580 (-11%) | 2mo | $213,300 | $135 | 52 |
| 7331 Board Dr | 0.66mi | 3/2.0 | 1,550 (-13%) | 4mo | $205,000 | $132 | 44 |
Match score weights: distance 35% · size 25% · config 20% · recency 20%. Top-matched comps best support the ARV.
Projected returns pro-forma
-3.0% appreciation · 2.05% rent growth · sell at horizon
- IRR
- -7.8%
- Equity multiple
- 0.72×
- Total profit
- $-19,221
- Equity at exit
- $36,083
- IRR
- 0.6%
- Equity multiple
- 1.04×
- Total profit
- $2,585
- Equity at exit
- $20,924
Cash invested: $67,760 (down + closing). Projections, not guarantees.
Landlord ↔ Tenant lean methodology
- Overall (STATE)
- 90 Strongly Landlord-Friendly
- State Louisiana
- 90 Strongly Landlord-Friendly · R+12
- County
- — inherits STATE
- City
- — inherits STATE
ZIP-level market 70817
- Rents YoY
- 2.0%
- Active inventory
- 361
- Price-to-rent
- 8.2×
Monthly cashflow live
- Estimated rent
- $2,469 high interval (Pro) →
- Mortgage (P&I)
- −$1,269
- Tax from tax record
- −$206 /mo · $2,470/yr
- Insurance
- −$101
- HOA
- −$24
- Vacancy / Maint / Mgmt
- −$518
- Net cashflow
- $351
Break-even live
Sensitivity live
| Price | -10% $488 | -5% $419 | +0% $351 | +5% $282 | +10% $214 |
|---|---|---|---|---|---|
| Rent | -10% $156 | -5% $253 | +0% $351 | +5% $448 | +10% $546 |
| Rate | -1.0pp $473 | -0.5pp $412 | base $351 | +0.5pp $288 | +1.0pp $224 |
UW: 25.0% down · 7.5% · 30yr · 1.5% tax · 5.0% vac · 8.0% maint · 8.0% mgmt
Financing live
Cash to close
- Down payment
- $60,500
- Closing costs
- $7,260
- Reserves months
- —
- Total cash needed
- —
Loan-product check · same deal, 3 products live
Conventional
25% down · 7.5% · 30yr
- Down + closing
- —
- Monthly P&I
- —
- Monthly cashflow
- —
- DSCR
- —
- Eligible?
- —
Personal DTI + credit; lowest rate.
DSCR
20% down · 8.5% · 30yr
- Down + closing
- —
- Monthly P&I
- —
- Monthly cashflow
- —
- DSCR
- —
- Eligible?
- —
No personal income docs; deal must DSCR.
Hard money
10% down · 12.0% · 12mo
- Down + closing
- —
- Monthly P&I
- —
- Monthly cashflow
- —
- DSCR
- —
- Eligible?
- —
Short-term bridge; refi at stabilization.
Rent comps 8 comps
| Address | Beds | Baths | Sqft | Rent | $/sqft | DOM | Units | Dist |
|---|---|---|---|---|---|---|---|---|
| 7671 Dearborne Dr Baton Rouge, LA | 3.0 | 2.0 | 1886 | $4,000 | $2.12 | 25d | 1 | 0.40mi |
| 7004 Spring Gardens Dr Baton Rouge, LA | 3.0 | 2.0 | 1630 | $2,000 | $1.23 | 46d | 1 | 0.83mi |
| 6212 Stumberg Ln Baton Rouge, LA | 3.0 | 2.0 | 1424 | $1,500 | $1.05 | 46d | 1 | 1.00mi |
| 7441 Quorum Dr Baton Rouge, LA | 4.0 | 2.0 | 1861 | $2,000 | $1.07 | 25d | 1 | 1.03mi |
| 5908 Stumberg Ln #21 Baton Rouge, LA | 2.0 | 2.0 | 1588 | $1,600 | $1.01 | 46d | 1 | 1.05mi |
| 15616 Council Ave Baton Rouge, LA | 3.0 | 2.0 | 2163 | $2,200 | $1.02 | 16d | 1 | 1.21mi |
| 6714 Tiger Pointe Dr Baton Rouge, LA | 4.0 | 2.5 | 2082 | $2,400 | $1.15 | 16d | 1 | 1.42mi |
| 6708 Tiger Pointe Dr Baton Rouge, LA | 4.0 | 2.5 | 2367 | $2,500 | $1.06 | 25d | 1 | 1.43mi |
HOA detail
- Monthly dues
- $24 · $288/yr
- Likely covers
- gym
Listing history 17 events
-
2026-06-22days on market $242,000 Active 23 DOM
-
2026-06-18days on market $242,000 Active 20 DOM
-
2026-06-17days on market $242,000 Active 19 DOM
-
2026-06-16days on market $242,000 Active 18 DOM
-
2026-06-15days on market $242,000 Active 17 DOM
-
2026-06-14days on market $242,000 Active 15 DOM
-
2026-06-10days on market $242,000 Active 12 DOM
-
2026-06-09days on market $242,000 Active 11 DOM
-
2026-06-08days on market $242,000 Active 10 DOM
-
2026-06-07days on market $242,000 Active 9 DOM
-
2026-06-05days on market $242,000 Active 6 DOM
-
2026-06-03days on market $242,000 Active 5 DOM
-
2026-06-02days on market $242,000 Active 4 DOM
-
2026-06-01days on market $242,000 Active 3 DOM
-
2026-05-31days on market $242,000 Active 2 DOM
-
2026-05-31remarks 699-char remark
-
2026-05-31$242,000 Active 1 DOM
ⓘ Source: listings_history table (triggers on properties + properties_extension) + one-shot
backfill from property_details.listing_events for pre-trigger history.
Tax reassessment forecast LA · Resets to sale price
- Current annual tax
- $2,470 · $206/mo
- Projected year-2 tax
- $2,470 · $206/mo
- Expected delta
- $0/yr ($0/mo · 0.0%)
ⓘ Screening estimate from a state-policy table — verify with the county assessor before closing.
Climate risk First Street
- Flood 1/10 Low FEMA zone X · 0% chance over 30 yrs
- Wildfire 1/10 Low
- Heat 8/10 Severe 7 d/yr ≥108°F today · 21 d/yr by 30 yrs out
- Wind 9/10 Extreme 99% chance of damaging wind over 30 yrs
- Air quality 3/10 Moderate 2 unhealthy d/yr today · 3 by 30 yrs out
Nearby sold comps map
Loading sold comps map…
Walkable amenities ~0.75 mi
Loading nearby amenities…
Taxation est. · year 1
- Rental income
- $29,628
- − Mortgage interest
- −$13,556
- − Property taxes
- −$2,470
- − Insurance
- −$1,210
- − Repairs & maintenance
- −$2,370
- − Management
- −$2,370
- − HOA
- −$288
- − Depreciation
- −$7,040
- Taxable income
- $323
- Est. tax owed @ 24.0%
- −$78
- After-tax cash flow
- $4,131/yr
For passive investors: Depreciation is non-cash, so a rental often shows a tax loss while cash-flowing — sheltering income. Rental losses are passive: they offset passive income freely, and up to $25,000/yr can offset ordinary (W-2) income if you actively participate and your MAGI is under $100k (phasing out to $0 by $150k); unused losses carry forward. On sale, claimed depreciation is recaptured at up to 25%, and gains may owe capital-gains tax (a 1031 exchange can defer both). Figures are a year-1 estimate at your 24.0% rate — not tax advice; consult a CPA.
Schools (NCES district)
- District
- East Baton Rouge Parish
- NCES district ID
- 2200540
- Math proficiency
- 22% ▼ -36.00%
- Reading proficiency
- 34% ▼ -31.00%
- Median HH income
- $46,263
- Composite
- 24.14/100
- National rank
- #7745
- State rank
- #47 of 98 in LA
Livability — Baton Rouge
- Score
- 74/100
- State rank
- #24
- US rank
- #4535
Category grades
Schools grade is shown separately in the Schools card above.
Census & demographics
- County
- East Baton Rouge Parish · 399,686 people
- City population
- 351,868
- Metro
- Baton Rouge, LA
- Population (ZIP)
- 33,482
- Household income
- $102,639
- Rent vs Own
- Severe rent burden
- 755.0
Population outlook (East Baton Rouge County) Hauer SSP2
- Today (2025)
- 464,810 people
- By 2030
- 472,137 · +1.6%
- By 2040
- 480,243 · +3.3%
- By 2050
- 484,422 · +4.2%
- By 2075
- 492,069 · +5.9%
- By 2100
- 476,347 · +2.5%
Race, ethnicity, and origin ACS 2023
- Neighborhood character
- Majority White (64%)
- Race & ethnicity
- White 64% Black 21% Two or more races 9% Hispanic / Latino 5% Asian 3%
- Common ancestry
- Lithuanian 13% Italian 2% Serbian 2%
- Foreign-born
- 6% · Canada, Vietnam, China
- Languages at home
- 91% English-only · Spanish 3% Arabic 1% Vietnamese 1%
Political lean MEDSL · East Baton Rouge
- 2024 margin
- D (+11.1) · D 54.5% · R 43.4% · Other 2.1%
- 2008→2024 swing
- +8.9pp toward D · 2008: 2.2pp · 2024: 11.1pp
- All cycles
- 2024: D+11.1 2020: D+13.1 2016: D+9.2 2012: D+5.2 2008: D+2.2
Not yet ingested
- Civics
- —
Market trends
- HPI YoY
- ▼ -149.27%
- Current HPI
- 170.6826
- Rent YoY
- ▲ 2.05%
- Metro
- Baton Rouge, LA
- State GDP YoY
- ▲ 3.29%
- F500 in state
- 10
Industry mix (Fortune 500 HQ in LA)
| Industry | F500 HQs | Revenue |
|---|---|---|
| Telecommunications | 2 | $23B |
|
||
| Utilities | 1 | $12B |
|
||
| Wholesale / Distribution | 1 | $5B |
|
||
| Advertising | 1 | $2B |
|
||
Price history
+105.3% since first listed33 events — show timeline
- 2026-05-29 Listed $242,000 AcadianaMLS
- 2026-05-29 Listed $242,000 GBRMLS
- 2023-09-25 Sold (Public Records) $225,000 Public Records
- 2023-09-21 Sold (MLS) — GBRMLS
- 2023-08-26 Delisted — GBRMLS
- 2023-07-28 Price Changed $229,000 GBRMLS
- 2023-07-24 Price Changed $239,000 GBRMLS
- 2023-06-27 Listed $229,000 AcadianaMLS
- 2023-06-27 Listed $245,000 GBRMLS
- 2014-07-28 Sold (Public Records) $158,000 Public Records
- 2014-07-25 Sold (MLS) — GBRMLS
- 2014-06-16 Listed $158,000 AcadianaMLS
- 2014-06-16 Listed $158,000 GBRMLS
- 2013-08-02 Listed $158,900 AcadianaMLS
- 2013-08-02 Listed $158,900 GBRMLS
- 2013-05-01 Listed $156,000 AcadianaMLS
- 2013-05-01 Listed $156,000 GBRMLS
- 2013-01-03 Listed $159,000 AcadianaMLS
- 2013-01-03 Listed $159,000 GBRMLS
- 2010-03-24 Sold (Public Records) $150,000 Public Records
- 2010-03-19 Sold (MLS) — GBRMLS
- 2010-01-12 Listed $155,000 GBRMLS
- 2010-01-12 Listed $155,000 AcadianaMLS
- 2008-07-30 Listed $158,000 AcadianaMLS
- 2008-07-30 Listed $158,000 GBRMLS
- 2003-04-29 Sold (MLS) — GBRMLS
- 2003-01-06 Listed $114,900 GBRMLS
- 2003-01-06 Listed $114,900 AcadianaMLS
- 2002-04-30 Listed $117,500 AcadianaMLS
- 2002-04-30 Listed $117,500 GBRMLS
- 2002-03-01 Sold (MLS) — GBRMLS
- 2001-12-05 Listed $117,900 AcadianaMLS
- 2001-12-05 Listed $117,900 GBRMLS
Property tax history
+10.4%/yrLatest (2025): $2,470 · -0.5% YoY. Source: county tax records.
Cash-flow waterfall
monthlySold comps — $/sqft
last 12 mo · ≤1 miLoading sold comps…