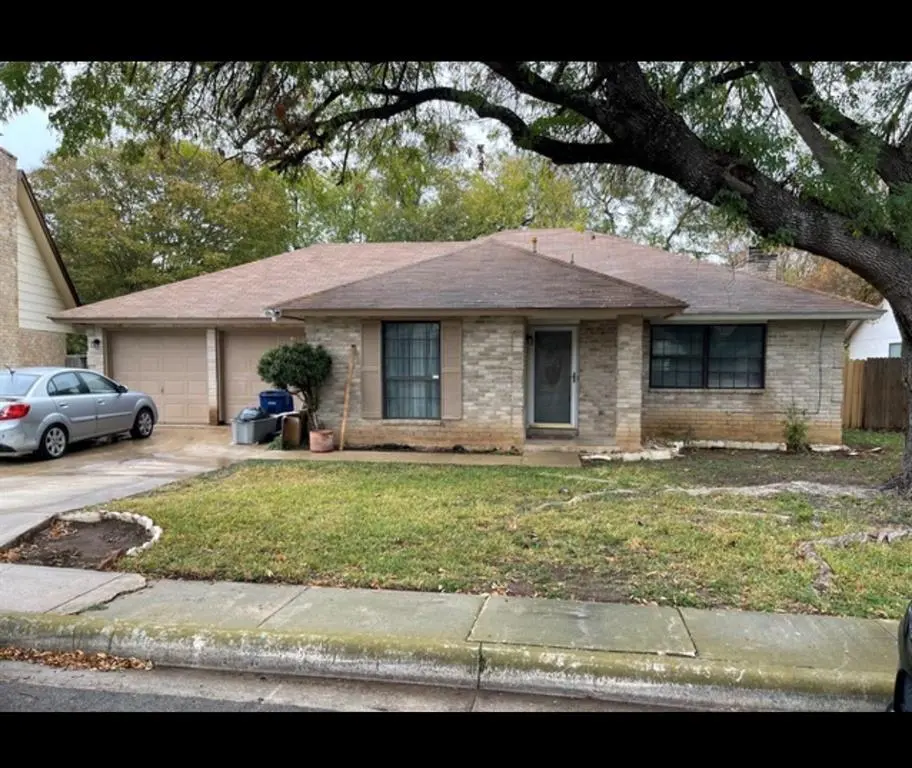
6026 Royal Crk · San Antonio, TX
Flood risk 6/10 · Moderate
- FEMA flood zone
- X (unshaded)
- Chance of flooding over 30 yrs
- 0.73%
- Est. flood insurance / yr
- $507 – $1,088
Fire risk 2/10 · Minimal
- Est. fire insurance / yr
- $1,222 – $2,270
Heat risk 8/10 · Major
- Hot days now (above 107°F)
- 7 days/yr
- Hot days in 30 yrs
- 22 days/yr
Wind risk 8/10 · Major
- Chance of severe wind over 30 yrs
- 80.0%
Air-quality risk 2/10 · Minimal
- Unhealthy air days now
- 0 days/yr
- Unhealthy air days in 30 yrs
- 1 days/yr
Risk factors via First Street. Map © Google.
Why this score? — see what drove the D grade
The composite is a weighted blend of 9 inputs, each scored 0–100. Each bar is that input's sub-score; the figure is the points it added to the 100-point composite (weight × sub-score).
- ARV discount +15.0/15.0
- Cash flow +7.3/30.0
- Livability +4.0/5.0
- 1% rule +3.9/10.0
- Schools +3.8/10.0
- Condition / age +2.5/5.0
- Rent growth +2.2/5.0
- DSCR +1.5/10.0
- Appreciation +0.0/10.0
$189,000
🖨 Deal sheet 📄 Offer letter ✓ Due diligence
Listing remarks MLS
Step into this well-designed 3-bedroom, 2-bath home offering both space and functionality. Featuring two dining areas and two separate living spaces, this layout is perfect for entertaining, relaxing, or creating flexible work-from-home options. The open concept kitchen flows seamlessly into the main living area and offers abundant cabinet space, making storage and organization effortless. The interior utility room adds everyday convenience, while the spacious backyard provides plenty of room for outdoor gatherings, play, or future customization. Located in a desirable community with access to a neighborhood pool and tennis club, this home also offers unbeatable convenience, centrally positioned near Ft. Sam Houston, the airport, and Randolph Air Force Base. A perfect blend of comfort, space, and location! This home is ready to fit your lifestyle.
Key facts
- Two dining areas
- Open concept kitchen
- Spacious backyard
Tags
Neighborhood map
What this means for you Summary
Snapshot
- This is a 3-bed/3.0-bath single-family listed at $189k.
Deal economics
- At list price, monthly cash flow is $-248 ($-3k/yr) — negative.
- To cash-flow at today's rent, offer at most $145k (23.2% below list).
- To meet the 1% rule (rent ≥ 1% of price), the offer needs to be $168k (11.2% below list).
- Recommended offer: $145k (23.2% below list) — sets the bar for cash-flow.
- Cap rate 4.7% vs local median 3.8% in San Antonio — meaningfully above typical; check what's discounted (condition, days-on-market, listing class) to confirm the premium yield is real.
Location & tenants
- Location reads 80/100 on livability (#31 in TX, #1,616 nationally) — a professional / high-income tenant draw. Strengths: amenities A+, commute A+, cost of living A+; Watch: schools C-, crime F.
- North East ISD (urban): math 38% / reading 49% proficiency, ranked #276 of 826 in TX (top 33%) — families likely to look elsewhere, expect single-tenant / working-renter base with shorter leases.
- Market conditions: Rents soft (-1.1%/yr); 202 active listings in the ZIP; 40 comparable units currently listed for rent nearby; rentals at typical pace (median 20d on market — plan ~3-4 weeks tenant-placement turnaround); 8,308 units permitted in Bexar County in 2024 (2,506 in 5+ unit buildings).
Forward outlook
- Local home prices are declining (-3.0%/yr); year-one equity from $1k of loan paydown is wiped out by about $6k of value loss. Plan a longer hold.
- Bexar County population projected at +50% by 2050 — long-run rental-demand tailwind backs the buy-and-hold thesis.
Negotiation context
- It's been on market 51 days — a 3% lower offer ($183k) is reasonable based on typical stale-listing flexibility.
- 11 sale attempts since 19y ago with the ask held roughly flat each time — persistent listings suggest the price (not the market) is what's stuck; bring a comps-based counter.
Risks & watch-outs
- Watch-outs: property tax is 2.9% of price.
- Climate carrying-cost: major flood risk; severe wind risk, 80% chance of damaging wind over 30y; extreme-heat days projected 7→22/yr by 2055 (HVAC capex compounding) — expect insurance premiums to compound above CPI over the hold.
Questions for the listing agent
- What do current leases actually rent for vs. the listed asking? Can we see a recent rent roll and the last 12 months of T-12 income?
- It's been on market 51 days. Have you received any prior offers? Is the seller open to a 23% concession, seller financing, or rate buy-down credit?
- Built in 1979 — when were the roof, HVAC, electrical panel, plumbing, and water heater last replaced?
- Property tax is high relative to price — has the assessment been appealed recently, and will the sale trigger a re-assessment?
- What does the HOA fee cover, when was the last increase, and are there any pending special assessments or reserve-fund shortfalls?
- Is there a deadline driving the sale (1031 exchange, divorce, estate, relocation)? That informs how much negotiation room exists.
- Crime grade is F in this area — have there been break-ins, vandalism, or insurance claims at this property in the last 3 years? What carrier currently insures it and at what premium?
- The area grade is low — what's the realistic commute time and amenity access for the typical tenant pool here? Any planned neighborhood developments (good or bad) we should know about?
- What's the average days-on-market for RENTAL listings here right now (not sales)? A rising rental-DOM trend means longer vacancies and softer asking-rent achievability than the comps imply.
- What's the recent tenant-quality profile in this submarket — average credit score on applications, eviction rate, late-payment / NSF rate, and stable-employment percentage? A property-management company in the area should have these aggregated.
- How much new for-sale + rental construction is in the pipeline within 1–3 miles? Heavy new supply typically softens prices + rents 12–24 months out; constrained supply supports both.
Investment metrics
- 1% rule
- 0.89% ✗
- Cap rate
- 4.72%
- Cash-on-cash
- -5.63%
- DSCR
- 0.75
- GRM
- 9.4
CMA / ARV
- ARV (median comp)
- $289,719
- List price
- $189,000
- Delta
- -34.76%
- Verdict
- UNDERPRICED
- Comps
- 20 within 1.0 mi
Show comp detail 12 sales within ~0.75 mi
| Address | Dist | Beds/Ba | Sqft | Sold | Price | $/sf | Match |
|---|---|---|---|---|---|---|---|
| 6247 Lowrie | 0.13mi | 3/2.0 | 1,812 (+6%) | 4mo | $320,000 | $177 | 76 |
| 5820 Archwood | 0.34mi | 3/2.0 | 1,620 (-5%) | 2mo | $240,000 | $148 | 70 |
| 6415 Ithaca | 0.41mi | 3/2.0 | 1,630 (-4%) | 2mo | $221,000 | $136 | 68 |
| 10258 King Robert | 0.39mi | 4/2.0 (+1) | 1,738 (+2%) | 4mo | $346,990 | $200 | 66 |
| 6035 Royal Breeze | 0.30mi | 3/2.0 | 1,846 (+8%) | 2mo | $290,000 | $157 | 66 |
| 6422 Ithaca Fls | 0.43mi | 3/2.0 | 1,630 (-4%) | 4mo | $214,900 | $132 | 66 |
| 9834 Dull Knife | 0.21mi | 3/2.0 | 1,496 (-12%) | 3mo | $199,000 | $133 | 63 |
| 5835 Royal Clb | 0.42mi | 3/2.0 | 1,561 (-8%) | 1mo | $227,000 | $145 | 61 |
| 6455 Wind Cyn | 0.63mi | 3/2.0 | 1,642 (-4%) | 2mo | $266,000 | $162 | 58 |
| 10274 King Robert | 0.39mi | 3/2.0 | 1,522 (-11%) | 3mo | $345,125 | $227 | 58 |
| 10275 King Robert | 0.34mi | 3/2.0 | 1,929 (+13%) | 1mo | $358,990 | $186 | 57 |
| 6430 Ithaca Fls | 0.44mi | 3/2.0 | 1,520 (-11%) | 1mo | $170,000 | $112 | 57 |
Match score weights: distance 35% · size 25% · config 20% · recency 20%. Top-matched comps best support the ARV.
Projected returns pro-forma
-3.0% appreciation · 0.0% rent growth · sell at horizon
- IRR
- -30.1%
- Equity multiple
- 0.03×
- Total profit
- $-51,173
- Equity at exit
- $28,181
- IRR
- -57.3%
- Equity multiple
- -0.57×
- Total profit
- $-83,159
- Equity at exit
- $16,341
Cash invested: $52,920 (down + closing). Projections, not guarantees.
Landlord ↔ Tenant lean methodology
- Overall (STATE)
- 87 Strongly Landlord-Friendly
- State Texas
- 87 Strongly Landlord-Friendly · R+5
- County
- — inherits STATE
- City
- — inherits STATE
ZIP-level market 78239
- Home prices YoY
- -5.9%
- Rents YoY
- -1.1%
- Active inventory
- 202
- Price-to-rent
- 9.4×
Monthly cashflow live
- Estimated rent
- $1,677 high interval (Pro) →
- Mortgage (P&I)
- −$991
- Tax from tax record
- −$462 /mo · $5,540/yr
- Insurance
- −$79
- HOA
- −$42
- Vacancy / Maint / Mgmt
- −$352
- Net cashflow
- $-248
Break-even live
UW: 25.0% down · 7.5% · 30yr · 1.5% tax · 5.0% vac · 8.0% maint · 8.0% mgmt
Financing live
Cash to close
- Down payment
- $47,250
- Closing costs
- $5,670
- Reserves months
- —
- Total cash needed
- —
Loan-product check · same deal, 3 products live
Conventional
25% down · 7.5% · 30yr
- Down + closing
- —
- Monthly P&I
- —
- Monthly cashflow
- —
- DSCR
- —
- Eligible?
- —
Personal DTI + credit; lowest rate.
DSCR
20% down · 8.5% · 30yr
- Down + closing
- —
- Monthly P&I
- —
- Monthly cashflow
- —
- DSCR
- —
- Eligible?
- —
No personal income docs; deal must DSCR.
Hard money
10% down · 12.0% · 12mo
- Down + closing
- —
- Monthly P&I
- —
- Monthly cashflow
- —
- DSCR
- —
- Eligible?
- —
Short-term bridge; refi at stabilization.
Rent comps 40 comps
| Address | Beds | Baths | Sqft | Rent | $/sqft | DOM | Units | Dist |
|---|---|---|---|---|---|---|---|---|
| 10527 Sonora Sunset San Antonio, TX | 3.0 | 2.5 | 1582 | $1,599 | $1.01 | 20d | 1 | 0.35mi |
| 10527 Sonora Sunset San Antonio, TX | 3.0 | 2.5 | 1582 | $1,599 | $1.01 | 7d | 1 | 0.35mi |
| 6406 Ithaca Fls San Antonio, TX | 3.0 | 2.5 | 1508 | $1,500 | $0.99 | 10d | 1 | 0.39mi |
| 6427 Ithaca Fls San Antonio, TX | 3.0 | 2.0 | 1315 | $1,595 | $1.21 | 7d | 1 | 0.43mi |
| 6427 Ithaca Fls San Antonio, TX | 3.0 | 2.0 | 1314 | $1,595 | $1.21 | 23d | 1 | 0.43mi |
| 5838 Royal Bnd San Antonio, TX | 3.0 | 2.5 | 1908 | $1,850 | $0.97 | 10d | 1 | 0.43mi |
| 10306 Pinehurst Run San Antonio, TX | 3.0 | 2.0 | 1271 | $1,800 | $1.42 | 7d | 1 | 0.44mi |
| 6503 Ithaca Frst San Antonio, TX | 3.0 | 2.0 | 1630 | $1,695 | $1.04 | 43d | 1 | 0.46mi |
| 6527 Ithaca Fls San Antonio, TX | 3.0 | 2.5 | 1528 | $1,850 | $1.21 | 4d | 1 | 0.51mi |
| 10503 Ludlow Ct San Antonio, TX | 4.0 | 2.0 | 1690 | $1,100 | $0.65 | 4d | 1 | 0.55mi |
| 10958 Crown Park San Antonio, TX | 3.0 | 2.5 | 1750 | $1,500 | $0.86 | 10d | 1 | 0.63mi |
| 9711 Arcade Rdg San Antonio, TX | 3.0 | 2.0 | 1210 | $1,299 | $1.07 | 43d | 1 | 0.64mi |
| 6722 Badger Pass Dr San Antonio, TX | 4.0 | 2.0 | 2180 | $1,795 | $0.82 | 4d | 1 | 0.65mi |
| 9426 Apple Ridge Ln Unit 603 San Antonio, TX | 3.0 | 2.5 | 1225 | $1,450 | $1.18 | 7d | 1 | 0.66mi |
| 34 Basin Elm San Antonio, TX | 3.0 | 2.5 | 1627 | $1,600 | $0.98 | 23d | 1 | 0.81mi |
| 9410 Fulwood Trl San Antonio, TX | 3.0 | 2.0 | 1210 | $1,425 | $1.18 | 21d | 1 | 0.82mi |
| 19 Bedford Bay San Antonio, TX | 3.0 | 3.0 | 1721 | $2,129 | $1.24 | 23d | 1 | 0.82mi |
| 19 Bedford Bay San Antonio, TX | 3.0 | 2.5 | 1721 | $1,749 | $1.02 | 1d | 1 | 0.82mi |
| 160 Booker Palm San Antonio, TX | 3.0 | 2.5 | 1721 | $1,610 | $0.94 | 4d | 1 | 0.82mi |
| 9318 Bending Crst San Antonio, TX | 4.0 | 2.5 | 1879 | $1,700 | $0.90 | 10d | 1 | 0.83mi |
| 11 Basin Elm San Antonio, TX | 3.0 | 2.5 | 1437 | $1,550 | $1.08 | 4d | 1 | 0.85mi |
| 18 Anchorage Bay San Antonio, TX | 3.0 | 2.5 | 1585 | $1,750 | $1.10 | 21d | 1 | 0.86mi |
| 127 Booker Palm San Antonio, TX | 3.0 | 2.5 | 1680 | $1,600 | $0.95 | 23d | 1 | 0.86mi |
| 3 Basin Elm San Antonio, TX | 3.0 | 2.0 | 1437 | $1,715 | $1.19 | 20d | 1 | 0.87mi |
| 7 Beacon Oak San Antonio, TX | 3.0 | 2.5 | 1446 | $1,699 | $1.17 | 3d | 1 | 0.88mi |
| 60 Adkins Rdg San Antonio, TX | 4.0 | 2.5 | 2175 | $1,715 | $0.79 | 43d | 1 | 0.90mi |
| 14 Adkins Rdg San Antonio, TX | 3.0 | 2.5 | 1680 | $1,625 | $0.97 | 21d | 1 | 0.90mi |
| 8818 Bridington San Antonio, TX | 3.0 | 2.0 | 1814 | $2,100 | $1.16 | 13d | 1 | 0.91mi |
| 9934 Hazy Bnd Unit 101 San Antonio, TX | 3.0 | 2.5 | 1225 | $1,400 | $1.14 | 43d | 1 | 0.92mi |
| 9934 Hazy Bnd Unit 104 San Antonio, TX | 3.0 | 2.5 | 1225 | $1,675 | $1.37 | 43d | 1 | 0.92mi |
| 9934 Hazy Bnd San Antonio, TX | 3.0 | 2.5 | 1225 | $1,538 | $1.26 | 2d | 2 | 0.92mi |
| 9930 Hazy Bnd Unit 3 San Antonio, TX | 3.0 | 2.5 | 1225 | $1,375 | $1.12 | 43d | 1 | 0.92mi |
| 9926 Hazy Bnd Unit 104 San Antonio, TX | 3.0 | 2.5 | 1298 | $1,395 | $1.07 | 16d | 1 | 0.93mi |
| 9926 Hazy Bnd Unit 104 San Antonio, TX | 3.0 | 2.5 | 1298 | $1,395 | $1.07 | 43d | 1 | 0.93mi |
| 6811 Evercrest Ln San Antonio, TX | 3.0 | 2.5 | 1582 | $2,100 | $1.33 | 23d | 1 | 0.93mi |
| 18 Beacon Bay San Antonio, TX | 3.0 | 2.5 | 1441 | $1,695 | $1.18 | 43d | 1 | 0.93mi |
| 42 Beacon Bay San Antonio, TX | 3.0 | 2.5 | 1899 | $1,695 | $0.89 | 23d | 1 | 0.94mi |
| 9919 Grove Mist Unit 104 San Antonio, TX | 3.0 | 2.5 | 1300 | $1,425 | $1.10 | 7d | 1 | 0.95mi |
| 9919 Grove Mist Unit 4 San Antonio, TX | 3.0 | 2.5 | 1360 | $1,495 | $1.10 | 23d | 1 | 0.95mi |
| 6607 Shadden Oaks San Antonio, TX | 3.0 | 2.0 | 1525 | $1,800 | $1.18 | 23d | 1 | 0.95mi |
HOA detail
- Monthly dues
- $42 · $504/yr
- Likely covers
- pool
Listing history 35 events
-
2026-06-04days on market $189,000 Active 51 DOM
-
2026-06-03days on market $189,000 Active 50 DOM
-
2026-06-02days on market $189,000 Active 49 DOM
-
2026-06-01days on market $189,000 Active 48 DOM
-
2026-05-31days on market $189,000 Active 47 DOM
-
2026-04-14$189,000 Active 862-char remark
Show marketing remark (862 chars)
Step into this well-designed 3-bedroom, 2-bath home offering both space and functionality. Featuring two dining areas and two separate living spaces, this layout is perfect for entertaining, relaxing, or creating flexible work-from-home options. The open concept kitchen flows seamlessly into the main living area and offers abundant cabinet space, making storage and organization effortless. The interior utility room adds everyday convenience, while the spacious backyard provides plenty of room for outdoor gatherings, play, or future customization. Located in a desirable community with access to a neighborhood pool and tennis club, this home also offers unbeatable convenience, centrally positioned near Ft. Sam Houston, the airport, and Randolph Air Force Base. A perfect blend of comfort, space, and location! This home is ready to fit your lifestyle.
-
2026-02-12soldstatus
-
2025-02-19status Back on Market
-
2025-02-19historical
-
2024-12-19status Pending
-
2024-12-18historical
-
2024-12-05$200,000 New
-
2022-09-13historical
-
2022-08-31$280,000 New
-
2022-01-27status Pending
-
2022-01-27historical
-
2022-01-20$260,000 New
-
2017-10-26historical
-
2017-10-23status Back on Market
-
2017-08-14status Pending
-
2017-07-29historical Active Option
-
2017-06-14$169,900 New
-
2014-10-12historical
-
2014-05-14price $149,900 Price Change
-
2014-04-30$159,900 New
-
2014-02-01historical
-
2013-12-31price $140,000 Price Change
-
2013-11-12price $145,000 Price Change
-
2013-10-05price $155,000 Price Change
-
2013-09-20$160,000 New
-
2010-11-01historical
-
2010-03-26$128,700
-
2007-09-22historical
-
2007-05-06$135,900
-
1993-05-01soldstatus
ⓘ Source: listings_history table (triggers on properties + properties_extension) + one-shot
backfill from property_details.listing_events for pre-trigger history.
Tax reassessment forecast TX · Resets to sale price
- Current annual tax
- $5,540 · $462/mo
- Projected year-2 tax
- $5,540 · $462/mo
- Expected delta
- $0/yr ($0/mo · 0.0%)
ⓘ Screening estimate from a state-policy table — verify with the county assessor before closing.
Climate risk First Street
- Flood 6/10 Major FEMA zone X (unshaded) · 73% chance over 30 yrs
- Wildfire 2/10 Low
- Heat 8/10 Severe 7 d/yr ≥107°F today · 22 d/yr by 30 yrs out
- Wind 8/10 Severe 80% chance of damaging wind over 30 yrs
- Air quality 2/10 Low 0 unhealthy d/yr today · 1 by 30 yrs out
Nearby sold comps map
Loading sold comps map…
Walkable amenities ~0.75 mi
Loading nearby amenities…
Taxation est. · year 1
- Rental income
- $20,129
- − Mortgage interest
- −$10,587
- − Property taxes
- −$5,540
- − Insurance
- −$945
- − Repairs & maintenance
- −$1,610
- − Management
- −$1,610
- − HOA
- −$504
- − Depreciation
- −$5,498
- Taxable loss
- −$6,166
- Est. tax savings @ 24.0%
- +$1,480
- After-tax cash flow
- $-1,501/yr
For passive investors: Depreciation is non-cash, so a rental often shows a tax loss while cash-flowing — sheltering income. Rental losses are passive: they offset passive income freely, and up to $25,000/yr can offset ordinary (W-2) income if you actively participate and your MAGI is under $100k (phasing out to $0 by $150k); unused losses carry forward. On sale, claimed depreciation is recaptured at up to 25%, and gains may owe capital-gains tax (a 1031 exchange can defer both). Figures are a year-1 estimate at your 24.0% rate — not tax advice; consult a CPA.
Schools (NCES district)
- District
- North East ISD
- NCES district ID
- 4832940
- Math proficiency
- 38% ▼ -14.00%
- Reading proficiency
- 49% ▼ -4.00%
- Median HH income
- $57,715
- Composite
- 38.1/100
- National rank
- #4276
- State rank
- #276 of 826 in TX
Livability — San Antonio
- Score
- 80/100
- State rank
- #31
- US rank
- #1616
Category grades
Schools grade is shown separately in the Schools card above.
Census & demographics
- Census place
- San Antonio, TX
- County
- Bexar County · 1,990,555 people
- City population
- 1,806,925
- Metro
- San Antonio-New Braunfels, TX
- Population (ZIP)
- 28,609
- Household income
- $70,098
- Rent vs Own
- Severe rent burden
- 488.0
Population outlook (Bexar County) Hauer SSP2
- Today (2025)
- 2,336,851 people
- By 2030
- 2,560,728 · +9.6%
- By 2040
- 3,020,569 · +29.3%
- By 2050
- 3,493,522 · +49.5%
- By 2075
- 4,668,459 · +99.8%
- By 2100
- 5,533,242 · +136.8%
Race, ethnicity, and origin ACS 2023
- Neighborhood character
- Diverse neighborhood (Simpson 0.66)
- Race & ethnicity
- Hispanic / Latino 47% White 30% Two or more races 20% Black 16% Asian 4% Pacific Islander 2%
- Hispanic origin (detail)
- Mexican 38% Puerto Rican 4%
- Common ancestry
- Lithuanian 2% Romanian 1% Slovak 1%
- Foreign-born
- 13% · Canada, Vietnam, Jamaica
- Languages at home
- 72% English-only · Spanish 24% Vietnamese 1% Chinese 1%
Political lean MEDSL · Bexar
- 2024 margin
- Lean D (+9.8) · D 54.3% · R 44.6% · Other 1.1%
- 2008→2024 swing
- +4.2pp toward D · 2008: 5.6pp · 2024: 9.8pp
- All cycles
- 2024: D+9.8 2020: D+18.2 2016: D+13.5 2012: D+4.6 2008: D+5.6
Not yet ingested
- Civics
- —
Market trends
- HPI YoY
- ▼ -15.13%
- Current HPI
- 242.1272
- Rent YoY
- ▼ -1.05%
- Metro
- San Antonio-New Braunfels, TX
- State GDP YoY
- ▲ 3.95%
- F500 in state
- 110
Industry mix (Fortune 500 HQ in TX)
| Industry | F500 HQs | Revenue |
|---|---|---|
| Energy | 16 | $1,198B |
|
||
| Technology | 5 | $198B |
|
||
| Engineering / Construction | 4 | $72B |
|
||
| Energy Services | 3 | $60B |
|
||
| Utilities | 3 | $41B |
|
||
| Healthcare | 2 | $330B |
|
||
Price history
+39.1% since first listed30 events — show timeline
- 2026-04-14 Listed $189,000 NTREIS
- 2026-02-12 Sold (Public Records) — Public Records
- 2025-02-19 Relisted — LERA
- 2025-02-19 Listing Removed — LERA
- 2024-12-19 Pending — LERA
- 2024-12-18 Listing Removed — LERA
- 2024-12-05 Listed $200,000 LERA
- 2022-09-13 Listing Removed — LERA
- 2022-08-31 Listed $280,000 LERA
- 2022-01-27 Pending — LERA
- 2022-01-27 Listing Removed — LERA
- 2022-01-20 Listed $260,000 LERA
- 2017-10-26 Listing Removed — LERA
- 2017-10-23 Relisted — LERA
- 2017-08-14 Pending — LERA
- 2017-07-29 Contingent — LERA
- 2017-06-14 Listed $169,900 LERA
- 2014-10-12 Listing Removed — LERA
- 2014-05-14 Price Changed $149,900 LERA
- 2014-04-30 Listed $159,900 LERA
- 2014-02-01 Listing Removed — LERA
- 2013-12-31 Price Changed $140,000 LERA
- 2013-11-12 Price Changed $145,000 LERA
- 2013-10-05 Price Changed $155,000 LERA
- 2013-09-20 Listed $160,000 LERA
- 2010-11-01 Listing Removed — LERA
- 2010-03-26 Listed $128,700 LERA
- 2007-09-22 Listing Removed — LERA
- 2007-05-06 Listed $135,900 LERA
- 1993-05-01 Sold (Public Records) — Public Records
Property tax history
+3.7%/yrLatest (2025): $5,540 · +1.0% YoY. Source: county tax records.
Cash-flow waterfall
monthlySold comps — $/sqft
last 12 mo · ≤1 miLoading sold comps…