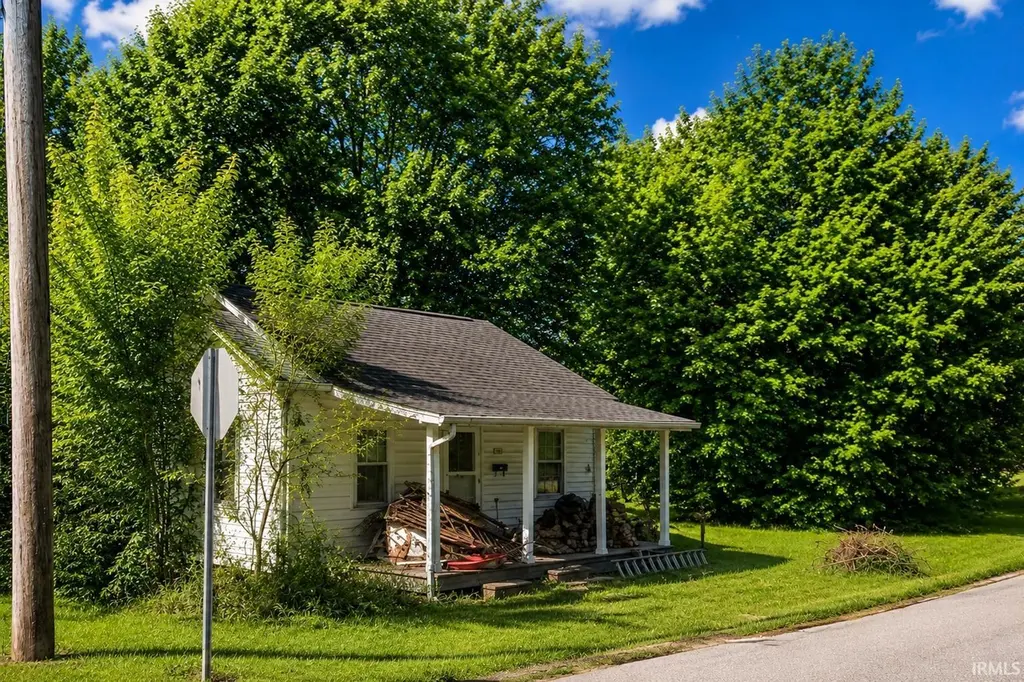
1709 E Sycamore St · Petersburg, IN
Flood risk 1/10 · Minimal
- FEMA flood zone
- X (unshaded)
- Chance of flooding over 30 yrs
- 0.0%
- Est. flood insurance / yr
- $473 – $860
Fire risk 1/10 · Minimal
- Est. fire insurance / yr
- $717 – $1,331
Heat risk 5/10 · Moderate
- Hot days now (above 106°F)
- 7 days/yr
- Hot days in 30 yrs
- 19 days/yr
Wind risk 2/10 · Minimal
- Chance of severe wind over 30 yrs
- 3.0%
Air-quality risk 4/10 · Minor
- Unhealthy air days now
- 3 days/yr
- Unhealthy air days in 30 yrs
- 5 days/yr
Risk factors via First Street. Map © Google.
Why this score? — see what drove the D grade
The composite is a weighted blend of 9 inputs, each scored 0–100. Each bar is that input's sub-score; the figure is the points it added to the 100-point composite (weight × sub-score).
- Cash flow +15.0/30.0
- ARV discount +7.5/15.0
- 1% rule +5.0/10.0
- DSCR +5.0/10.0
- Livability +3.4/5.0
- Schools +2.9/10.0
- Rent growth +2.5/5.0
- Condition / age +2.5/5.0
- Appreciation +0.0/10.0
$26,900
🖨 Deal sheet (PDF) 📄 Offer letter ✓ Due diligence
Listing remarks
Unlock the potential of this Petersburg property, offering a rare opportunity for a full renovation or new build on a generous 52x105 lot. The home features a solid shingle roof estimated at 15-20 years old and a full unfinished basement, providing a strong foundation for your vision. With the interior mostly gutted after a past fire, you have a blank slate to design and rebuild exactly as you wish. City water and sewer are available, and the property sits in a convenient location close to local schools. Whether you're looking to restore, reimagine, or start fresh, this property is ready for your creative plans. Seize the chance to transform this space and add value in a growing area.
Key facts
- New build
- City water and sewer
- Full renovation
Tags
Property features AI
Exterior
- Utilities: Public water; Public sewer
- Home design: Single-family site-built home; One-story
- Construction: Vinyl siding with asphalt components; Built as a site-built residence
- Exterior features: Level lot; Lot dimensions approximately 52 x 105
Interior
- Bathrooms: One full bathroom (main level)
- Heating & cooling: Natural gas forced-air heating; Central air conditioning
- Interior features: Full unfinished basement; Basement laundry area (in basement); Total of 2 rooms
- Laundry & utility: Laundry located in the basement
Neighborhood map
What this means for you Summary
Snapshot
- This is a 1-bed/1.0-bath single-family listed at $27k.
Deal economics
- At list price, monthly cash flow is $766 ($9k/yr) — positive.
- The deal already cash-flows at list — no discount required.
- Meets the 1% rule at list price ($1k rent vs $27k).
Location & tenants
- Location reads 68/100 on livability (#231 in IN) — a middle-class / working-renter tenant base. Strengths: crime A+, cost of living A+, housing A+; Watch: health & safety C-, amenities F, commute F.
- Pike County School Corporation (rural): math 29% / reading 39% proficiency, ranked #203 of 301 in IN (top 67%) — families likely to look elsewhere, expect single-tenant / working-renter base with shorter leases.
- Zoned schools: Petersburg Elementary School (math 32% / reading 32%, grade F, #652 of 994 statewide, top 68%, 458 students, 57% FRL); Pike Central Middle School (math 20% / reading 33%, grade F, #236 of 330 statewide, top 72%, 366 students, 49% FRL); Pike Central High School (math 32% / reading 57%, grade F, #169 of 369 statewide, top 51%, 475 students, 44% FRL) — zoned schools average 50% FRL vs 33% district-wide (18 pts higher); higher-poverty schools than district average — tighter screening recommended.
- Market conditions: 28 active listings in the ZIP; 7 units permitted in Pike County in 2024 (0 in 5+ unit buildings).
Forward outlook
- Local home prices are declining (-3.0%/yr); year-one equity from $186 of loan paydown is wiped out by about $807 of value loss. Plan a longer hold.
- Pike County population projected at -20% by 2050 — secular population decline; favor cash flow + early exit over multi-decade hold.
- At projected returns (-3.0% appreciation + 3.0% rent growth), your $8k cash investment doubles in ~1 year — after that, you're playing with house money.
Negotiation context
- Only 9 days on market — expect competitive offers; lowballing is unlikely to land.
- 2 sale attempts since 12y ago; this cycle's ask has dropped $3k (10%) from the opening price — seller is motivated, your offer sets the floor, not the list.
Risks & watch-outs
- Watch-outs: built in 1938 — expect roof / HVAC / electrical / plumbing capex.
- Climate carrying-cost: extreme-heat days projected 7→19/yr by 2055 (HVAC capex compounding) — expect insurance premiums to compound above CPI over the hold.
Questions for the listing agent
- Built in 1938 — when were the roof, HVAC, electrical panel, plumbing, and water heater last replaced?
- Is there a deadline driving the sale (1031 exchange, divorce, estate, relocation)? That informs how much negotiation room exists.
- Schools are F-rated, which usually means shorter tenancies and higher turnover. Who's the typical renter profile here, and what's been the actual vacancy rate?
- The area grade is low — what's the realistic commute time and amenity access for the typical tenant pool here? Any planned neighborhood developments (good or bad) we should know about?
- What's the average days-on-market for RENTAL listings here right now (not sales)? A rising rental-DOM trend means longer vacancies and softer asking-rent achievability than the comps imply.
- What's the recent tenant-quality profile in this submarket — average credit score on applications, eviction rate, late-payment / NSF rate, and stable-employment percentage? A property-management company in the area should have these aggregated.
- How much new for-sale + rental construction is in the pipeline within 1–3 miles? Heavy new supply typically softens prices + rents 12–24 months out; constrained supply supports both.
Investment metrics
- 1% rule
- 4.50% ✓
- Cap rate
- 40.48%
- Cash-on-cash
- 122.08%
- DSCR
- 6.43
- GRM
- 1.9
CMA / ARV
- ARV (on-the-fly)
- $183,456
- Comps found
- 8
Show comp detail 8 sales within ~0.75 mi
| Address | Dist | Beds/Ba | Sqft | Sold | Price | $/sf | Match |
|---|---|---|---|---|---|---|---|
| 1510 E Locust St | 0.09mi | 2/1.5 (+1) | 1,184 (-5%) | 10mo | $22,000 | $19 | 72 |
| 1410 E Poplar St | 0.28mi | 2/1.0 (+1) | 1,224 (-2%) | 8mo | $149,500 | $122 | 72 |
| 1501 E Locust St | 0.13mi | 2/1.0 (+1) | 1,176 (-6%) | 23mo | $50,000 | $43 | 61 |
| 308 S 6th St | 0.51mi | 2/1.0 (+1) | 1,128 (-10%) | 8mo | $165,900 | $147 | 49 |
| 512 S 5th St | 0.56mi | 2/2.0 (+1) | 1,128 (-10%) | 5mo | $180,000 | $160 | 45 |
| 305 E Maple St | 0.66mi | 2/1.0 (+1) | 1,176 (-6%) | 13mo | $49,900 | $42 | 44 |
| 414 S 5th St | 0.56mi | 2/2.0 (+1) | 1,086 (-13%) | 17mo | $181,500 | $167 | 29 |
| 410 S 5th St | 0.55mi | 2/2.0 (+1) | 1,086 (-13%) | 18mo | $175,000 | $161 | 29 |
Match score weights: distance 35% · size 25% · config 20% · recency 20%. Top-matched comps best support the ARV.
Projected returns pro-forma
-3.0% appreciation · 3.0% rent growth · sell at horizon
- IRR
- —
- Equity multiple
- 6.90×
- Total profit
- $44,466
- Equity at exit
- $4,011
- IRR
- —
- Equity multiple
- 14.50×
- Total profit
- $101,647
- Equity at exit
- $2,326
Cash invested: $7,532 (down + closing). Projections, not guarantees.
Landlord ↔ Tenant lean methodology
- Overall (STATE)
- 90 Strongly Landlord-Friendly
- State Indiana
- 90 Strongly Landlord-Friendly · R+11
- County
- — inherits STATE
- City
- — inherits STATE
ZIP-level market 47567
- Home prices YoY
- -5.7%
- Active inventory
- 28
- Price-to-rent
- 1.9×
Monthly cashflow live
- Estimated rent
- $1,210 medium interval (Pro) →
- Mortgage (P&I)
- −$141
- Tax from tax record
- −$38 /mo · $452/yr
- Insurance
- −$11
- HOA
- −$0
- Vacancy / Maint / Mgmt
- −$254
- Net cashflow
- $766
Break-even live
Sensitivity live
| Price | -10% $781 | -5% $774 | +0% $766 | +5% $759 | +10% $751 |
|---|---|---|---|---|---|
| Rent | -10% $671 | -5% $718 | +0% $766 | +5% $814 | +10% $862 |
| Rate | -1.0pp $780 | -0.5pp $773 | base $766 | +0.5pp $759 | +1.0pp $752 |
UW: 25.0% down · 7.5% · 30yr · 1.5% tax · 5.0% vac · 8.0% maint · 8.0% mgmt
Financing live
Cash to close
- Down payment
- $6,725
- Closing costs
- $807
- Reserves months
- —
- Total cash needed
- —
Loan-product check · same deal, 3 products live
Conventional
25% down · 7.5% · 30yr
- Down + closing
- —
- Monthly P&I
- —
- Monthly cashflow
- —
- DSCR
- —
- Eligible?
- —
Personal DTI + credit; lowest rate.
DSCR
20% down · 8.5% · 30yr
- Down + closing
- —
- Monthly P&I
- —
- Monthly cashflow
- —
- DSCR
- —
- Eligible?
- —
No personal income docs; deal must DSCR.
Hard money
10% down · 12.0% · 12mo
- Down + closing
- —
- Monthly P&I
- —
- Monthly cashflow
- —
- DSCR
- —
- Eligible?
- —
Short-term bridge; refi at stabilization.
Listing history 9 events
-
2026-06-19days on market $26,900 Active 9 DOM
-
2026-06-18days on market $26,900 Active 8 DOM
-
2026-06-17days on market $26,900 Active 7 DOM
-
2026-06-16days on market $26,900 Active 6 DOM
-
2026-06-16price $26,900 Active 5 DOM
-
2026-06-15days on market $29,900 Active 5 DOM
-
2026-06-14days on market $29,900 Active 3 DOM
-
2026-06-12remarks 693-char remark
-
2026-06-12$29,900 Active 2 DOM
ⓘ Source: listings_history table (triggers on properties + properties_extension) + one-shot
backfill from property_details.listing_events for pre-trigger history.
Tax reassessment forecast IN · Partial reset (capped growth)
- Current annual tax
- $452 · $38/mo
- Projected year-2 tax
- $452 · $38/mo
- Expected delta
- $0/yr ($0/mo · 0.0%)
ⓘ Screening estimate from a state-policy table — verify with the county assessor before closing.
Climate risk First Street
- Flood 1/10 Low FEMA zone X (unshaded) · 0% chance over 30 yrs
- Wildfire 1/10 Low
- Heat 5/10 Major 7 d/yr ≥106°F today · 19 d/yr by 30 yrs out
- Wind 2/10 Low 3% chance of damaging wind over 30 yrs
- Air quality 4/10 Moderate 3 unhealthy d/yr today · 5 by 30 yrs out
Nearby sold comps map
Loading sold comps map…
Walkable amenities ~0.75 mi
Loading nearby amenities…
Taxation est. · year 1
- Rental income
- $14,525
- − Mortgage interest
- −$1,507
- − Property taxes
- −$452
- − Insurance
- −$134
- − Repairs & maintenance
- −$1,162
- − Management
- −$1,162
- − Depreciation
- −$783
- Taxable income
- $9,325
- Est. tax owed @ 24.0%
- −$2,238
- After-tax cash flow
- $6,957/yr
For passive investors: Depreciation is non-cash, so a rental often shows a tax loss while cash-flowing — sheltering income. Rental losses are passive: they offset passive income freely, and up to $25,000/yr can offset ordinary (W-2) income if you actively participate and your MAGI is under $100k (phasing out to $0 by $150k); unused losses carry forward. On sale, claimed depreciation is recaptured at up to 25%, and gains may owe capital-gains tax (a 1031 exchange can defer both). Figures are a year-1 estimate at your 24.0% rate — not tax advice; consult a CPA.
Schools (NCES district)
- District
- Pike County School Corporation
- NCES district ID
- 1808900
- Math proficiency
- 29% ▼ -6.00%
- Reading proficiency
- 39% ▼ -2.00%
- Median HH income
- $43,646
- Composite
- 28.88/100
- National rank
- #6642
- State rank
- #203 of 301 in IN
Livability — Petersburg
- Score
- 68/100
- State rank
- #231
- US rank
- #9979
Category grades
Schools grade is shown separately in the Schools card above.
Census & demographics
- Census place
- Petersburg, IN
- Population (ZIP)
- 6,187
Population outlook (Pike County) Hauer SSP2
- Today (2025)
- 11,816 people
- By 2030
- 11,348 · -4.0%
- By 2040
- 10,351 · -12.4%
- By 2050
- 9,410 · -20.4%
- By 2075
- 7,638 · -35.4%
- By 2100
- 6,118 · -48.2%
Race, ethnicity, and origin ACS 2023
- Neighborhood character
- Predominantly White (96%)
- Race & ethnicity
- White 96% Native American 2% Two or more races 1%
- Common ancestry
- Slovak 3% Portuguese 2% Serbian 1%
- Foreign-born
- 1% · Canada
Political lean MEDSL · Pike
- 2024 margin
- Solid R (+54.9) · D 21.9% · R 76.7% · Other 1.4%
- 2008→2024 swing
- -46.2pp toward R · 2008: -8.6pp · 2024: -54.9pp
- All cycles
- 2024: R+54.9 2020: R+52.7 2016: R+51.9 2012: R+25.4 2008: R+8.6
Not yet ingested
- Civics
- —
Market trends
- HPI YoY
- ▼ -12.97%
- Current HPI
- 216.028
- Rent YoY
- —
- Metro
- —
- State GDP YoY
- ▲ 2.90%
- F500 in state
- 18
Industry mix (Fortune 500 HQ in IN)
| Industry | F500 HQs | Revenue |
|---|---|---|
| Industrial Machinery | 2 | $37B |
|
||
| Healthcare | 1 | $177B |
|
||
| Pharmaceuticals | 1 | $45B |
|
||
| Metals / Steel | 1 | $18B |
|
||
| Agriculture | 1 | $17B |
|
||
| Packaging | 1 | $12B |
|
||
Price history
+13.3% since first listed2 events — show timeline
- 2026-06-10 Listed $29,900 IRMLS
- 2014-08-01 Listed $26,400 IRMLS
Property tax history
-6.8%/yrLatest (2024): $452 · +4.4% YoY. Source: county tax records.
Cash-flow waterfall
monthlySold comps — $/sqft
last 12 mo · ≤1 miLoading sold comps…