2 Ave E · McGill, NV
Flood risk 1/10 · Minimal
- FEMA flood zone
- X (unshaded)
- Chance of flooding over 30 yrs
- 0.0%
- Est. flood insurance / yr
- $507 – $1,088
Fire risk 5/10 · Moderate
- Est. fire insurance / yr
- $490 – $910
Heat risk 2/10 · Minimal
- Hot days now (above 85°F)
- 9 days/yr
- Hot days in 30 yrs
- 29 days/yr
Wind risk 1/10 · Minimal
- Chance of severe wind over 30 yrs
- —
Air-quality risk 2/10 · Minimal
- Unhealthy air days now
- 1 days/yr
- Unhealthy air days in 30 yrs
- 1 days/yr
Risk factors via First Street. Map © Google.
Why this score? — see what drove the B grade
The composite is a weighted blend of 9 inputs, each scored 0–100. Each bar is that input's sub-score; the figure is the points it added to the 100-point composite (weight × sub-score).
- Cash flow +30.0/30.0
- 1% rule +10.0/10.0
- DSCR +10.0/10.0
- ARV discount +7.5/15.0
- Appreciation +5.9/10.0
- Livability +3.2/5.0
- Rent growth +2.5/5.0
- Schools +2.4/10.0
- Condition / age +1.0/5.0
$56,900
🖨 Deal sheet (PDF) 📄 Offer letter ✓ Due diligence
Listing remarks MLS
Located on a corner lot in the quiet hillside area of McGill, this home is full of potential and ready for your vision as an excellent investment opportunity or a path to homeownership through hands-on work and strategic renovations. A generous sized yard with trees awaits creativity. Priced to sell.
Key facts
- Hillside area
- Generous sized yard
- Corner lot
Tags
Neighborhood map
What this means for you Summary
Snapshot
- This is a 3-bed/1.0-bath single-family listed at $57k. Condition is rated poor.
Deal economics
- At list price, monthly cash flow is $699 ($8k/yr) — positive.
- The deal already cash-flows at list — no discount required.
- Meets the 1% rule at list price ($1k rent vs $57k).
- Recommended offer: $50k (12.0% below list) — sets the bar for market timing.
Location & tenants
- Location reads 63/100 on livability (#55 in NV) — a middle-class / working-renter tenant base. Strengths: cost of living A+, housing A+; Watch: health & safety C-, schools F, crime F.
- White Pine County School District (town): math 22% / reading 33% proficiency, ranked #13 of 17 in NV (top 76%) — low school quality limits family demand, transient renter base, plan for 1-2y turnover.
- Market conditions: 15 active listings in the ZIP; 10 units permitted in White Pine County in 2024 (0 in 5+ unit buildings).
Forward outlook
- In year one you build about $1k of equity ($393 loan paydown + $1k appreciation (1.8% local appreciation)).
- White Pine County population projected to shrink 4% by 2050 — rents likely to lag national; underwrite the cash flow, not the appreciation.
- At projected returns (1.8% appreciation + 3.0% rent growth), your $16k cash investment doubles in ~2 years — after that, you're playing with house money.
Negotiation context
- It's been on market 185 days — a 12% lower offer ($50k) is reasonable based on typical stale-listing flexibility.
- 2 sale attempts; this cycle's ask has dropped $5k (8%) from the opening price — seller is motivated, your offer sets the floor, not the list.
Risks & watch-outs
- Watch-outs: built in 1930 — expect roof / HVAC / electrical / plumbing capex.
- Climate carrying-cost: moderate wildfire risk — expect insurance premiums to compound above CPI over the hold.
Questions for the listing agent
- It's been on market 185 days. Have you received any prior offers? Is the seller open to a 12% concession, seller financing, or rate buy-down credit?
- Have any recent inspections been done? Can we get a copy of the seller's disclosures and any deferred-maintenance estimates?
- Built in 1930 — when were the roof, HVAC, electrical panel, plumbing, and water heater last replaced?
- Why hasn't it sold? Are there any deal-killer items the seller is aware of (foundation, flood, title, zoning, code violations)?
- Is there a deadline driving the sale (1031 exchange, divorce, estate, relocation)? That informs how much negotiation room exists.
- Schools are F-rated, which usually means shorter tenancies and higher turnover. Who's the typical renter profile here, and what's been the actual vacancy rate?
- Crime grade is F in this area — have there been break-ins, vandalism, or insurance claims at this property in the last 3 years? What carrier currently insures it and at what premium?
- What's the average days-on-market for RENTAL listings here right now (not sales)? A rising rental-DOM trend means longer vacancies and softer asking-rent achievability than the comps imply.
- What's the recent tenant-quality profile in this submarket — average credit score on applications, eviction rate, late-payment / NSF rate, and stable-employment percentage? A property-management company in the area should have these aggregated.
- How much new for-sale + rental construction is in the pipeline within 1–3 miles? Heavy new supply typically softens prices + rents 12–24 months out; constrained supply supports both.
Investment metrics
- 1% rule
- 2.43% ✓
- Cap rate
- 21.03%
- Cash-on-cash
- 52.64%
- DSCR
- 3.34
- GRM
- 3.4
CMA / ARV
- ARV (median comp)
- $137,964
- List price
- $56,900
- Delta
- -58.76%
- Verdict
- UNDERPRICED
- Comps
- 20 within 1.0 mi
Show comp detail 12 sales within ~0.75 mi
| Address | Dist | Beds/Ba | Sqft | Sold | Price | $/sf | Match |
|---|---|---|---|---|---|---|---|
| 1 Avenue F | 0.03mi | 3/1.0 | 1,062 (+1%) | 13mo | $135,000 | $127 | 87 |
| 13 Avenue B | 0.24mi | 2/1.0 (-1) | 1,064 (+1%) | 2mo | $166,000 | $156 | 81 |
| 12 E Ave | 0.05mi | 2/1.0 (-1) | 1,107 (+5%) | 10mo | $135,000 | $122 | 77 |
| 30 Avenue F | 0.19mi | 2/1.0 (-1) | 1,134 (+7%) | 4mo | $200,000 | $176 | 70 |
| 53 First St | 0.16mi | 2/1.0 (-1) | 945 (-10%) | 1mo | $135,000 | $143 | 69 |
| 14 Avenue G | 0.27mi | 2/1.0 (-1) | 1,107 (+5%) | 8mo | $121,000 | $109 | 67 |
| 21 Avenue I | 0.43mi | 3/1.0 | 1,038 (-2%) | 12mo | $150,000 | $145 | 67 |
| 25 Avenue E | 0.13mi | 2/1.0 (-1) | 1,148 (+9%) | 12mo | $180,000 | $157 | 64 |
| 49 Fourth | 0.41mi | 3/1.0 | 1,134 (+7%) | 7mo | $176,000 | $155 | 63 |
| 11 Avenue I | 0.38mi | 3/1.0 | 1,134 (+7%) | 11mo | $73,000 | $64 | 61 |
| 47 Fourth St | 0.42mi | 3/1.0 | 1,148 (+9%) | 14mo | $129,000 | $112 | 55 |
| 7 First St | 0.48mi | 2/1.0 (-1) | 1,134 (+7%) | 8mo | $168,000 | $148 | 53 |
Match score weights: distance 35% · size 25% · config 20% · recency 20%. Top-matched comps best support the ARV.
Projected returns pro-forma
1.78% appreciation · 3.0% rent growth · sell at horizon
- IRR
- 56.3%
- Equity multiple
- 4.00×
- Total profit
- $47,811
- Equity at exit
- $21,780
- IRR
- 57.0%
- Equity multiple
- 8.06×
- Total profit
- $112,536
- Equity at exit
- $30,863
Cash invested: $15,932 (down + closing). Projections, not guarantees.
Landlord ↔ Tenant lean methodology
- Overall (STATE)
- 71 Landlord-Friendly
- State Nevada
- 71 Landlord-Friendly · R+1
- County
- — inherits STATE
- City
- — inherits STATE
ZIP-level market 89318
- Home prices YoY
- 1.1%
- Active inventory
- 15
- Price-to-rent
- 3.4×
Monthly cashflow live
- Estimated rent
- $1,382 medium interval (Pro) →
- Mortgage (P&I)
- −$298
- Tax est. 1.5%
- −$71 /mo · $854/yr
- Insurance
- −$24
- HOA
- −$0
- Vacancy / Maint / Mgmt
- −$290
- Net cashflow
- $699
Break-even live
Sensitivity live
| Price | -10% $738 | -5% $719 | +0% $699 | +5% $679 | +10% $660 |
|---|---|---|---|---|---|
| Rent | -10% $590 | -5% $644 | +0% $699 | +5% $753 | +10% $808 |
| Rate | -1.0pp $728 | -0.5pp $713 | base $699 | +0.5pp $684 | +1.0pp $669 |
UW: 25.0% down · 7.5% · 30yr · 1.5% tax · 5.0% vac · 8.0% maint · 8.0% mgmt
Financing live
Cash to close
- Down payment
- $14,225
- Closing costs
- $1,707
- Reserves months
- —
- Total cash needed
- —
Loan-product check · same deal, 3 products live
Conventional
25% down · 7.5% · 30yr
- Down + closing
- —
- Monthly P&I
- —
- Monthly cashflow
- —
- DSCR
- —
- Eligible?
- —
Personal DTI + credit; lowest rate.
DSCR
20% down · 8.5% · 30yr
- Down + closing
- —
- Monthly P&I
- —
- Monthly cashflow
- —
- DSCR
- —
- Eligible?
- —
No personal income docs; deal must DSCR.
Hard money
10% down · 12.0% · 12mo
- Down + closing
- —
- Monthly P&I
- —
- Monthly cashflow
- —
- DSCR
- —
- Eligible?
- —
Short-term bridge; refi at stabilization.
Listing history 20 events
-
2026-06-17days on market $56,900 Active 185 DOM
-
2026-06-16days on market $56,900 Active 184 DOM
-
2026-06-15days on market $56,900 Active 183 DOM
-
2026-06-14days on market $56,900 Active 181 DOM
-
2026-06-12days on market $56,900 Active 180 DOM
-
2026-06-09days on market $56,900 Active 177 DOM
-
2026-06-08days on market $56,900 Active 176 DOM
-
2026-06-07days on market $56,900 Active 175 DOM
-
2026-06-05days on market $56,900 Active 173 DOM
-
2026-06-04days on market $56,900 Active 171 DOM
-
2026-06-02days on market $56,900 Active 170 DOM
-
2026-06-01days on market $56,900 Active 169 DOM
-
2026-05-31days on market $56,900 Active 168 DOM
-
2026-05-31days on market $56,900 Active 167 DOM
-
2026-02-24price $56,900 301-char remark
Show marketing remark (301 chars)
Located on a corner lot in the quiet hillside area of McGill, this home is full of potential and ready for your vision as an excellent investment opportunity or a path to homeownership through hands-on work and strategic renovations. A generous sized yard with trees awaits creativity. Priced to sell.
-
2025-12-13$61,900 Active 301-char remark
Show marketing remark (301 chars)
Located on a corner lot in the quiet hillside area of McGill, this home is full of potential and ready for your vision as an excellent investment opportunity or a path to homeownership through hands-on work and strategic renovations. A generous sized yard with trees awaits creativity. Priced to sell.
-
2025-12-05historical
-
2025-09-05price $59,000
-
2025-08-01price $69,000
-
2025-05-26$79,000 Active
ⓘ Source: listings_history table (triggers on properties + properties_extension) + one-shot
backfill from property_details.listing_events for pre-trigger history.
Climate risk First Street
- Flood 1/10 Low FEMA zone X (unshaded) · 0% chance over 30 yrs
- Wildfire 5/10 Major
- Heat 2/10 Low 9 d/yr ≥85°F today · 29 d/yr by 30 yrs out
- Wind 1/10 Low
- Air quality 2/10 Low 1 unhealthy d/yr today · 1 by 30 yrs out
Nearby sold comps map
Loading sold comps map…
Walkable amenities ~0.75 mi
Loading nearby amenities…
Taxation est. · year 1
- Rental income
- $16,589
- − Mortgage interest
- −$3,187
- − Property taxes
- −$854
- − Insurance
- −$284
- − Repairs & maintenance
- −$1,327
- − Management
- −$1,327
- − Depreciation
- −$1,655
- Taxable income
- $7,954
- Est. tax owed @ 24.0%
- −$1,909
- After-tax cash flow
- $6,478/yr
For passive investors: Depreciation is non-cash, so a rental often shows a tax loss while cash-flowing — sheltering income. Rental losses are passive: they offset passive income freely, and up to $25,000/yr can offset ordinary (W-2) income if you actively participate and your MAGI is under $100k (phasing out to $0 by $150k); unused losses carry forward. On sale, claimed depreciation is recaptured at up to 25%, and gains may owe capital-gains tax (a 1031 exchange can defer both). Figures are a year-1 estimate at your 24.0% rate — not tax advice; consult a CPA.
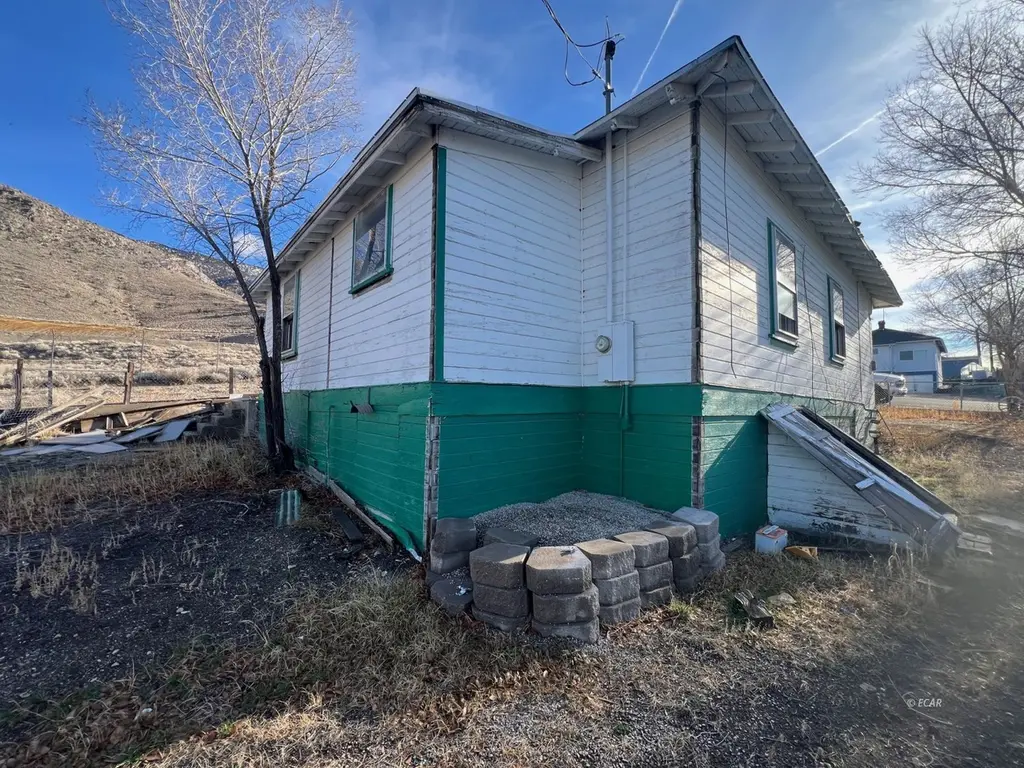
Condition & rehab AI · 11 photos
This property requires extensive repairs and renovations to become move-in ready. Significant structural and exterior work is needed to stabilize the home and improve its curb appeal.
Repairs flagged
- Major Exterior siding — Peeling and damaged
- Major Foundation — Exposed and in poor condition
- Major Interior walls — Exposed and unfinished
- Major Bathroom — Exposed plumbing and missing fixtures
- Major Flooring — Exposed and unfinished
- Major Roof — Visible damage
Value-add opportunities
- Both Exterior siding repair and replacement — Improves curb appeal and structural integrity
- Both Foundation repair — Stabilizes the structure and prevents further damage
- Both Interior wall repair and finishing — Enhances the living space and adds value
- Both Bathroom renovation — Creates a functional and attractive space
- Both Flooring installation — Provides a finished and durable surface
- Both Roof repair — Prevents water damage and enhances the home's appearance
Renovation cost estimate screening
| Repair item | Severity | Est. cost |
|---|---|---|
| Exterior siding · Peeling and damaged | Major | $15,000–50,000 |
| Foundation · Exposed and in poor condition | Major | $15,000–50,000 |
| Interior walls · Exposed and unfinished | Major | $15,000–50,000 |
| Bathroom · Exposed plumbing and missing fixtures | Major | $15,000–50,000 |
| Flooring · Exposed and unfinished | Major | $15,000–50,000 |
| Roof · Visible damage | Major | $15,000–50,000 |
| Total estimated repair cost · 6 items | $90,000–300,000 |
Value-add ROI direction
- Both Exterior siding repair and replacement — Improves curb appeal and structural integrity ↑
- Both Foundation repair — Stabilizes the structure and prevents further damage ↑
- Both Interior wall repair and finishing — Enhances the living space and adds value ↑
- Both Bathroom renovation — Creates a functional and attractive space ↑
- Both Flooring installation — Provides a finished and durable surface ↑
- Both Roof repair — Prevents water damage and enhances the home's appearance ↑
ⓘ Cost ranges are severity-bucket heuristics (US national rule-of-thumb). Get contractor quotes + a written scope before underwriting a rehab budget.
Schools (NCES district)
- District
- White Pine County School District
- NCES district ID
- 3200510
- Math proficiency
- 22% ▼ -1.00%
- Reading proficiency
- 33% ▬ 0.00%
- Median HH income
- $52,545
- Composite
- 24.33/100
- National rank
- #7704
- State rank
- #13 of 17 in NV
Livability — McGill
- Score
- 63/100
- State rank
- #55
- US rank
- #15231
Category grades
Schools grade is shown separately in the Schools card above.
Census & demographics
- Census place
- McGill, NV
- Population (ZIP)
- 1,043
Population outlook (White Pine County) Hauer SSP2
- Today (2025)
- 9,244 people
- By 2030
- 9,022 · -2.4%
- By 2040
- 8,884 · -3.9%
- By 2050
- 8,839 · -4.4%
- By 2075
- 8,772 · -5.1%
- By 2100
- 8,073 · -12.7%
Race, ethnicity, and origin ACS 2023
- Neighborhood character
- Predominantly White (78%)
- Race & ethnicity
- White 78% Hispanic / Latino 12% Native American 9% Two or more races 2%
- Hispanic origin (detail)
- Mexican 12%
- Common ancestry
- Slovak 8% Italian 8%
- Foreign-born
- 2%
- Languages at home
- 98% English-only · German/W. Germanic 2%
Political lean MEDSL · White Pine
- 2024 margin
- Solid R (+57.0) · D 20.3% · R 77.3% · Other 2.4%
- 2008→2024 swing
- -25.0pp toward R · 2008: -32.1pp · 2024: -57.0pp
- All cycles
- 2024: R+57.0 2020: R+58.2 2016: R+53.4 2012: R+43.7 2008: R+32.1
Not yet ingested
- Civics
- —
Market trends
- HPI YoY
- ▲ 1.78%
- Current HPI
- 168.3944
- Rent YoY
- —
- Metro
- —
- State GDP YoY
- ▲ 3.08%
- F500 in state
- 6
Industry mix (Fortune 500 HQ in NV)
| Industry | F500 HQs | Revenue |
|---|---|---|
| Hotels / Casinos | 3 | $36B |
|
||
Price history
-28.0% since first listed6 events — show timeline
- 2026-02-24 Price Changed $56,900 ECRMLS
- 2025-12-13 Listed $61,900 ECRMLS
- 2025-12-05 Listing Removed — GLVAR
- 2025-09-05 Price Changed $59,000 GLVAR
- 2025-08-01 Price Changed $69,000 GLVAR
- 2025-05-26 Listed $79,000 GLVAR
Cash-flow waterfall
monthlySold comps — $/sqft
last 12 mo · ≤1 miLoading sold comps…