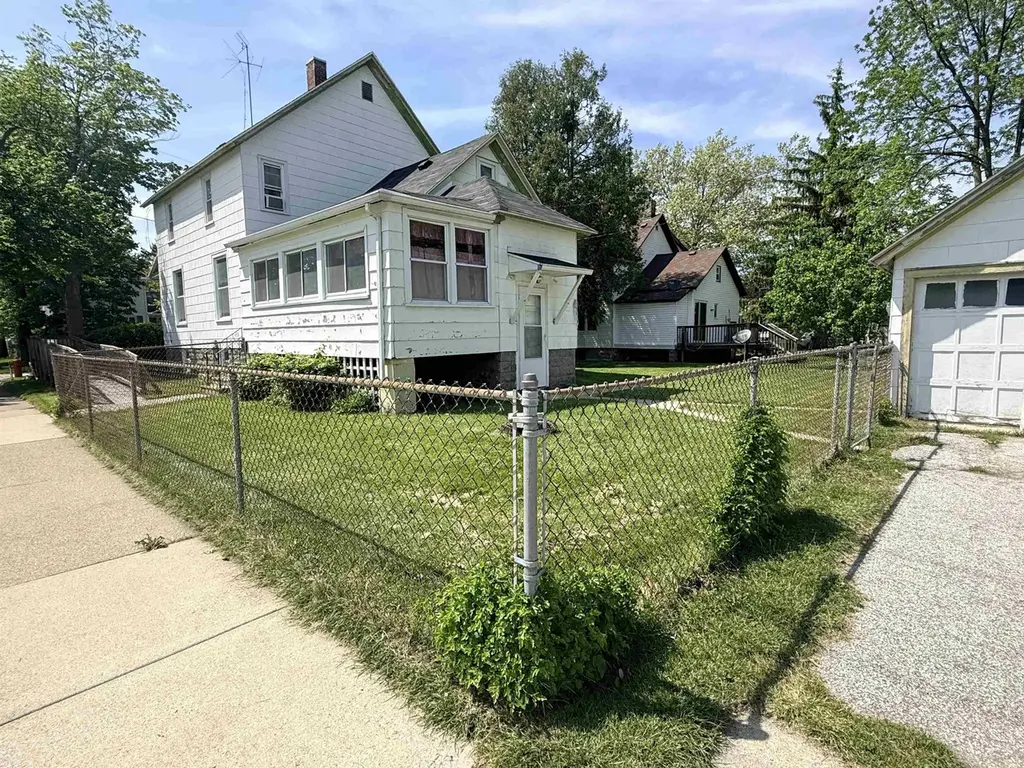
225 Ingraham St · Bay City, MI
Flood risk 1/10 · Minimal
- FEMA flood zone
- X (unshaded)
- Chance of flooding over 30 yrs
- 0.0%
- Est. flood insurance / yr
- $473 – $860
Fire risk 1/10 · Minimal
- Est. fire insurance / yr
- $784 – $1,456
Heat risk 2/10 · Minimal
- Hot days now (above 97°F)
- 7 days/yr
- Hot days in 30 yrs
- 14 days/yr
Wind risk 1/10 · Minimal
- Chance of severe wind over 30 yrs
- —
Air-quality risk 2/10 · Minimal
- Unhealthy air days now
- 1 days/yr
- Unhealthy air days in 30 yrs
- 2 days/yr
Risk factors via First Street. Map © Google.
Why this score? — see what drove the B+ grade
The composite is a weighted blend of 9 inputs, each scored 0–100. Each bar is that input's sub-score; the figure is the points it added to the 100-point composite (weight × sub-score).
- Cash flow +30.0/30.0
- ARV discount +15.0/15.0
- DSCR +10.0/10.0
- 1% rule +9.5/10.0
- Livability +3.4/5.0
- Schools +2.8/10.0
- Rent growth +2.5/5.0
- Condition / age +2.5/5.0
- Appreciation +0.0/10.0
$99,900
🖨 Deal sheet 📄 Offer letter ✓ Due diligence
Listing remarks
Cherished Family Home on Prime Bay City Corner Lot For the first time in generations, 225 Ingraham St is ready to welcome a new family. This charming 4-bedroom, 2-bathroom residence has been tightly held by the same family for years, preserving its warmth and ensuring it was never subjected to typical rental wear-and-tear. Spanning across two functional levels, the unique blueprint grants the top floor (2 bedrooms, 1 bath) its own private exterior entryway, yielding a world of possibilities for independent living setups. Valuable mechanical updates include vinyl replacement windows and a fresh new roof installed over half the home and the garage structure. From morning coffee on the spacio
Key facts
- Fresh new roof
- Fenced corner yard
- Spacious sunporch
Tags
Property features AI
Exterior
- Parking: Detached 2-car garage; Paved driveway
- Utilities: Public water; Public sanitary sewer; Natural gas service
- Home design: Residential property; 1 1/2-story structure; Built in 1900
- Construction: Asbestos exterior construction; Basement foundation
- Exterior features: Fenced yard; Corner lot; Road frontage
Interior
- Kitchen: Kitchen on first floor — 12 x 15, carpeted
- Bedrooms: Bedroom 1 (first floor) — 12 x 10, carpet; Bedroom 2 (first floor) — 10 x 10, carpet; Bedroom 3 (upper) — approx. 10 ft wide, carpet; Bedroom 4 (upper) — 12 x 8, carpet
- Flooring: Carpet in living areas and bedrooms; Vinyl in bathrooms
- Bathrooms: Two full bathrooms; Main bath (first floor) — vinyl flooring; Second bath (upper) — vinyl flooring
- Heating & cooling: Forced air heating (natural gas fuel); Ceiling fans and window-mounted air conditioning units
- Interior features: First-floor master bedroom; First-floor full bathroom; First-floor laundry; Full basement (block foundation)
- Laundry & utility: First-floor laundry; Gas water heater
Neighborhood map
What this means for you Summary
Snapshot
- This is a 4-bed/2.0-bath single-family listed at $100k.
Deal economics
- At list price, monthly cash flow is $464 ($6k/yr) — positive.
- The deal already cash-flows at list — no discount required.
- Meets the 1% rule at list price ($1k rent vs $100k).
- Recommended offer: $98k (1.5% below list) — sets the bar for market timing.
- Cap rate 11.9% vs local median 5.5% in Bay City — top-decile yield for the area; either an underpriced asset or a hidden risk that comps aren't pricing in. Stress-test before assuming the spread holds.
Location & tenants
- Location reads 68/100 on livability (#360 in MI) — a middle-class / working-renter tenant base. Strengths: cost of living A+, housing A+, health & safety A+; Watch: schools D+, amenities D, crime F.
- Bay City School District (urban): math 27% / reading 40% proficiency, ranked #317 of 540 in MI (top 59%) — families likely to look elsewhere, expect single-tenant / working-renter base with shorter leases.
- Market conditions: 148 active listings in the ZIP; 39 units permitted in Bay County in 2024 (0 in 5+ unit buildings).
- This rent runs 34% of the median local income ($51k/yr) — at the standard rent-burdened threshold; future hikes will face affordability resistance.
Forward outlook
- Local home prices are declining (-3.0%/yr); year-one equity from $691 of loan paydown is wiped out by about $3k of value loss. Plan a longer hold.
- Bay County population projected at -21% by 2050 — secular population decline; favor cash flow + early exit over multi-decade hold.
- At projected returns (-3.0% appreciation + 3.0% rent growth), your $28k cash investment doubles in ~7 years — after that, you're playing with house money.
Negotiation context
- It's been on market 24 days — a 2% lower offer ($98k) is reasonable based on typical stale-listing flexibility.
- Current owner paid $27k; list at $100k implies a 270% gain — meaningful room to come down on a strong offer.
Risks & watch-outs
- Watch-outs: built in 1900 — expect roof / HVAC / electrical / plumbing capex.
Questions for the listing agent
- Built in 1900 — when were the roof, HVAC, electrical panel, plumbing, and water heater last replaced?
- Is there a deadline driving the sale (1031 exchange, divorce, estate, relocation)? That informs how much negotiation room exists.
- Schools are D-rated, which usually means shorter tenancies and higher turnover. Who's the typical renter profile here, and what's been the actual vacancy rate?
- Crime grade is F in this area — have there been break-ins, vandalism, or insurance claims at this property in the last 3 years? What carrier currently insures it and at what premium?
- What's the average days-on-market for RENTAL listings here right now (not sales)? A rising rental-DOM trend means longer vacancies and softer asking-rent achievability than the comps imply.
- What's the recent tenant-quality profile in this submarket — average credit score on applications, eviction rate, late-payment / NSF rate, and stable-employment percentage? A property-management company in the area should have these aggregated.
- How much new for-sale + rental construction is in the pipeline within 1–3 miles? Heavy new supply typically softens prices + rents 12–24 months out; constrained supply supports both.
Investment metrics
- 1% rule
- 1.45% ✓
- Cap rate
- 11.86%
- Cash-on-cash
- 19.89%
- DSCR
- 1.88
- GRM
- 5.8
CMA / ARV
- ARV (on-the-fly)
- $135,240
- Comps found
- 12
Show comp detail 12 sales within ~0.75 mi
| Address | Dist | Beds/Ba | Sqft | Sold | Price | $/sf | Match |
|---|---|---|---|---|---|---|---|
| 1713 Marsac St | 0.23mi | 3/2.0 (-1) | 1,325 (-10%) | 8mo | $120,000 | $91 | 61 |
| 1510 Stanton St | 0.31mi | 3/1.0 (-1) | 1,380 (-6%) | 10mo | $133,000 | $96 | 58 |
| 1423 Stanton St | 0.35mi | 3/1.0 (-1) | 1,310 (-11%) | 2mo | $113,650 | $87 | 55 |
| 513 31st St | 0.49mi | 4/2.0 | 1,662 (+13%) | 6mo | $95,000 | $57 | 50 |
| 1300 Lisk Dr | 0.69mi | 3/2.0 (-1) | 1,432 (-3%) | 11mo | $169,000 | $118 | 50 |
| 907 Stanon St | 0.64mi | 3/1.0 (-1) | 1,401 (-5%) | 8mo | $23,000 | $16 | 47 |
| 1913 Michigan Ave | 0.64mi | 4/1.5 | 1,638 (+11%) | 3mo | $165,000 | $101 | 47 |
| 1106 Marsac St | 0.60mi | 3/1.0 (-1) | 1,378 (-6%) | 10mo | $80,000 | $58 | 45 |
| 2818 Fides Ct | 0.67mi | 3/2.0 (-1) | 1,573 (+7%) | 10mo | $250,000 | $159 | 44 |
| 1617 Broadway St | 0.54mi | 3/1.0 (-1) | 1,267 (-14%) | 7mo | $70,000 | $55 | 37 |
| 900 Jennison St | 0.67mi | 4/2.0 | 1,681 (+14%) | 10mo | $168,000 | $100 | 36 |
| 2501 S Jefferson St | 0.58mi | 4/1.0 | 1,252 (-15%) | 12mo | $115,600 | $92 | 34 |
Match score weights: distance 35% · size 25% · config 20% · recency 20%. Top-matched comps best support the ARV.
Projected returns pro-forma
-3.0% appreciation · 3.0% rent growth · sell at horizon
- IRR
- 12.0%
- Equity multiple
- 1.48×
- Total profit
- $13,355
- Equity at exit
- $14,895
- IRR
- 21.0%
- Equity multiple
- 2.78×
- Total profit
- $49,713
- Equity at exit
- $8,638
Cash invested: $27,972 (down + closing). Projections, not guarantees.
Landlord ↔ Tenant lean methodology
- Overall (STATE)
- 62 Landlord-Friendly
- State Michigan
- 62 Landlord-Friendly · EVEN
- County
- — inherits STATE
- City
- — inherits STATE
ZIP-level market 48708
- Home prices YoY
- -30.9%
- Active inventory
- 148
- Price-to-rent
- 5.8×
Monthly cashflow live
- Estimated rent
- $1,446 medium interval (Pro) →
- Mortgage (P&I)
- −$524
- Tax from tax record
- −$113 /mo · $1,360/yr
- Insurance
- −$42
- HOA
- −$0
- Vacancy / Maint / Mgmt
- −$304
- Net cashflow
- $464
Break-even live
UW: 25.0% down · 7.5% · 30yr · 1.5% tax · 5.0% vac · 8.0% maint · 8.0% mgmt
Financing live
Cash to close
- Down payment
- $24,975
- Closing costs
- $2,997
- Reserves months
- —
- Total cash needed
- —
Loan-product check · same deal, 3 products live
Conventional
25% down · 7.5% · 30yr
- Down + closing
- —
- Monthly P&I
- —
- Monthly cashflow
- —
- DSCR
- —
- Eligible?
- —
Personal DTI + credit; lowest rate.
DSCR
20% down · 8.5% · 30yr
- Down + closing
- —
- Monthly P&I
- —
- Monthly cashflow
- —
- DSCR
- —
- Eligible?
- —
No personal income docs; deal must DSCR.
Hard money
10% down · 12.0% · 12mo
- Down + closing
- —
- Monthly P&I
- —
- Monthly cashflow
- —
- DSCR
- —
- Eligible?
- —
Short-term bridge; refi at stabilization.
Listing history 20 events
-
2026-06-19days on market $99,900 Active 24 DOM
-
2026-06-18days on market $99,900 Active 23 DOM
-
2026-06-17days on market $99,900 Active 22 DOM
-
2026-06-17price $99,900 Active 21 DOM
-
2026-06-16days on market $119,900 Active 21 DOM
-
2026-06-15days on market $119,900 Active 20 DOM
-
2026-06-14days on market $119,900 Active 18 DOM
-
2026-06-12days on market $119,900 Active 17 DOM
-
2026-06-09days on market $119,900 Active 14 DOM
-
2026-06-08days on market $119,900 Active 13 DOM
-
2026-06-07days on market $119,900 Active 12 DOM
-
2026-06-05days on market $119,900 Active 9 DOM
-
2026-06-03days on market $119,900 Active 8 DOM
-
2026-06-02days on market $119,900 Active 7 DOM
-
2026-06-01days on market $119,900 Active 6 DOM
-
2026-06-01price $119,900 Active 5 DOM
-
2026-05-31days on market $129,900 Active 5 DOM
-
2026-05-30days on market $129,900 Active 4 DOM
-
2026-05-26$129,900 Active
-
2013-07-25soldstatus $27,000
ⓘ Source: listings_history table (triggers on properties + properties_extension) + one-shot
backfill from property_details.listing_events for pre-trigger history.
Tax reassessment forecast MI · Partial reset (capped growth)
- Current annual tax
- $1,360 · $113/mo
- Projected year-2 tax
- $1,449 · $121/mo
- Expected delta
- +$89/yr (+$7/mo · 6.5%)
ⓘ Screening estimate from a state-policy table — verify with the county assessor before closing.
Climate risk First Street
- Flood 1/10 Low FEMA zone X (unshaded) · 0% chance over 30 yrs
- Wildfire 1/10 Low
- Heat 2/10 Low 7 d/yr ≥97°F today · 14 d/yr by 30 yrs out
- Wind 1/10 Low
- Air quality 2/10 Low 1 unhealthy d/yr today · 2 by 30 yrs out
Nearby sold comps map
Loading sold comps map…
Walkable amenities ~0.75 mi
Loading nearby amenities…
Taxation est. · year 1
- Rental income
- $17,354
- − Mortgage interest
- −$5,596
- − Property taxes
- −$1,360
- − Insurance
- −$500
- − Repairs & maintenance
- −$1,388
- − Management
- −$1,388
- − Depreciation
- −$2,906
- Taxable income
- $4,216
- Est. tax owed @ 24.0%
- −$1,012
- After-tax cash flow
- $4,552/yr
For passive investors: Depreciation is non-cash, so a rental often shows a tax loss while cash-flowing — sheltering income. Rental losses are passive: they offset passive income freely, and up to $25,000/yr can offset ordinary (W-2) income if you actively participate and your MAGI is under $100k (phasing out to $0 by $150k); unused losses carry forward. On sale, claimed depreciation is recaptured at up to 25%, and gains may owe capital-gains tax (a 1031 exchange can defer both). Figures are a year-1 estimate at your 24.0% rate — not tax advice; consult a CPA.
Schools (NCES district)
- District
- Bay City School District
- NCES district ID
- 2604260
- Math proficiency
- 27% ▼ -8.00%
- Reading proficiency
- 40% ▼ -4.00%
- Median HH income
- $43,833
- Composite
- 28.47/100
- National rank
- #6743
- State rank
- #317 of 540 in MI
Livability — Bay City
- Score
- 68/100
- State rank
- #360
- US rank
- #8912
Category grades
Schools grade is shown separately in the Schools card above.
Census & demographics
- Census place
- Bay City, MI
- County
- Bay County · 36,975 people
- City population
- 25,635
- Metro
- Bay City, MI
- Population (ZIP)
- 25,635
- Household income
- $50,518
- Rent vs Own
- Severe rent burden
- 528.0
Population outlook (Bay County) Hauer SSP2
- Today (2025)
- 101,476 people
- By 2030
- 98,152 · -3.3%
- By 2040
- 89,711 · -11.6%
- By 2050
- 80,614 · -20.6%
- By 2075
- 60,544 · -40.3%
- By 2100
- 41,603 · -59.0%
Race, ethnicity, and origin ACS 2023
- Neighborhood character
- Predominantly White (81%)
- Race & ethnicity
- White 81% Hispanic / Latino 11% Two or more races 10% Black 3%
- Hispanic origin (detail)
- Mexican 9%
- Common ancestry
- Romanian 17% Lithuanian 7% Slovak 2%
- Foreign-born
- 2% · Canada, South Korea
- Languages at home
- 96% English-only · Spanish 2% German/W. Germanic 1%
Political lean MEDSL · Bay
- 2024 margin
- R (+14.7) · D 42.0% · R 56.7% · Other 1.3%
- 2008→2024 swing
- -30.0pp toward R · 2008: 15.3pp · 2024: -14.7pp
- All cycles
- 2024: R+14.7 2020: R+11.6 2016: R+12.6 2012: D+6.0 2008: D+15.3
Not yet ingested
- Civics
- —
Market trends
- HPI YoY
- ▼ -82.21%
- Current HPI
- 183.5774
- Rent YoY
- —
- Metro
- Bay City, MI
- State GDP YoY
- ▲ 1.37%
- F500 in state
- 28
Industry mix (Fortune 500 HQ in MI)
| Industry | F500 HQs | Revenue |
|---|---|---|
| Automotive Parts | 3 | $48B |
|
||
| Automotive | 2 | $372B |
|
||
| Chemicals | 1 | $45B |
|
||
| Automotive Retail | 1 | $29B |
|
||
| Healthcare / Medical Devices | 1 | $23B |
|
||
| Automotive Technology | 1 | $20B |
|
||
Price history
+381.1% since first listed2 events — show timeline
- 2026-05-26 Listed $129,900 MiRealSource-MiMLS
- 2013-07-25 Sold (Public Records) $27,000 Public Records
Property tax history
-0.4%/yrLatest (2025): $1,360 · -15.2% YoY. Source: county tax records.
Cash-flow waterfall
monthlySold comps — $/sqft
last 12 mo · ≤1 miLoading sold comps…