 14-Plex
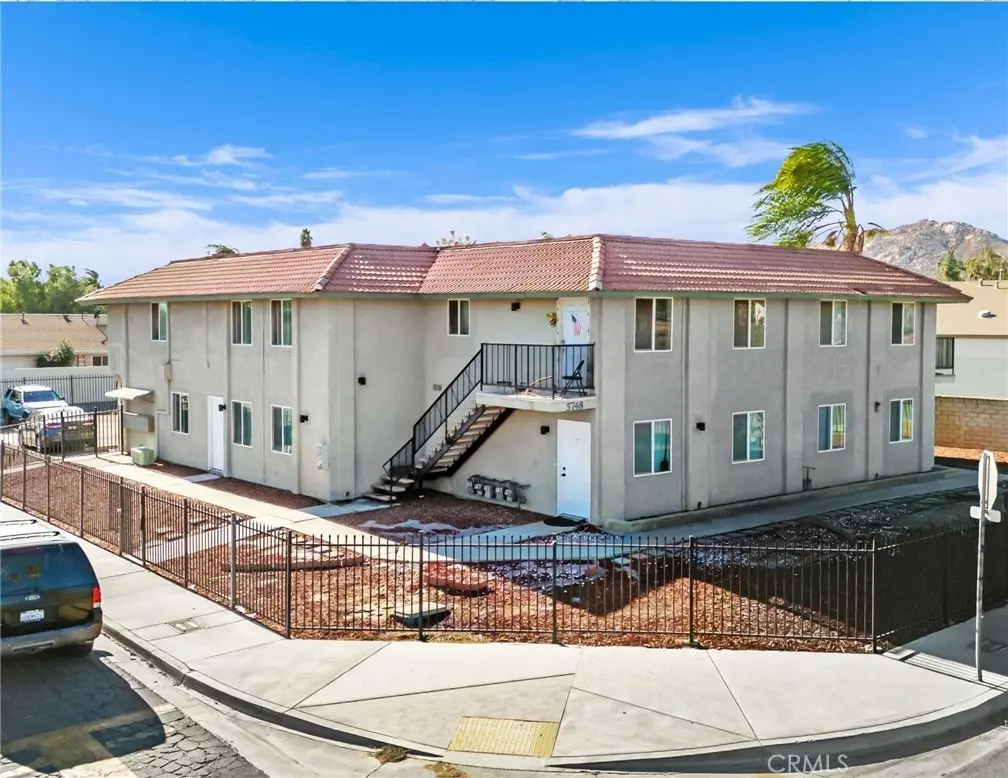
5748 Tilton Ave · Jurupa Valley, CA
Flood risk 1/10 · Minimal
- FEMA flood zone
- X
- Chance of flooding over 30 yrs
- 0.0%
- Est. flood insurance / yr
- $507 – $1,088
Fire risk 8/10 · Major
- Est. fire insurance / yr
- $659 – $1,223
Heat risk 8/10 · Major
- Hot days now (above 103°F)
- 7 days/yr
- Hot days in 30 yrs
- 21 days/yr
Wind risk 1/10 · Minimal
- Chance of severe wind over 30 yrs
- —
Air-quality risk 10/10 · Severe
- Unhealthy air days now
- 27 days/yr
- Unhealthy air days in 30 yrs
- 32 days/yr
Risk factors via First Street. Map © Google.
Why this score? — see what drove the D- grade
The composite is a weighted blend of 9 inputs, each scored 0–100. Each bar is that input's sub-score; the figure is the points it added to the 100-point composite (weight × sub-score).
- Cash flow +17.2/30.0
- DSCR +5.4/10.0
- 1% rule +4.1/10.0
- Schools +3.1/10.0
- Rent growth +2.8/5.0
- Livability +2.5/5.0
- Condition / age +2.5/5.0
- ARV discount +0.0/15.0
- Appreciation +0.0/10.0
$2,700,000
🖨 Deal sheet (PDF) 📄 Offer letter ✓ Due diligence
Multi-family units
County records classify this as Multi-Family (5+ Unit). Listing-text estimate: 14 units. confirmed
5+ unit building — per-unit beds/baths from public records are typically unavailable; the breakdown below (if shown) is an estimate from the listing text.
Listing remarks MLS
We are excited to exclusively present a unique 14-unit multifamily investment opportunity located at 5748 Tilton Avenue in Jurupa Valley, CA. Situated within a short drive of the thriving Downtown Riverside, this property benefits from its strategic position between major thoroughfares Limonite Avenue and Mission Boulevard, as well as its proximity to major freeways (60, 91 and 215). 5748 Tilton Avenue offer investors a rare chance to acquire a superbly-maintained and well-situated asset in a well sought-after neighborhood. 5748 Tilton Avenue consist of ±6,882 of rental square feet on a ±10,019 square foot lot and features low-maintenance landscaping, on-site laundry with gated surface parking. Units have been updated and feature fully equipped kitchens with oven ranges, dishwashers, microwaves, ceiling fans, vertical blinds, individual porches and laminate plank wood flooring throughout. Riverside’s strategic location within Southern California positions it as a compelling destination for working professionals. The city’s convenient access to major freeways like the 60, 91, and 215 offers seamless connectivity to Riverside County, San Bernardino County, Los Angeles County, and beyond. This prime location, coupled with a dynamic community, draws a diverse talent pool. Top employers in the healthcare, manufacturing, retail, education and government industries, contribute to Riverside’s thriving economy. The city’s cost of living, while competitive with other Southern California areas, makes it an attractive option for working-class professionals seeking a balance between affordability and quality of life. Residents also enjoy easy access to a variety of cultural attractions within a 20-mile radius. These include the Galleria at Tyler, the historic Mission Inn Hotel and Spa, the convenient Downtown Metrolink Station, the iconic Riverside Fox Theatre, Riverside City College, and the prestigious University of California, Riverside. This combination of career opportunities, cultural amenities, and a strategic location makes Riverside a highly sought-after place to live and work. 5748 Tilton Avenue is a prime Riverside income-producing property and a great long-term investment. The property is in a desirable area and offers stability for any type of investor, whether it may be a first-time purchaser, seasoned investor, or a 1031 exchange buyer.
Key facts
- On site laundry
- Individual porches
- 0.23 acre lot
Tags
Neighborhood map
What this means for you Summary
Snapshot
- This is a 14 × 1-bed/1-bath units multifamily listed at $2.70M.
Deal economics
- At list price, monthly cash flow is $2k ($23k/yr) — positive. Per door: $139/mo.
- The deal already cash-flows at list — no discount required.
- To meet the 1% rule (rent ≥ 1% of price), the offer needs to be $2.46M (9.0% below list).
- Recommended offer: $2.38M (12.0% below list) — sets the bar for market timing.
- Cap rate 7.2% vs local median 2.9% in Jurupa Valley — top-decile yield for the area; either an underpriced asset or a hidden risk that comps aren't pricing in. Stress-test before assuming the spread holds.
Location & tenants
- Location reads 49/100 on livability (#1,170 in CA) — a working-class tenant base; expect higher turnover. Strengths: housing A+, employment A-; Watch: amenities F, commute F, cost of living F.
- Jurupa Unified (suburban): math 25% / reading 38% proficiency, ranked #953 of 1,400 in CA (top 68%) — families likely to look elsewhere, expect single-tenant / working-renter base with shorter leases; 64% free/reduced lunch — lower-income household profile, screen leases tightly.
- Zoned schools: West Riverside Elementary (600 students, 88% FRL); Mission Middle (694 students, 89% FRL); Rubidoux High (1,407 students, 90% FRL) — zoned schools average 89% FRL vs 64% district-wide (25 pts higher); higher-poverty schools than district average — tighter screening recommended.
- Market conditions: Rents rising (+1.3%/yr); 201 active listings in the ZIP; solid renter incomes; 9,195 units permitted in Riverside County in 2024 (1,512 in 5+ unit buildings).
- At $24,561/mo this rent would consume 309% of the median local household income ($95k/yr) (locally 1694% of renters already pay >50% of income on rent) — very limited rent-growth headroom before tenants either downsize or default.
Forward outlook
- Local home prices are declining (-3.0%/yr); year-one equity from $19k of loan paydown is wiped out by about $81k of value loss. Plan a longer hold.
- Riverside County population projected at +22% by 2050 — long-run rental-demand tailwind backs the buy-and-hold thesis.
Negotiation context
- It's been on market 135 days — a 12% lower offer ($2.38M) is reasonable based on typical stale-listing flexibility.
- 5 sale attempts since 3y ago with the ask held roughly flat each time — persistent listings suggest the price (not the market) is what's stuck; bring a comps-based counter.
- Current owner paid $2.08M; 30% above their basis — modest negotiation headroom, anchor on the comps not their cost.
Risks & watch-outs
- Climate carrying-cost: severe wildfire risk; extreme-heat days projected 7→21/yr by 2055 (HVAC capex compounding) — expect insurance premiums to compound above CPI over the hold.
Questions for the listing agent
- It's been on market 135 days. Have you received any prior offers? Is the seller open to a 12% concession, seller financing, or rate buy-down credit?
- Can we see the unit-by-unit rent roll, current vacancy, and any below-market leases? What's the average tenancy length?
- What capital expenditures (roof, boiler, parking lot, exteriors) have been made in the last 5 years, and what's planned in the next 2?
- Why hasn't it sold? Are there any deal-killer items the seller is aware of (foundation, flood, title, zoning, code violations)?
- Is there a deadline driving the sale (1031 exchange, divorce, estate, relocation)? That informs how much negotiation room exists.
- Schools are F-rated, which usually means shorter tenancies and higher turnover. Who's the typical renter profile here, and what's been the actual vacancy rate?
- The area grade is low — what's the realistic commute time and amenity access for the typical tenant pool here? Any planned neighborhood developments (good or bad) we should know about?
- What's the average days-on-market for RENTAL listings here right now (not sales)? A rising rental-DOM trend means longer vacancies and softer asking-rent achievability than the comps imply.
- What's the recent tenant-quality profile in this submarket — average credit score on applications, eviction rate, late-payment / NSF rate, and stable-employment percentage? A property-management company in the area should have these aggregated.
- How much new apartment / multifamily construction is in the pipeline within 1–3 miles? Heavy new supply (>2% of stock underway) typically softens rents 12–24 months out; light construction supports rent growth.
Investment metrics
- 1% rule
- 0.91% ✗
- Cap rate
- 7.16%
- Cash-on-cash
- 3.09%
- DSCR
- 1.14
- GRM
- 9.2
CMA / ARV
- ARV (median comp)
- $1,903,907
- List price
- $2,700,000
- Delta
- 41.81%
- Verdict
- OVERPRICED
- Comps
- 1 within 2.0 mi
Projected returns pro-forma
-3.0% appreciation · 1.31% rent growth · sell at horizon
- IRR
- -13.2%
- Equity multiple
- 0.53×
- Total profit
- $-354,819
- Equity at exit
- $402,579
- IRR
- -7.0%
- Equity multiple
- 0.59×
- Total profit
- $-313,537
- Equity at exit
- $233,447
Cash invested: $756,000 (down + closing). Projections, not guarantees.
Landlord ↔ Tenant lean methodology
- Overall (STATE)
- 18 Strongly Tenant-Friendly
- State California
- 18 Strongly Tenant-Friendly · D+13
- County
- — inherits STATE
- City
- — inherits STATE
ZIP-level market 92509
- Rents YoY
- 1.3%
- Active inventory
- 201
- Price-to-rent
- 128.3×
Monthly cashflow live
- Estimated rent
- $24,561 medium interval (Pro) →
- Mortgage (P&I)
- −$14,159
- Tax from tax record
- −$2,170 /mo · $26,040/yr
- Insurance
- −$1,125
- HOA
- −$0
- Vacancy / Maint / Mgmt
- −$5,158
- Net cashflow
- $1,949
Break-even live
Sensitivity live
| Price | -10% $3,478 | -5% $2,713 | +0% $1,949 | +5% $1,185 | +10% $421 |
|---|---|---|---|---|---|
| Rent | -10% $9 | -5% $979 | +0% $1,949 | +5% $2,919 | +10% $3,889 |
| Rate | -1.0pp $3,309 | -0.5pp $2,636 | base $1,949 | +0.5pp $1,249 | +1.0pp $538 |
14-unit breakdown (identical units grouped — click to expand)
| Units | Beds | Baths | Est. rent |
|---|---|---|---|
| 14× units | 1 | 1 | $24,556 |
| #1 | 1 | 1 | $1,754 |
| #2 | 1 | 1 | $1,754 |
| #3 | 1 | 1 | $1,754 |
| #4 | 1 | 1 | $1,754 |
| #5 | 1 | 1 | $1,754 |
| #6 | 1 | 1 | $1,754 |
| #7 | 1 | 1 | $1,754 |
| #8 | 1 | 1 | $1,754 |
| #9 | 1 | 1 | $1,754 |
| #10 | 1 | 1 | $1,754 |
| #11 | 1 | 1 | $1,754 |
| #12 | 1 | 1 | $1,754 |
| #13 | 1 | 1 | $1,754 |
| #14 | 1 | 1 | $1,754 |
| Total (14 units) | $24,561 | ||
UW: 25.0% down · 7.5% · 30yr · 1.5% tax · 5.0% vac · 8.0% maint · 8.0% mgmt
Financing live
Cash to close
- Down payment
- $675,000
- Closing costs
- $81,000
- Reserves months
- —
- Total cash needed
- —
Loan-product check · same deal, 3 products live
Conventional
25% down · 7.5% · 30yr
- Down + closing
- —
- Monthly P&I
- —
- Monthly cashflow
- —
- DSCR
- —
- Eligible?
- —
Personal DTI + credit; lowest rate.
DSCR
20% down · 8.5% · 30yr
- Down + closing
- —
- Monthly P&I
- —
- Monthly cashflow
- —
- DSCR
- —
- Eligible?
- —
No personal income docs; deal must DSCR.
Hard money
10% down · 12.0% · 12mo
- Down + closing
- —
- Monthly P&I
- —
- Monthly cashflow
- —
- DSCR
- —
- Eligible?
- —
Short-term bridge; refi at stabilization.
Listing history 35 events
-
2026-06-21days on market $2,700,000 Active 135 DOM
-
2026-06-18days on market $2,700,000 Active 132 DOM
-
2026-06-17days on market $2,700,000 Active 131 DOM
-
2026-06-16days on market $2,700,000 Active 130 DOM
-
2026-06-15days on market $2,700,000 Active 129 DOM
-
2026-06-13days on market $2,700,000 Active 127 DOM
-
2026-06-13days on market $2,700,000 Active 126 DOM
-
2026-06-09days on market $2,700,000 Active 123 DOM
-
2026-06-08days on market $2,700,000 Active 122 DOM
-
2026-06-07days on market $2,700,000 Active 121 DOM
-
2026-06-04days on market $2,700,000 Active 118 DOM
-
2026-06-03days on market $2,700,000 Active 117 DOM
-
2026-06-02days on market $2,700,000 Active 116 DOM
-
2026-06-01days on market $2,700,000 Active 115 DOM
-
2026-05-31days on market $2,700,000 Active 114 DOM
-
2026-02-06$2,700,000 Active 2418-char remark
Show marketing remark (2418 chars)
We are excited to exclusively present a unique 14-unit multifamily investment opportunity located at 5748 Tilton Avenue in Jurupa Valley, CA. Situated within a short drive of the thriving Downtown Riverside, this property benefits from its strategic position between major thoroughfares Limonite Avenue and Mission Boulevard, as well as its proximity to major freeways (60, 91 and 215). 5748 Tilton Avenue offer investors a rare chance to acquire a superbly-maintained and well-situated asset in a well sought-after neighborhood. 5748 Tilton Avenue consist of ±6,882 of rental square feet on a ±10,019 square foot lot and features low-maintenance landscaping, on-site laundry with gated surface parking. Units have been updated and feature fully equipped kitchens with oven ranges, dishwashers, microwaves, ceiling fans, vertical blinds, individual porches and laminate plank wood flooring throughout. Riverside’s strategic location within Southern California positions it as a compelling destination for working professionals. The city’s convenient access to major freeways like the 60, 91, and 215 offers seamless connectivity to Riverside County, San Bernardino County, Los Angeles County, and beyond. This prime location, coupled with a dynamic community, draws a diverse talent pool. Top employers in the healthcare, manufacturing, retail, education and government industries, contribute to Riverside’s thriving economy. The city’s cost of living, while competitive with other Southern California areas, makes it an attractive option for working-class professionals seeking a balance between affordability and quality of life. Residents also enjoy easy access to a variety of cultural attractions within a 20-mile radius. These include the Galleria at Tyler, the historic Mission Inn Hotel and Spa, the convenient Downtown Metrolink Station, the iconic Riverside Fox Theatre, Riverside City College, and the prestigious University of California, Riverside. This combination of career opportunities, cultural amenities, and a strategic location makes Riverside a highly sought-after place to live and work. 5748 Tilton Avenue is a prime Riverside income-producing property and a great long-term investment. The property is in a desirable area and offers stability for any type of investor, whether it may be a first-time purchaser, seasoned investor, or a 1031 exchange buyer.
-
2025-04-02historical
-
2024-12-11$2,950,000 Active
-
2024-03-19historical $1,400
-
2024-03-14historical $1,400
-
2024-03-14$1,400
-
2024-01-18$1,400
-
2024-01-13historical $1,450
-
2023-11-16price $1,450
-
2023-11-15price $1,600
-
2023-10-27price $1,680
-
2023-10-23$1,400
-
2022-11-08historical
-
2019-09-03soldstatus $2,080,000
-
2014-06-04soldstatus $568,000
-
2011-09-27soldstatus $1,950,000
-
2005-05-19soldstatus $1,100,000
-
1994-06-30soldstatus $425,000
-
1988-09-16soldstatus $647,500
-
1986-07-11soldstatus $291,500
ⓘ Source: listings_history table (triggers on properties + properties_extension) + one-shot
backfill from property_details.listing_events for pre-trigger history.
Tax reassessment forecast CA · Resets to sale price
- Current annual tax
- $26,040 · $2,170/mo
- Projected year-2 tax
- $26,040 · $2,170/mo
- Expected delta
- $0/yr ($0/mo · -0.0%)
ⓘ Screening estimate from a state-policy table — verify with the county assessor before closing.
Climate risk First Street
- Flood 1/10 Low FEMA zone X · 0% chance over 30 yrs
- Wildfire 8/10 Severe
- Heat 8/10 Severe 7 d/yr ≥103°F today · 21 d/yr by 30 yrs out
- Wind 1/10 Low
- Air quality 10/10 Extreme 27 unhealthy d/yr today · 32 by 30 yrs out
Nearby sold comps map
Loading sold comps map…
Walkable amenities ~0.75 mi
Loading nearby amenities…
Taxation est. · year 1
- Rental income
- $294,732
- − Mortgage interest
- −$151,242
- − Property taxes
- −$26,040
- − Insurance
- −$13,500
- − Repairs & maintenance
- −$23,579
- − Management
- −$23,579
- − Depreciation
- −$78,545
- Taxable loss
- −$21,752
- Est. tax savings @ 24.0%
- +$5,221
- After-tax cash flow
- $28,610/yr
For passive investors: Depreciation is non-cash, so a rental often shows a tax loss while cash-flowing — sheltering income. Rental losses are passive: they offset passive income freely, and up to $25,000/yr can offset ordinary (W-2) income if you actively participate and your MAGI is under $100k (phasing out to $0 by $150k); unused losses carry forward. On sale, claimed depreciation is recaptured at up to 25%, and gains may owe capital-gains tax (a 1031 exchange can defer both). Figures are a year-1 estimate at your 24.0% rate — not tax advice; consult a CPA.
Schools (NCES district)
- District
- Jurupa Unified
- NCES district ID
- 0619260
- Math proficiency
- 25% ▲ 2.00%
- Reading proficiency
- 38% ▲ 2.00%
- Median HH income
- $58,100
- Composite
- 30.97/100
- National rank
- #11327
- State rank
- #953 of 1400 in CA
Livability — Jurupa Valley
- Score
- 49/100
- State rank
- #1170
- US rank
- #25915
Category grades
Schools grade is shown separately in the Schools card above.
Census & demographics
- Census place
- Jurupa Valley, CA
- County
- Riverside County · 2,287,001 people
- City population
- 119,165
- Metro
- Riverside-San Bernardino-Ontario, CA
- Population (ZIP)
- 81,182
- Household income
- $95,355
- Rent vs Own
- Severe rent burden
- 1694.0
Population outlook (Riverside County) Hauer SSP2
- Today (2025)
- 2,664,475 people
- By 2030
- 2,802,692 · +5.2%
- By 2040
- 3,050,904 · +14.5%
- By 2050
- 3,256,783 · +22.2%
- By 2075
- 3,655,058 · +37.2%
- By 2100
- 3,766,594 · +41.4%
Race, ethnicity, and origin ACS 2023
- Neighborhood character
- Predominantly Hispanic (74%)
- Race & ethnicity
- Hispanic / Latino 74% White 17% Two or more races 16% Black 4% Asian 4% Native American 1%
- Hispanic origin (detail)
- Mexican 67%
- Common ancestry
- Lithuanian 1%
- Foreign-born
- 28% · Canada, China, Vietnam
- Languages at home
- 42% English-only · Spanish 54% Other Indo-European 1% Tagalog/Filipino 1%
Political lean MEDSL · Riverside
- 2024 margin
- Toss-up / Even · D 48.0% · R 49.3% · Other 2.6%
- 2008→2024 swing
- -3.6pp toward R · 2008: 2.3pp · 2024: -1.3pp
- All cycles
- 2024: R+1.3 2020: D+8.0 2016: D+4.3 2012: R+0.4 2008: D+2.3
Not yet ingested
- Civics
- —
Market trends
- HPI YoY
- ▼ -374.91%
- Current HPI
- 464.8939
- Rent YoY
- ▲ 1.31%
- Metro
- Riverside-San Bernardino-Ontario, CA
- State GDP YoY
- ▲ 3.21%
- F500 in state
- 116
Industry mix (Fortune 500 HQ in CA)
| Industry | F500 HQs | Revenue |
|---|---|---|
| Technology | 27 | $1,492B |
|
||
| Financial Services | 3 | $174B |
|
||
| Retail | 3 | $44B |
|
||
| Insurance | 3 | $26B |
|
||
| Media / Entertainment | 2 | $115B |
|
||
| Pharmaceuticals / Biotech | 2 | $62B |
|
||
Price history
+826.2% since first listed20 events — show timeline
- 2026-02-06 Listed $2,700,000 CRMLS
- 2025-04-02 Listing Removed — CRMLS
- 2024-12-11 Listed $2,950,000 CRMLS
- 2024-03-19 Rental Removed $1,400 APPFOLIO
- 2024-03-14 Rental Removed $1,400 APPFOLIO
- 2024-03-14 Listed for Rent $1,400 APPFOLIO
- 2024-01-18 Listed for Rent $1,400 APPFOLIO
- 2024-01-13 Rental Removed $1,450 APPFOLIO
- 2023-11-16 Price Changed $1,450 APPFOLIO
- 2023-11-15 Price Changed $1,600 APPFOLIO
- 2023-10-27 Price Changed $1,680 APPFOLIO
- 2023-10-23 Listed for Rent $1,400 APPFOLIO
- 2022-11-08 Rental Removed — APPFOLIO
- 2019-09-03 Sold (Public Records) $2,080,000 Public Records
- 2014-06-04 Sold (Public Records) $568,000 Public Records
- 2011-09-27 Sold (Public Records) $1,950,000 Public Records
- 2005-05-19 Sold (Public Records) $1,100,000 Public Records
- 1994-06-30 Sold (Public Records) $425,000 Public Records
- 1988-09-16 Sold (Public Records) $647,500 Public Records
- 1986-07-11 Sold (Public Records) $291,500 Public Records
Property tax history
+8.8%/yrLatest (2025): $26,040 · +5.2% YoY. Source: county tax records.
Cash-flow waterfall
monthlySold comps — $/sqft
last 12 mo · ≤1 miLoading sold comps…