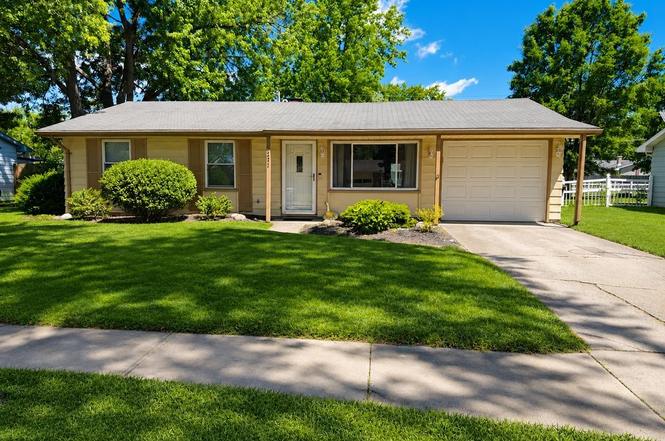
8231 Wyoming Pass · Fort Wayne, IN
Flood risk 1/10 · Minimal
- FEMA flood zone
- X (unshaded)
- Chance of flooding over 30 yrs
- 0.0%
- Est. flood insurance / yr
- $507 – $1,088
Fire risk 1/10 · Minimal
- Est. fire insurance / yr
- $717 – $1,331
Heat risk 3/10 · Minor
- Hot days now (above 100°F)
- 7 days/yr
- Hot days in 30 yrs
- 17 days/yr
Wind risk 2/10 · Minimal
- Chance of severe wind over 30 yrs
- —
Air-quality risk 3/10 · Minor
- Unhealthy air days now
- 3 days/yr
- Unhealthy air days in 30 yrs
- 3 days/yr
Risk factors via First Street. Map © Google.
Why this score? — see what drove the C grade
The composite is a weighted blend of 9 inputs, each scored 0–100. Each bar is that input's sub-score; the figure is the points it added to the 100-point composite (weight × sub-score).
- Cash flow +21.1/30.0
- ARV discount +11.5/15.0
- DSCR +6.7/10.0
- 1% rule +4.9/10.0
- Livability +4.2/5.0
- Rent growth +2.5/5.0
- Condition / age +2.5/5.0
- Schools +2.2/10.0
- Appreciation +0.0/10.0
$199,000
🖨 Deal sheet 📄 Offer letter ✓ Due diligence
Listing remarks
MULTIPLE OFFERS- PLEASE SUBMIT HIGHEST AND BEST BY 7 PM, JUNE 19, 2026. SELLER WILL MAKE DECISION BY 9 PM. Welcome home to this well-maintained 3-bedroom, 1-bath ranch offering over 1,300 square feet of flexible living space. Inside, you’ll find two spacious living areas, providing endless possibilities for a family room, home office, playroom, or entertainment space. Step outside to a large deck overlooking a private, spacious backyard shaded by mature trees—perfect for relaxing, hosting guests, or enjoying summer evenings. Conveniently located near Georgetown with quick access to shopping, dining, parks, and everyday amenities, this home offers the perfect blend of comfort, pr
Key facts
- Large deck
- Private backyard
- Mature trees
Tags
Property features AI
Exterior
- Parking: Attached garage (1 car)
- Utilities: Public water; Public sewer
- Home design: Single-family site-built home; One story
- Construction: Aluminum siding; Asphalt construction materials; Shingle roof; Slab foundation; Built as site-built home
- Exterior features: Chain link fencing; Level lot; Shed(s)
Interior
- Kitchen: Dishwasher; Microwave; Refrigerator; Electric oven
- Flooring: Carpet; Laminate
- Bathrooms: 1 full bathroom (main level)
- Heating & cooling: Natural gas heating; Central air conditioning
- Interior features: Fireplace in the family room; 6 total rooms
- Laundry & utility: Washer and dryer (main level)
Neighborhood map
What this means for you Summary
Snapshot
- This is a 3-bed/1.0-bath single-family listed at $199k.
Deal economics
- At list price, monthly cash flow is $285 ($3k/yr) — positive.
- The deal already cash-flows at list — no discount required.
- To meet the 1% rule (rent ≥ 1% of price), the offer needs to be $197k (1.0% below list).
- Recommended offer: $197k (1.0% below list) — sets the bar for 1% rule.
- Cap rate 8.0% vs local median 4.8% in Fort Wayne — top-decile yield for the area; either an underpriced asset or a hidden risk that comps aren't pricing in. Stress-test before assuming the spread holds.
Location & tenants
- Location reads 84/100 on livability (#6 in IN, #676 nationally) — a professional / high-income tenant draw. Strengths: amenities A+, commute A+, cost of living A+; Watch: crime C-, employment D+.
- Fort Wayne Community Schools (urban): math 22% / reading 29% proficiency, ranked #263 of 301 in IN (top 87%) — low school quality limits family demand, transient renter base, plan for 1-2y turnover; 60% free/reduced lunch — lower-income household profile, screen leases tightly.
- Zoned schools: J Wilbur Haley Elementary School (math 19% / reading 20%, grade F, #814 of 994 statewide, top 83%, 568 students, 65% FRL); Blackhawk Middle School (math 28% / reading 38%, grade F, #180 of 330 statewide, top 56%, 797 students, 46% FRL); R Nelson Snider High School (math 27% / reading 53%, grade F, #217 of 369 statewide, top 59%, 1,899 students, 50% FRL).
- Market conditions: 101 active listings in the ZIP; 7 comparable units currently listed for rent nearby; rentals leasing fast (median 14d on market — plan ~1-2 weeks tenant-placement turnaround); 43% of comp listings sitting > 30 days — soft ceiling on asking rent; 1,861 units permitted in Allen County in 2024 (576 in 5+ unit buildings).
- This rent runs 32% of the median local income ($73k/yr) — at the standard rent-burdened threshold; future hikes will face affordability resistance.
Forward outlook
- Local home prices are declining (-3.0%/yr); year-one equity from $1k of loan paydown is wiped out by about $6k of value loss. Plan a longer hold.
- Allen County population projected at +10% by 2050 — modest demand growth; plan on rents tracking national, not racing it.
Negotiation context
- Only 1 days on market — expect competitive offers; lowballing is unlikely to land.
Questions for the listing agent
- Built in 1968 — when were the roof, HVAC, electrical panel, plumbing, and water heater last replaced?
- Is there a deadline driving the sale (1031 exchange, divorce, estate, relocation)? That informs how much negotiation room exists.
- Schools are D-rated, which usually means shorter tenancies and higher turnover. Who's the typical renter profile here, and what's been the actual vacancy rate?
- What's the average days-on-market for RENTAL listings here right now (not sales)? A rising rental-DOM trend means longer vacancies and softer asking-rent achievability than the comps imply.
- What's the recent tenant-quality profile in this submarket — average credit score on applications, eviction rate, late-payment / NSF rate, and stable-employment percentage? A property-management company in the area should have these aggregated.
- How much new for-sale + rental construction is in the pipeline within 1–3 miles? Heavy new supply typically softens prices + rents 12–24 months out; constrained supply supports both.
Investment metrics
- 1% rule
- 0.99% ✗
- Cap rate
- 8.01%
- Cash-on-cash
- 6.14%
- DSCR
- 1.27
- GRM
- 8.4
CMA / ARV
- ARV (on-the-fly)
- $218,436
- Comps found
- 12
Show comp detail 12 sales within ~0.75 mi
| Address | Dist | Beds/Ba | Sqft | Sold | Price | $/sf | Match |
|---|---|---|---|---|---|---|---|
| 8220 Wyoming Pass | 0.03mi | 3/1.0 | 1,296 (-1%) | 1mo | $195,000 | $150 | 96 |
| 3502 Montana Dr | 0.10mi | 3/1.0 | 1,320 (+1%) | 8mo | $204,000 | $155 | 87 |
| 3626 Colorado Ct | 0.22mi | 3/1.5 | 1,326 (+1%) | 1mo | $231,000 | $174 | 85 |
| 3634 Colorado Ct | 0.23mi | 4/1.5 (+1) | 1,296 (-1%) | 2mo | $205,000 | $158 | 79 |
| 8130 Park State Dr | 0.12mi | 3/1.0 | 1,228 (-6%) | 6mo | $200,000 | $163 | 79 |
| 3627 Iowa Ct | 0.20mi | 4/1.5 (+1) | 1,344 (+3%) | 2mo | $126,853 | $94 | 78 |
| 3414 Country Park Ln | 0.25mi | 3/2.0 | 1,389 (+6%) | 2mo | $300,000 | $216 | 72 |
| 3417 Montana Dr | 0.06mi | 3/1.5 | 1,128 (-14%) | 3mo | $214,900 | $191 | 70 |
| 8325 Santa Fe Trl | 0.13mi | 3/1.5 | 1,128 (-14%) | 8mo | $190,700 | $169 | 63 |
| 2824 Repton Dr | 0.39mi | 3/1.0 | 1,189 (-9%) | 8mo | $198,000 | $167 | 60 |
| 3641 Cardinal Ln | 0.35mi | 3/1.5 | 1,484 (+14%) | 5mo | $225,000 | $152 | 56 |
| 8513 Maple Bluff Ct | 0.33mi | 3/2.0 | 1,145 (-12%) | 6mo | $210,000 | $183 | 54 |
Match score weights: distance 35% · size 25% · config 20% · recency 20%. Top-matched comps best support the ARV.
Projected returns pro-forma
-3.0% appreciation · 3.0% rent growth · sell at horizon
- IRR
- -6.9%
- Equity multiple
- 0.75×
- Total profit
- $-14,129
- Equity at exit
- $29,672
- IRR
- 2.7%
- Equity multiple
- 1.20×
- Total profit
- $10,930
- Equity at exit
- $17,206
Cash invested: $55,720 (down + closing). Projections, not guarantees.
Landlord ↔ Tenant lean methodology
- Overall (STATE)
- 90 Strongly Landlord-Friendly
- State Indiana
- 90 Strongly Landlord-Friendly · R+11
- County
- — inherits STATE
- City
- — inherits STATE
ZIP-level market 46815
- Active inventory
- 101
- Price-to-rent
- 8.4×
Monthly cashflow live
- Estimated rent
- $1,970 high interval (Pro) →
- Mortgage (P&I)
- −$1,044
- Tax from tax record
- −$144 /mo · $1,733/yr
- Insurance
- −$83
- HOA
- −$0
- Vacancy / Maint / Mgmt
- −$414
- Net cashflow
- $285
Break-even live
UW: 25.0% down · 7.5% · 30yr · 1.5% tax · 5.0% vac · 8.0% maint · 8.0% mgmt
Financing live
Cash to close
- Down payment
- $49,750
- Closing costs
- $5,970
- Reserves months
- —
- Total cash needed
- —
Loan-product check · same deal, 3 products live
Conventional
25% down · 7.5% · 30yr
- Down + closing
- —
- Monthly P&I
- —
- Monthly cashflow
- —
- DSCR
- —
- Eligible?
- —
Personal DTI + credit; lowest rate.
DSCR
20% down · 8.5% · 30yr
- Down + closing
- —
- Monthly P&I
- —
- Monthly cashflow
- —
- DSCR
- —
- Eligible?
- —
No personal income docs; deal must DSCR.
Hard money
10% down · 12.0% · 12mo
- Down + closing
- —
- Monthly P&I
- —
- Monthly cashflow
- —
- DSCR
- —
- Eligible?
- —
Short-term bridge; refi at stabilization.
Rent comps 7 comps
| Address | Beds | Baths | Sqft | Rent | $/sqft | DOM | Units | Dist |
|---|---|---|---|---|---|---|---|---|
| 3212 W Bartlett Dr Fort Wayne, IN | 2.0 | 2.0 | 1289 | $2,250 | $1.75 | 43d | 1 | 0.31mi |
| 3215 W Bartlett Dr Fort Wayne, IN | 2.0 | 2.0 | 1464 | $2,380 | $1.63 | 43d | 1 | 0.34mi |
| 3213 W Bartlett Dr Fort Wayne, IN | 2.0 | 2.0 | 1445 | $2,250 | $1.56 | 43d | 1 | 0.34mi |
| 9114 Parent Rd New Haven, IN | 2.0 | 1.0 | 1000 | $1,550 | $1.55 | 13d | 10 | 0.67mi |
| 1919 Bear Paw Dr Fort Wayne, IN | 4.0 | 3.0 | 1792 | $1,950 | $1.09 | 13d | 1 | 1.15mi |
| 3010 Simcoe Dr Fort Wayne, IN | 1.0–3.0 | 1.0–2.5 | 940 | $1,609 | $1.71 | 13d | 10 | 1.23mi |
| 10001 Pin Oak Cir Fort Wayne, IN | 1.0–3.0 | 1.0–2.0 | 1190 | $1,750 | $1.47 | 13d | 13 | 1.47mi |
Listing history 6 events
-
2026-06-19remarks 687-char remark
-
2026-06-18statusdays on market $199,000 Active 1 DOM
-
2026-06-17days on market $199,000 Coming Soon 3 DOM
-
2026-06-16days on market $199,000 Coming Soon 2 DOM
-
2026-06-15remarks 633-char remark
-
2026-06-15$199,000 Coming Soon 1 DOM
ⓘ Source: listings_history table (triggers on properties + properties_extension) + one-shot
backfill from property_details.listing_events for pre-trigger history.
Tax reassessment forecast IN · Partial reset (capped growth)
- Current annual tax
- $1,733 · $144/mo
- Projected year-2 tax
- $1,733 · $144/mo
- Expected delta
- $0/yr ($0/mo · 0.0%)
ⓘ Screening estimate from a state-policy table — verify with the county assessor before closing.
Climate risk First Street
- Flood 1/10 Low FEMA zone X (unshaded) · 0% chance over 30 yrs
- Wildfire 1/10 Low
- Heat 3/10 Moderate 7 d/yr ≥100°F today · 17 d/yr by 30 yrs out
- Wind 2/10 Low
- Air quality 3/10 Moderate 3 unhealthy d/yr today · 3 by 30 yrs out
Nearby sold comps map
Loading sold comps map…
Walkable amenities ~0.75 mi
Loading nearby amenities…
Taxation est. · year 1
- Rental income
- $23,634
- − Mortgage interest
- −$11,147
- − Property taxes
- −$1,733
- − Insurance
- −$995
- − Repairs & maintenance
- −$1,891
- − Management
- −$1,891
- − Depreciation
- −$5,789
- Taxable income
- $188
- Est. tax owed @ 24.0%
- −$45
- After-tax cash flow
- $3,375/yr
For passive investors: Depreciation is non-cash, so a rental often shows a tax loss while cash-flowing — sheltering income. Rental losses are passive: they offset passive income freely, and up to $25,000/yr can offset ordinary (W-2) income if you actively participate and your MAGI is under $100k (phasing out to $0 by $150k); unused losses carry forward. On sale, claimed depreciation is recaptured at up to 25%, and gains may owe capital-gains tax (a 1031 exchange can defer both). Figures are a year-1 estimate at your 24.0% rate — not tax advice; consult a CPA.
Schools (NCES district)
- District
- Fort Wayne Community Schools
- NCES district ID
- 1803630
- Math proficiency
- 22% ▼ -11.00%
- Reading proficiency
- 29% ▼ -7.00%
- Median HH income
- $41,951
- Composite
- 21.68/100
- National rank
- #8275
- State rank
- #263 of 301 in IN
Livability — Fort Wayne
- Score
- 84/100
- State rank
- #6
- US rank
- #676
Category grades
Schools grade is shown separately in the Schools card above.
Census & demographics
- Census place
- Fort Wayne, IN
- County
- Allen County · 326,813 people
- City population
- 326,813
- Metro
- Fort Wayne, IN
- Population (ZIP)
- 27,238
- Household income
- $73,239
- Rent vs Own
- Severe rent burden
- 604.0
Population outlook (Allen County) Hauer SSP2
- Today (2025)
- 394,020 people
- By 2030
- 405,128 · +2.8%
- By 2040
- 423,476 · +7.5%
- By 2050
- 435,137 · +10.4%
- By 2075
- 450,293 · +14.3%
- By 2100
- 424,101 · +7.6%
Race, ethnicity, and origin ACS 2023
- Neighborhood character
- Predominantly White (78%)
- Race & ethnicity
- White 78% Black 9% Two or more races 7% Asian 5% Hispanic / Latino 4%
- Common ancestry
- Italian 2% Lithuanian 2% Romanian 2%
- Foreign-born
- 4% · Philippines, Canada
- Languages at home
- 93% English-only · Other Asian/Pacific 4% Spanish 1% Other Indo-European 1%
Political lean MEDSL · Allen
- 2024 margin
- R (+12.5) · D 42.9% · R 55.4% · Other 1.7%
- 2008→2024 swing
- -8.1pp toward R · 2008: -4.3pp · 2024: -12.5pp
- All cycles
- 2024: R+12.5 2020: R+11.2 2016: R+19.6 2012: R+16.8 2008: R+4.3
Not yet ingested
- Civics
- —
Market trends
- HPI YoY
- ▼ -219.81%
- Current HPI
- 245.2095
- Rent YoY
- —
- Metro
- Fort Wayne, IN
- State GDP YoY
- ▲ 2.90%
- F500 in state
- 18
Industry mix (Fortune 500 HQ in IN)
| Industry | F500 HQs | Revenue |
|---|---|---|
| Industrial Machinery | 2 | $37B |
|
||
| Healthcare | 1 | $177B |
|
||
| Pharmaceuticals | 1 | $45B |
|
||
| Metals / Steel | 1 | $18B |
|
||
| Agriculture | 1 | $17B |
|
||
| Packaging | 1 | $12B |
|
||
Price history
1 event — show timeline
- 2026-06-14 Coming Soon $199,000 IRMLS
Property tax history
+10.7%/yrLatest (2024): $1,733 · +13.2% YoY. Source: county tax records.
Cash-flow waterfall
monthlySold comps — $/sqft
last 12 mo · ≤1 miLoading sold comps…