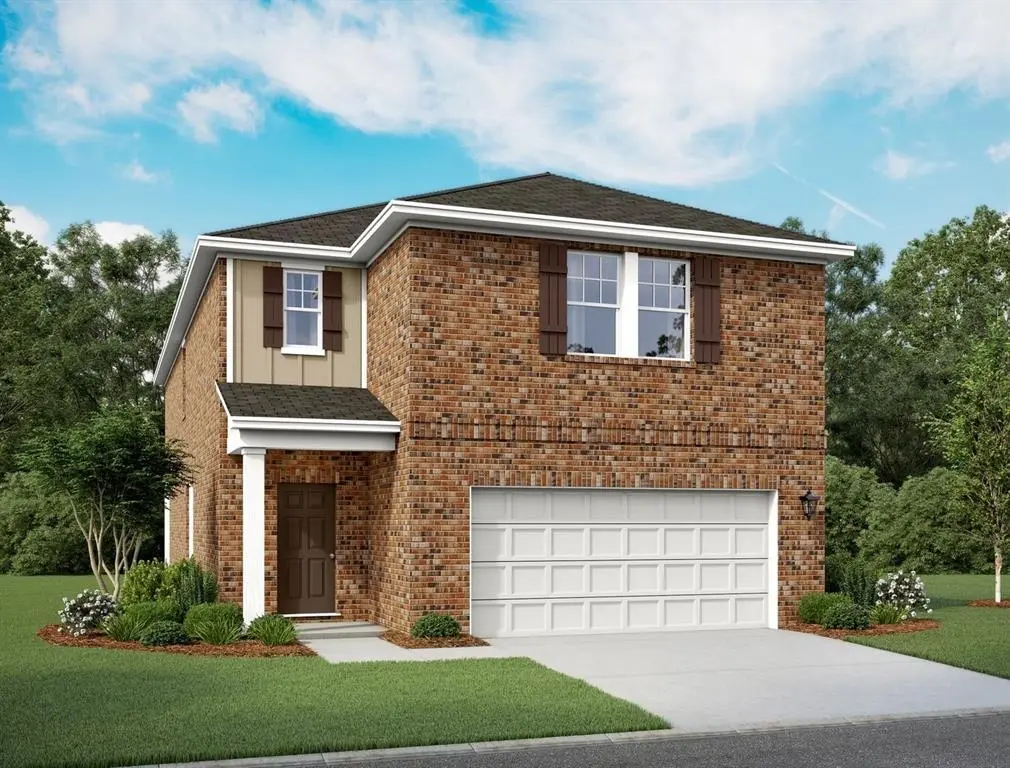
6076 Mojave Dr · Terrell, TX
Flood risk No data
- FEMA flood zone
- —
- Chance of flooding over 30 yrs
- —
- Est. flood insurance / yr
- —
Fire risk No data
- Est. fire insurance / yr
- —
Heat risk No data
- Hot days now (above threshold)
- —
- Hot days in 30 yrs
- —
Wind risk No data
- Chance of severe wind over 30 yrs
- —
Air-quality risk No data
- Unhealthy air days now
- —
- Unhealthy air days in 30 yrs
- —
Risk factors via First Street. Map © Google.
Why this score? — see what drove the D+ grade
The composite is a weighted blend of 9 inputs, each scored 0–100. Each bar is that input's sub-score; the figure is the points it added to the 100-point composite (weight × sub-score).
- Cash flow +15.0/30.0
- ARV discount +7.5/15.0
- 1% rule +5.0/10.0
- DSCR +5.0/10.0
- Schools +4.0/10.0
- Livability +3.4/5.0
- Rent growth +2.9/5.0
- Condition / age +2.5/5.0
- Appreciation +0.0/10.0
$2,595
🖨 Deal sheet 📄 Offer letter ✓ Due diligence
Listing remarks MLS
MLS# 21164333 - Built by Starlight Homes - Ready Now! ~ This spacious 2-story home is the perfect new addition in your life. Enjoy an open concept kitchen and family room throughout the home and spread out in the second-floor loft. The kitchen features upgrades such as granite countertops, stainless steel appliances and a large island. Entertain friends on your very own private patio.
Key facts
- Private backyard
- Modern kitchen
- 4,792 sq ft lot
Tags
Property features AI
Finance
- HOA & community: Mandatory association with annual fee ($250); HOA covers grounds maintenance; HOA managed by Essex Management
Exterior
- Parking: 2-car attached garage
- Utilities: City water; City sewer; Located in a municipal utility district
- Home design: Single-family residence; Residential property; Entry across two stories; Year built 2026; Smart home features
- Construction: New construction (2026)
- Exterior features: Lot smaller than 0.5 acre (about 0.11 acre); Subdivision: Windmill Farms Ph 6b; No smoking restriction
Interior
- Kitchen: Electric range; Microwave; Refrigerator; Dishwasher
- Bedrooms: Primary bedroom located on level 2 (approx. 17 x 15)
- Bathrooms: 4 full bathrooms
- Interior features: Open floorplan; Two levels; One living area; One dining area; Room count of 3
- Laundry & utility: Washer; Dryer
Neighborhood map
What this means for you Summary
Snapshot
- This is a 5-bed/4.0-bath land listed at $3k.
Deal economics
- At list price, monthly cash flow is $2k ($25k/yr) — positive.
- The deal already cash-flows at list — no discount required.
- Meets the 1% rule at list price ($3k rent vs $3k).
- Cap rate 981.2% vs local median 3.8% in Terrell — top-decile yield for the area; either an underpriced asset or a hidden risk that comps aren't pricing in. Stress-test before assuming the spread holds.
Location & tenants
- Location reads 67/100 on livability (#520 in TX) — a middle-class / working-renter tenant base. Strengths: cost of living A+, housing A+; Watch: amenities C-, employment D, commute F.
- Forney ISD (rural): math 41% / reading 44% proficiency, ranked #234 of 826 in TX (top 28%) — families likely to look elsewhere, expect single-tenant / working-renter base with shorter leases.
- Zoned schools: Blackburn El (math 19% / reading 22%, grade F, #3,515 of 4,322 statewide, top 82%, 697 students, 53% FRL) — zoned schools average 53% FRL vs 26% district-wide (27 pts higher); higher-poverty schools than district average — tighter screening recommended.
- Zoned-school proficiency averages 20% at this address vs 42% district-wide (-22 pts) — the specific schools serving this property underperform the Forney ISD average; the district grade overstates school quality for this exact location.
- Market conditions: Rents rising (+1.4%/yr); 2179 active listings in the ZIP; 21 comparable units currently listed for rent nearby; rentals leasing fast (median 13d on market — plan ~1-2 weeks tenant-placement turnaround); solid renter incomes; 1,747 units permitted in Kaufman County in 2024 (180 in 5+ unit buildings).
- This rent runs 31% of the median local income ($104k/yr) — at the standard rent-burdened threshold; future hikes will face affordability resistance.
Forward outlook
- Local home prices are declining (-3.0%/yr); year-one equity from $18 of loan paydown is wiped out by about $78 of value loss. Plan a longer hold.
- Kaufman County population projected at +43% by 2050 — long-run rental-demand tailwind backs the buy-and-hold thesis.
- At projected returns (-3.0% appreciation + 1.4% rent growth), your $727 cash investment doubles in ~1 year — after that, you're playing with house money.
Negotiation context
- Only 8 days on market — expect competitive offers; lowballing is unlikely to land.
- 3 sale attempts with the ask held roughly flat each time — persistent listings suggest the price (not the market) is what's stuck; bring a comps-based counter.
Questions for the listing agent
- What does the HOA fee cover, when was the last increase, and are there any pending special assessments or reserve-fund shortfalls?
- Is there a deadline driving the sale (1031 exchange, divorce, estate, relocation)? That informs how much negotiation room exists.
- Schools are F-rated, which usually means shorter tenancies and higher turnover. Who's the typical renter profile here, and what's been the actual vacancy rate?
- The area grade is low — what's the realistic commute time and amenity access for the typical tenant pool here? Any planned neighborhood developments (good or bad) we should know about?
- What's the average days-on-market for RENTAL listings here right now (not sales)? A rising rental-DOM trend means longer vacancies and softer asking-rent achievability than the comps imply.
- What's the recent tenant-quality profile in this submarket — average credit score on applications, eviction rate, late-payment / NSF rate, and stable-employment percentage? A property-management company in the area should have these aggregated.
- How much new for-sale + rental construction is in the pipeline within 1–3 miles? Heavy new supply typically softens prices + rents 12–24 months out; constrained supply supports both.
Investment metrics
- 1% rule
- 104.73% ✓
- Cap rate
- 981.16%
- Cash-on-cash
- 3481.66%
- DSCR
- 155.91
- GRM
- 0.1
CMA / ARV
No comps found within radius.
Projected returns pro-forma
-3.0% appreciation · 1.42% rent growth · sell at horizon
- IRR
- —
- Equity multiple
- 179.43×
- Total profit
- $129,648
- Equity at exit
- $387
- IRR
- —
- Equity multiple
- 371.35×
- Total profit
- $269,098
- Equity at exit
- $224
Cash invested: $727 (down + closing). Projections, not guarantees.
Landlord ↔ Tenant lean methodology
- Overall (STATE)
- 87 Strongly Landlord-Friendly
- State Texas
- 87 Strongly Landlord-Friendly · R+5
- County
- — inherits STATE
- City
- — inherits STATE
ZIP-level market 75126
- Rents YoY
- 1.4%
- Active inventory
- 2179
- Price-to-rent
- 0.1×
Monthly cashflow live
- Estimated rent
- $2,718 high interval (Pro) →
- Mortgage (P&I)
- −$14
- Tax est. 1.5%
- −$3 /mo · $39/yr
- Insurance
- −$1
- HOA
- −$21
- Vacancy / Maint / Mgmt
- −$571
- Net cashflow
- $2,108
Break-even live
UW: 25.0% down · 7.5% · 30yr · 1.5% tax · 5.0% vac · 8.0% maint · 8.0% mgmt
Financing live
Cash to close
- Down payment
- $649
- Closing costs
- $78
- Reserves months
- —
- Total cash needed
- —
Loan-product check · same deal, 3 products live
Conventional
25% down · 7.5% · 30yr
- Down + closing
- —
- Monthly P&I
- —
- Monthly cashflow
- —
- DSCR
- —
- Eligible?
- —
Personal DTI + credit; lowest rate.
DSCR
20% down · 8.5% · 30yr
- Down + closing
- —
- Monthly P&I
- —
- Monthly cashflow
- —
- DSCR
- —
- Eligible?
- —
No personal income docs; deal must DSCR.
Hard money
10% down · 12.0% · 12mo
- Down + closing
- —
- Monthly P&I
- —
- Monthly cashflow
- —
- DSCR
- —
- Eligible?
- —
Short-term bridge; refi at stabilization.
Rent comps 21 comps
| Address | Beds | Baths | Sqft | Rent | $/sqft | DOM | Units | Dist |
|---|---|---|---|---|---|---|---|---|
| 6076 Mojave Dr Forney, TX | 5.0 | 4.0 | 2962 | $2,900 | $0.98 | 43d | 1 | 0.03mi |
| 6076 Mojave Dr Forney, TX | 5.0 | 4.0 | 2962 | $2,595 | $0.88 | 3d | 1 | 0.03mi |
| 6075 Mojave Dr Forney, TX | 5.0 | 3.0 | 2777 | $2,595 | $0.93 | 15d | 1 | 0.04mi |
| 5734 Roadhouse Forney, TX | 4.0 | 2.5 | 2121 | $2,350 | $1.11 | 1d | 1 | 0.09mi |
| 6229 Old Bridge Way Forney, TX | 4.0 | 2.5 | 2121 | $1,950 | $0.92 | 12d | 1 | 0.17mi |
| 6231 Old Bridge Way Forney, TX | 4.0 | 3.0 | 2308 | $2,300 | $1.00 | 1d | 1 | 0.18mi |
| 6310 Tropicana Ln Forney, TX | 5.0 | 3.0 | 2580 | $2,685 | $1.04 | 1d | 1 | 0.20mi |
| 4080 Dayton Dr Forney, TX | 4.0 | 2.5 | 1984 | $2,295 | $1.16 | 18d | 1 | 0.76mi |
| 1129 Clear Dusk Ln Forney, TX | 5.0 | 3.0 | 2520 | $3,600 | $1.43 | 43d | 1 | 1.03mi |
| 4424 Lassen Trl Forney, TX | 4.0 | 2.0 | 1984 | $2,295 | $1.16 | 43d | 1 | 1.06mi |
| 1229 Autumn Mist Ln Forney, TX | 4.0 | 3.0 | 2609 | $2,795 | $1.07 | 4d | 1 | 1.12mi |
| 3109 Chillingham Dr Forney, TX | 4.0 | 2.5 | 2181 | $2,199 | $1.01 | 2d | 1 | 1.15mi |
| 3024 Chico Dr Forney, TX | 5.0 | 2.5 | 2694 | $2,350 | $0.87 | 12d | 1 | 1.25mi |
| 9245 Switchgrass Ln Forney, TX | 4.0 | 2.5 | 3326 | $2,700 | $0.81 | 43d | 1 | 1.28mi |
| 1539 Wheatley Way Forney, TX | 4.0 | 3.0 | 2396 | $2,995 | $1.25 | 16d | 1 | 1.36mi |
| 1539 Wheatley Way Forney, TX | 4.0 | 3.0 | 2396 | $2,800 | $1.17 | 10d | 1 | 1.36mi |
| 3017 Villegas Way Forney, TX | 4.0 | 2.5 | 2153 | $2,150 | $1.00 | 43d | 1 | 1.36mi |
| 9200 Hawthorne Dr Forney, TX | 4.0 | 2.0 | 2037 | $2,440 | $1.20 | 11d | 1 | 1.36mi |
| 3012 Villegas Way Forney, TX | 5.0 | 2.5 | 2725 | $2,400 | $0.88 | 1d | 1 | 1.39mi |
| 1535 Calcot Ln Forney, TX | 4.0 | 3.0 | 2036 | $2,600 | $1.28 | 15d | 1 | 1.39mi |
| 8050 Privet St Forney, TX | 4.0 | 2.0 | 2045 | $2,100 | $1.03 | 24d | 1 | 1.47mi |
HOA detail
- Monthly dues
- $21 · $252/yr
Listing history 7 events
-
2026-05-21$2,595 Active
-
2026-05-18historical $2,900
-
2026-04-20price $2,900
-
2026-03-18$3,000
-
2026-03-13soldstatus Closed 387-char remark
Show marketing remark (387 chars)
MLS# 21164333 - Built by Starlight Homes - Ready Now! ~ This spacious 2-story home is the perfect new addition in your life. Enjoy an open concept kitchen and family room throughout the home and spread out in the second-floor loft. The kitchen features upgrades such as granite countertops, stainless steel appliances and a large island. Entertain friends on your very own private patio.
-
2026-02-23status Pending 387-char remark
Show marketing remark (387 chars)
MLS# 21164333 - Built by Starlight Homes - Ready Now! ~ This spacious 2-story home is the perfect new addition in your life. Enjoy an open concept kitchen and family room throughout the home and spread out in the second-floor loft. The kitchen features upgrades such as granite countertops, stainless steel appliances and a large island. Entertain friends on your very own private patio.
-
2026-01-27$330,990 Active 387-char remark
Show marketing remark (387 chars)
MLS# 21164333 - Built by Starlight Homes - Ready Now! ~ This spacious 2-story home is the perfect new addition in your life. Enjoy an open concept kitchen and family room throughout the home and spread out in the second-floor loft. The kitchen features upgrades such as granite countertops, stainless steel appliances and a large island. Entertain friends on your very own private patio.
ⓘ Source: listings_history table (triggers on properties + properties_extension) + one-shot
backfill from property_details.listing_events for pre-trigger history.
Nearby sold comps map
Loading sold comps map…
Walkable amenities ~0.75 mi
Loading nearby amenities…
Taxation est. · year 1
- Rental income
- $32,614
- − Mortgage interest
- −$145
- − Property taxes
- −$39
- − Insurance
- −$13
- − Repairs & maintenance
- −$2,609
- − Management
- −$2,609
- − HOA
- −$252
- − Depreciation
- −$75
- Taxable income
- $26,871
- Est. tax owed @ 24.0%
- −$6,449
- After-tax cash flow
- $18,849/yr
For passive investors: Depreciation is non-cash, so a rental often shows a tax loss while cash-flowing — sheltering income. Rental losses are passive: they offset passive income freely, and up to $25,000/yr can offset ordinary (W-2) income if you actively participate and your MAGI is under $100k (phasing out to $0 by $150k); unused losses carry forward. On sale, claimed depreciation is recaptured at up to 25%, and gains may owe capital-gains tax (a 1031 exchange can defer both). Figures are a year-1 estimate at your 24.0% rate — not tax advice; consult a CPA.
Schools (NCES district)
- District
- Forney ISD
- NCES district ID
- 4819560
- Math proficiency
- 41% ▼ -20.00%
- Reading proficiency
- 44% ▼ -12.00%
- Median HH income
- $86,679
- Composite
- 40.07/100
- National rank
- #3812
- State rank
- #234 of 826 in TX
Livability — Terrell
- Score
- 67/100
- State rank
- #520
- US rank
- #10213
Category grades
Schools grade is shown separately in the Schools card above.
Census & demographics
- County
- Kaufman County · 122,338 people
- City population
- 28,206
- Metro
- Dallas-Fort Worth-Arlington, TX
- Population (ZIP)
- 84,799
- Household income
- $103,673
- Rent vs Own
- Severe rent burden
- 1306.0
Population outlook (Kaufman County) Hauer SSP2
- Today (2025)
- 138,716 people
- By 2030
- 150,815 · +8.7%
- By 2040
- 174,877 · +26.1%
- By 2050
- 198,020 · +42.8%
- By 2075
- 251,908 · +81.6%
- By 2100
- 285,325 · +105.7%
Race, ethnicity, and origin ACS 2023
- Neighborhood character
- Diverse neighborhood (Simpson 0.68)
- Race & ethnicity
- White 45% Black 25% Hispanic / Latino 23% Two or more races 14% Asian 3%
- Hispanic origin (detail)
- Mexican 18% Puerto Rican 1%
- Common ancestry
- Italian 2% Slovak 1% Portuguese 1%
- Foreign-born
- 12% · Canada, Vietnam
- Languages at home
- 79% English-only · Spanish 14% Arabic 1% Vietnamese 1%
Political lean MEDSL · Kaufman
- 2024 margin
- Strong R (+27.9) · D 35.6% · R 63.5%
- 2008→2024 swing
- +7.9pp toward D · 2008: -35.8pp · 2024: -27.9pp
- All cycles
- 2024: R+27.9 2020: R+33.9 2016: R+47.0 2012: R+44.4 2008: R+35.8
Not yet ingested
- Civics
- —
Market trends
- HPI YoY
- ▼ -102.93%
- Current HPI
- 148.5749
- Rent YoY
- ▲ 1.42%
- Metro
- Dallas-Fort Worth-Arlington, TX
- State GDP YoY
- ▲ 3.95%
- F500 in state
- 110
Industry mix (Fortune 500 HQ in TX)
| Industry | F500 HQs | Revenue |
|---|---|---|
| Energy | 16 | $1,198B |
|
||
| Technology | 5 | $198B |
|
||
| Engineering / Construction | 4 | $72B |
|
||
| Energy Services | 3 | $60B |
|
||
| Utilities | 3 | $41B |
|
||
| Healthcare | 2 | $330B |
|
||
Price history
-99.2% since first listed7 events — show timeline
- 2026-05-21 Listed $2,595 NTREIS
- 2026-05-18 Rental Removed $2,900 NTREIS
- 2026-04-20 Price Changed $2,900 NTREIS
- 2026-03-18 Listed for Rent $3,000 NTREIS
- 2026-03-13 Sold (MLS) — NTREIS
- 2026-02-23 Pending — NTREIS
- 2026-01-27 Listed $330,990 NTREIS
Cash-flow waterfall
monthlySold comps — $/sqft
last 12 mo · ≤1 miLoading sold comps…