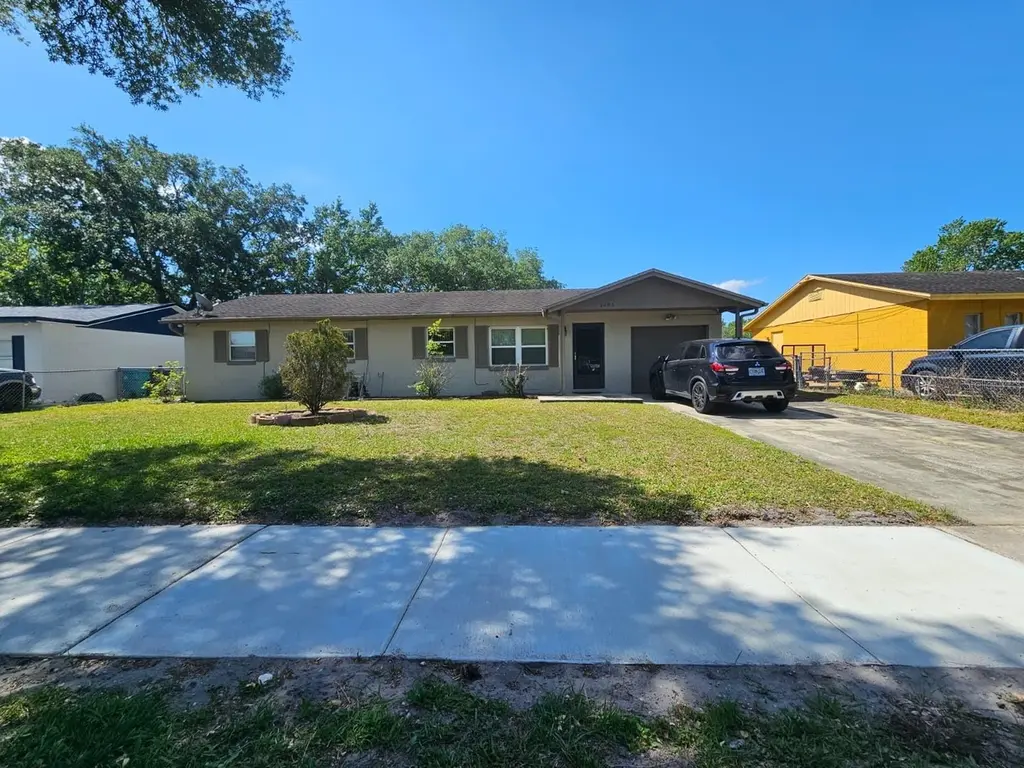
5483 Karen Ct · Orlando, FL
Flood risk 1/10 · Minimal
- FEMA flood zone
- X (unshaded)
- Chance of flooding over 30 yrs
- 0.0%
- Est. flood insurance / yr
- $507 – $1,088
Fire risk 2/10 · Minimal
- Est. fire insurance / yr
- $947 – $1,759
Heat risk 8/10 · Major
- Hot days now (above 108°F)
- 7 days/yr
- Hot days in 30 yrs
- 21 days/yr
Wind risk 9/10 · Severe
- Chance of severe wind over 30 yrs
- 99.0%
Air-quality risk 1/10 · Minimal
- Unhealthy air days now
- 0 days/yr
- Unhealthy air days in 30 yrs
- 0 days/yr
Risk factors via First Street. Map © Google.
Why this score? — see what drove the D+ grade
The composite is a weighted blend of 9 inputs, each scored 0–100. Each bar is that input's sub-score; the figure is the points it added to the 100-point composite (weight × sub-score).
- ARV discount +15.0/15.0
- Cash flow +12.6/30.0
- Livability +4.3/5.0
- Schools +4.1/10.0
- DSCR +3.8/10.0
- 1% rule +3.6/10.0
- Rent growth +2.5/5.0
- Condition / age +2.5/5.0
- Appreciation +0.0/10.0
$249,000
🖨 Deal sheet 📄 Offer letter ✓ Due diligence
Listing remarks
This residence features a 1-car attached garage and a spacious backyard complete with a convenient storage shed. The interior is well-maintained and includes all appliances. Key updates include a 2010 HVAC system and a roof installed in 2008. Connected to public water and sewer, this home is in good shape and offers a great foundation for those looking to add their own personal touch.
Key facts
- Public sewer
- Spacious backyard
- Attached garage
Tags
Property features AI
Finance
- Other: Unfurnished; Zoned R-1; Lot about 0.18 acres; Living area approximately 1,176 sq ft (public records)
Exterior
- Parking: Attached garage (1 car)
- Utilities: Public water; Public sewer; Public utilities
- Home design: Single family residence; One story; Facing east
- Construction: Concrete construction; Shingle roof; Slab foundation; Built as residential
- Exterior features: Other exterior features
Interior
- Kitchen: Refrigerator
- Bedrooms: 4 bedrooms
- Flooring: Carpet; Tile
- Bathrooms: 2 full bathrooms
- Heating & cooling: Central heating (electric); Central air conditioning
- Interior features: Ceiling fans
- Laundry & utility: In-home laundry room; Washer; Dryer
Neighborhood map
What this means for you Summary
Snapshot
- This is a 4-bed/2.0-bath single-family listed at $249k.
Deal economics
- At list price, monthly cash flow is $-32 ($-382/yr) — negative.
- To cash-flow at today's rent, offer at most $244k (1.8% below list).
- To meet the 1% rule (rent ≥ 1% of price), the offer needs to be $214k (14.1% below list).
- Recommended offer: $214k (14.1% below list) — sets the bar for 1% rule.
- Cap rate 6.1% vs local median 3.0% in Orlando — top-decile yield for the area; either an underpriced asset or a hidden risk that comps aren't pricing in. Stress-test before assuming the spread holds.
Location & tenants
- Location reads 86/100 on livability (#12 in FL, #360 nationally) — a professional / high-income tenant draw. Strengths: amenities A+, commute A+, housing A+.
- Orange (suburban): math 46% / reading 51% proficiency, ranked #43 of 73 in FL (top 59%) — families likely to look elsewhere, expect single-tenant / working-renter base with shorter leases.
- Market conditions: Rents flat; 238 active listings in the ZIP; 40 comparable units currently listed for rent nearby; rentals leasing fast (median 10d on market — plan ~1-2 weeks tenant-placement turnaround); 8,053 units permitted in Orange County in 2024 (3,133 in 5+ unit buildings).
- At $2,138/mo this rent would consume 47% of the median local household income ($54k/yr) (locally 2728% of renters already pay >50% of income on rent) — very limited rent-growth headroom before tenants either downsize or default.
Forward outlook
- Local home prices are declining (-3.0%/yr); year-one equity from $2k of loan paydown is wiped out by about $7k of value loss. Plan a longer hold.
- Orange County population projected at +52% by 2050 — long-run rental-demand tailwind backs the buy-and-hold thesis.
Negotiation context
- It's been on market 19 days — a 2% lower offer ($245k) is reasonable based on typical stale-listing flexibility.
- Current owner paid $45k; list at $249k implies a 455% gain — meaningful room to come down on a strong offer.
Risks & watch-outs
- Climate carrying-cost: severe wind risk, 99% chance of damaging wind over 30y; extreme-heat days projected 7→21/yr by 2055 (HVAC capex compounding) — expect insurance premiums to compound above CPI over the hold.
Questions for the listing agent
- What do current leases actually rent for vs. the listed asking? Can we see a recent rent roll and the last 12 months of T-12 income?
- Built in 1972 — when were the roof, HVAC, electrical panel, plumbing, and water heater last replaced?
- Is there a deadline driving the sale (1031 exchange, divorce, estate, relocation)? That informs how much negotiation room exists.
- Schools are B-rated — typically a magnet for longer-tenancy family renters. What's the average tenant stay here, and is there a school-zone premium baked into asking?
- The area grade is low — what's the realistic commute time and amenity access for the typical tenant pool here? Any planned neighborhood developments (good or bad) we should know about?
- What's the average days-on-market for RENTAL listings here right now (not sales)? A rising rental-DOM trend means longer vacancies and softer asking-rent achievability than the comps imply.
- What's the recent tenant-quality profile in this submarket — average credit score on applications, eviction rate, late-payment / NSF rate, and stable-employment percentage? A property-management company in the area should have these aggregated.
- How much new for-sale + rental construction is in the pipeline within 1–3 miles? Heavy new supply typically softens prices + rents 12–24 months out; constrained supply supports both.
Investment metrics
- 1% rule
- 0.86% ✗
- Cap rate
- 6.14%
- Cash-on-cash
- -0.55%
- DSCR
- 0.98
- GRM
- 9.7
CMA / ARV
- ARV (on-the-fly)
- $311,640
- Comps found
- 4
Show comp detail 4 sales within ~0.75 mi
| Address | Dist | Beds/Ba | Sqft | Sold | Price | $/sf | Match |
|---|---|---|---|---|---|---|---|
| 1229 Lescot Ln | 0.62mi | 4/2.0 | 1,104 (-6%) | 9mo | $259,000 | $235 | 54 |
| 5133 Luna Negra Dr | 0.59mi | 3/2.0 (-1) | 1,148 (-2%) | 23mo | $340,000 | $296 | 44 |
| 5022 Lanette St | 0.47mi | 3/1.5 (-1) | 1,020 (-13%) | 8mo | $270,000 | $265 | 42 |
| 4752 Amoy Ct | 0.72mi | 3/1.5 (-1) | 1,104 (-6%) | 20mo | $196,000 | $178 | 33 |
Match score weights: distance 35% · size 25% · config 20% · recency 20%. Top-matched comps best support the ARV.
Projected returns pro-forma
-3.0% appreciation · 0.15% rent growth · sell at horizon
- IRR
- -20.4%
- Equity multiple
- 0.31×
- Total profit
- $-48,303
- Equity at exit
- $37,127
- IRR
- -21.6%
- Equity multiple
- 0.03×
- Total profit
- $-67,643
- Equity at exit
- $21,529
Cash invested: $69,720 (down + closing). Projections, not guarantees.
Landlord ↔ Tenant lean methodology
- Overall (STATE)
- 87 Strongly Landlord-Friendly
- State Florida
- 87 Strongly Landlord-Friendly · R+3
- County
- — inherits STATE
- City
- — inherits STATE
ZIP-level market 32811
- Home prices YoY
- -33.8%
- Rents YoY
- 0.1%
- Active inventory
- 238
- Price-to-rent
- 9.7×
Monthly cashflow live
- Estimated rent
- $2,138 high interval (Pro) →
- Mortgage (P&I)
- −$1,306
- Tax est. 1.5%
- −$311 /mo · $3,735/yr
- Insurance
- −$104
- HOA
- −$0
- Vacancy / Maint / Mgmt
- −$449
- Net cashflow
- $-32
Break-even live
UW: 25.0% down · 7.5% · 30yr · 1.5% tax · 5.0% vac · 8.0% maint · 8.0% mgmt
Financing live
Cash to close
- Down payment
- $62,250
- Closing costs
- $7,470
- Reserves months
- —
- Total cash needed
- —
Loan-product check · same deal, 3 products live
Conventional
25% down · 7.5% · 30yr
- Down + closing
- —
- Monthly P&I
- —
- Monthly cashflow
- —
- DSCR
- —
- Eligible?
- —
Personal DTI + credit; lowest rate.
DSCR
20% down · 8.5% · 30yr
- Down + closing
- —
- Monthly P&I
- —
- Monthly cashflow
- —
- DSCR
- —
- Eligible?
- —
No personal income docs; deal must DSCR.
Hard money
10% down · 12.0% · 12mo
- Down + closing
- —
- Monthly P&I
- —
- Monthly cashflow
- —
- DSCR
- —
- Eligible?
- —
Short-term bridge; refi at stabilization.
Rent comps 40 comps
| Address | Beds | Baths | Sqft | Rent | $/sqft | DOM | Units | Dist |
|---|---|---|---|---|---|---|---|---|
| 1401 S Kirkman Rd Orlando, FL | 1.0–3.0 | 1.0–2.0 | 975 | $2,116 | $2.17 | 1d | 32 | 0.24mi |
| 1025 Clovercrest Rd Orlando, FL | 3.0 | 2.0 | 1050 | $2,100 | $2.00 | 23d | 1 | 0.25mi |
| 1025 Clovercrest Rd Orlando, FL | 3.0 | 2.0 | 1050 | $2,100 | $2.00 | 17d | 1 | 0.25mi |
| 907 S Kirkman Rd Orlando, FL | 2.0–4.0 | 2.0 | 1131 | $1,871 | $1.65 | 2d | 14 | 0.25mi |
| 5300 Lescot Ln Orlando, FL | 3.0 | 2.0 | 1143 | $1,900 | $1.66 | 23d | 1 | 0.27mi |
| 5235 Florida Holly Dr Orlando, FL | 3.0 | 2.0 | 1107 | $2,100 | $1.90 | 23d | 1 | 0.31mi |
| 1601 S Kirkman Rd Orlando, FL | 1.0–3.0 | 1.0–2.0 | 876 | $1,980 | $2.26 | 1d | 23 | 0.37mi |
| 5132 Elese St Orlando, FL | 3.0 | 2.0 | 960 | $1,800 | $1.88 | 16d | 1 | 0.40mi |
| 5425 Wood Crossing St Orlando, FL | 4.0 | 2.0 | 1300 | $2,200 | $1.69 | 4d | 1 | 0.50mi |
| 1343 Croyle Dr Orlando, FL | 4.0 | 2.0 | 1273 | $1,900 | $1.49 | 23d | 1 | 0.52mi |
| 5915 Raleigh St Orlando, FL | 1.0–3.0 | 1.0–2.0 | 1039 | $3,204 | $3.08 | 1d | 28 | 0.53mi |
| 1935 S Kirkman Rd Orlando, FL | 1.0–3.0 | 1.0–2.0 | 1020 | $2,150 | $2.11 | 2d | 14 | 0.60mi |
| 4957 Vista Lago Dr Orlando, FL | 4.0 | 2.0 | 1364 | $2,228 | $1.63 | 7d | 1 | 0.64mi |
| 6168 Raleigh St Orlando, FL | 1.0–4.0 | 1.0–2.0 | 1261 | $2,947 | $2.34 | 2d | 34 | 0.67mi |
| 6101 Raleigh St Orlando, FL | 1.0–4.0 | 1.0–2.0 | 1120 | $2,284 | $2.04 | 2d | 41 | 0.70mi |
| 464 S Kirkman Rd Orlando, FL | 1.0–3.0 | 1.0–2.0 | 977 | $2,375 | $2.43 | 2d | 19 | 0.74mi |
| 5036 College Dr Orlando, FL | 3.0 | 1.0 | 1500 | $1,800 | $1.20 | 23d | 1 | 0.76mi |
| 5979 Westgate Dr #1021 Orlando, FL | 3.0 | 2.0 | 1308 | $1,800 | $1.38 | 14d | 1 | 0.83mi |
| 4655 Cepeda St Orlando, FL | 3.0 | 1.5 | 1266 | $1,695 | $1.34 | 23d | 1 | 0.89mi |
| 4995 Mercer St Orlando, FL | 3.0 | 2.0 | 1386 | $2,500 | $1.80 | 2d | 1 | 0.91mi |
| 6141 Metrowest Blvd Orlando, FL | 3.0 | 2.0 | 1285 | $1,772 | $1.38 | 7d | 2 | 0.94mi |
| 5578 Metrowest Blvd #203 Orlando, FL | 3.0 | 2.0 | 1362 | $1,800 | $1.32 | 7d | 1 | 0.96mi |
| 5578 Metrowest Blvd Orlando, FL | 1.0–3.0 | 1.0–2.0 | 1101 | $1,800 | $1.63 | 4d | 3 | 0.96mi |
| 5578 Metrowest Blvd Orlando, FL | 1.0–3.0 | 1.0–2.0 | 1101 | $1,800 | $1.63 | 10d | 2 | 0.96mi |
| 5578 Metrowest Blvd Orlando, FL | 1.0–3.0 | 1.0–2.0 | 1101 | $1,800 | $1.63 | 3d | 2 | 0.96mi |
| 4638 America St Orlando, FL | 5.0 | 1.0 | 1500 | $1,700 | $1.13 | 13d | 1 | 1.00mi |
| 6169 Metrowest Blvd #307 Orlando, FL | 3.0 | 2.0 | 1369 | $1,900 | $1.39 | 21d | 1 | 1.05mi |
| 6169 Metrowest Blvd Orlando, FL | 3.0 | 2.0 | 1327 | $1,818 | $1.37 | 1d | 2 | 1.05mi |
| 1920 Willie Mays Pkwy Orlando, FL | 4.0 | 2.0 | 1446 | $2,070 | $1.43 | 19d | 1 | 1.06mi |
| 4529 W Gore Ave Orlando, FL | 3.0 | 2.0 | 1439 | $2,549 | $1.77 | 19d | 1 | 1.06mi |
| 4487 Wheatley St Orlando, FL | 4.0 | 2.0 | 1249 | $1,950 | $1.56 | 20d | 1 | 1.12mi |
| 6402 Cava Alta Dr Orlando, FL | 3.0 | 2.0 | 1331 | $1,900 | $1.43 | 7d | 1 | 1.15mi |
| 6402 Cava Alta Dr Orlando, FL | 3.0 | 2.0 | 1248 | $1,900 | $1.52 | 23d | 2 | 1.15mi |
| 1224 S Hiawassee Rd #620 Orlando, FL | 3.0 | 2.0 | 1206 | $1,875 | $1.55 | 23d | 1 | 1.17mi |
| 1212 S Hiawassee Rd Orlando, FL | 2.0–3.0 | 2.0 | 1229 | $1,900 | $1.55 | 23d | 3 | 1.17mi |
| 2484 San Tecla St Orlando, FL | 2.0–3.0 | 2.0 | 1279 | $2,100 | $1.64 | 20d | 3 | 1.18mi |
| 2484 San Tecla St Orlando, FL | 2.0–3.0 | 2.0 | 1262 | $2,100 | $1.66 | 17d | 2 | 1.18mi |
| 6500 Metrowest Blvd Orlando, FL | 1.0–3.0 | 1.0–2.0 | 911 | $2,260 | $2.48 | 1d | 19 | 1.26mi |
| 3313 S Kirkman Rd Orlando, FL | 3.0 | 2.0 | 1431 | $1,745 | $1.22 | 3d | 2 | 1.26mi |
| 3313 S Kirkman Rd Orlando, FL | 3.0 | 2.0 | 1431 | $1,745 | $1.22 | 2d | 2 | 1.26mi |
Listing history 3 events
-
2026-05-07status Pending
-
2026-04-18$249,000 Active
-
1989-12-01soldstatus $44,900
ⓘ Source: listings_history table (triggers on properties + properties_extension) + one-shot
backfill from property_details.listing_events for pre-trigger history.
Climate risk First Street
- Flood 1/10 Low FEMA zone X (unshaded) · 0% chance over 30 yrs
- Wildfire 2/10 Low
- Heat 8/10 Severe 7 d/yr ≥108°F today · 21 d/yr by 30 yrs out
- Wind 9/10 Extreme 99% chance of damaging wind over 30 yrs
- Air quality 1/10 Low 0 unhealthy d/yr today · 0 by 30 yrs out
Nearby sold comps map
Loading sold comps map…
Walkable amenities ~0.75 mi
Loading nearby amenities…
Taxation est. · year 1
- Rental income
- $25,656
- − Mortgage interest
- −$13,948
- − Property taxes
- −$3,735
- − Insurance
- −$1,245
- − Repairs & maintenance
- −$2,052
- − Management
- −$2,052
- − Depreciation
- −$7,244
- Taxable loss
- −$4,621
- Est. tax savings @ 24.0%
- +$1,109
- After-tax cash flow
- $727/yr
For passive investors: Depreciation is non-cash, so a rental often shows a tax loss while cash-flowing — sheltering income. Rental losses are passive: they offset passive income freely, and up to $25,000/yr can offset ordinary (W-2) income if you actively participate and your MAGI is under $100k (phasing out to $0 by $150k); unused losses carry forward. On sale, claimed depreciation is recaptured at up to 25%, and gains may owe capital-gains tax (a 1031 exchange can defer both). Figures are a year-1 estimate at your 24.0% rate — not tax advice; consult a CPA.
Schools (NCES district)
- District
- Orange
- NCES district ID
- 1201440
- Math proficiency
- 46% ▼ -9.00%
- Reading proficiency
- 51% ▼ -2.00%
- Median HH income
- $49,350
- Composite
- 41.47/100
- National rank
- #3461
- State rank
- #43 of 73 in FL
Livability — Orlando
- Score
- 86/100
- State rank
- #12
- US rank
- #360
Category grades
Schools grade is shown separately in the Schools card above.
Census & demographics
- Census place
- Orlando, FL
- County
- Orange County · 1,471,359 people
- City population
- 964,969
- Metro
- Orlando-Kissimmee-Sanford, FL
- Population (ZIP)
- 41,475
- Household income
- $54,082
- Rent vs Own
- Severe rent burden
- 2728.0
Population outlook (Orange County) Hauer SSP2
- Today (2025)
- 1,618,226 people
- By 2030
- 1,787,404 · +10.5%
- By 2040
- 2,125,621 · +31.4%
- By 2050
- 2,454,016 · +51.6%
- By 2075
- 3,173,711 · +96.1%
- By 2100
- 3,607,781 · +122.9%
Race, ethnicity, and origin ACS 2023
- Neighborhood character
- Diverse neighborhood (Simpson 0.66)
- Race & ethnicity
- Black 50% Hispanic / Latino 27% Two or more races 17% White 12% Asian 2%
- Hispanic origin (detail)
- Mexican 2% Puerto Rican 8% Dominican 2%
- Common ancestry
- Hispanic 7% Estonian 4% Russian 1%
- Foreign-born
- 31% · Canada, Jamaica, China
- Languages at home
- 62% English-only · Spanish 21% French/Haitian/Cajun 8% Other Indo-European 6%
Political lean MEDSL · Orange
- 2024 margin
- D (+13.6) · D 56.1% · R 42.5% · Other 1.3%
- 2008→2024 swing
- -5.0pp toward R · 2008: 18.6pp · 2024: 13.6pp
- All cycles
- 2024: D+13.6 2020: D+23.1 2016: D+24.6 2012: D+18.2 2008: D+18.6
Not yet ingested
- Civics
- —
Market trends
- HPI YoY
- ▼ -145.37%
- Current HPI
- 284.9191
- Rent YoY
- ▲ 0.15%
- Metro
- Orlando-Kissimmee-Sanford, FL
- State GDP YoY
- ▲ 3.28%
- F500 in state
- 36
Industry mix (Fortune 500 HQ in FL)
| Industry | F500 HQs | Revenue |
|---|---|---|
| Industrial Technology | 2 | $29B |
|
||
| Insurance | 2 | $17B |
|
||
| Retail | 1 | $60B |
|
||
| Technology Distribution | 1 | $58B |
|
||
| Homebuilding | 1 | $35B |
|
||
| Technology Manufacturing | 1 | $35B |
|
||
Price history
+454.6% since first listed3 events — show timeline
- 2026-05-07 Pending — Stellar MLS as Distributed by MLS Grid
- 2026-04-18 Listed $249,000 Stellar MLS as Distributed by MLS Grid
- 1989-12-01 Sold (Public Records) $44,900 Public Records
Property tax history
+4.1%/yrLatest (2025): $272 · +20.9% YoY. Source: county tax records.
Cash-flow waterfall
monthlySold comps — $/sqft
last 12 mo · ≤1 miLoading sold comps…