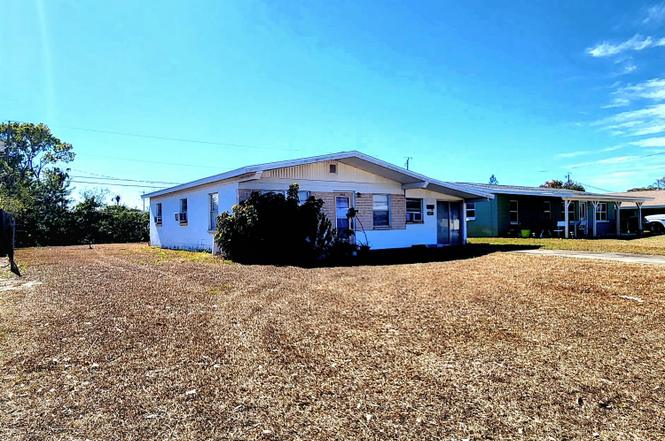
2455 Pepper Ave · Melbourne, FL
Flood risk 1/10 · Minimal
- FEMA flood zone
- X (unshaded)
- Chance of flooding over 30 yrs
- 0.0%
- Est. flood insurance / yr
- $507 – $1,088
Fire risk 3/10 · Minor
- Est. fire insurance / yr
- $947 – $1,759
Heat risk 10/10 · Severe
- Hot days now (above 105°F)
- 7 days/yr
- Hot days in 30 yrs
- 25 days/yr
Wind risk 10/10 · Severe
- Chance of severe wind over 30 yrs
- 99.0%
Air-quality risk 1/10 · Minimal
- Unhealthy air days now
- 0 days/yr
- Unhealthy air days in 30 yrs
- 0 days/yr
Risk factors via First Street. Map © Google.
Why this score? — see what drove the C grade
The composite is a weighted blend of 9 inputs, each scored 0–100. Each bar is that input's sub-score; the figure is the points it added to the 100-point composite (weight × sub-score).
- Cash flow +24.1/30.0
- DSCR +7.8/10.0
- ARV discount +7.5/15.0
- 1% rule +4.9/10.0
- Schools +4.7/10.0
- Rent growth +2.6/5.0
- Livability +2.5/5.0
- Condition / age +2.5/5.0
- Appreciation +0.0/10.0
$165,000
🖨 Deal sheet 📄 Offer letter ✓ Due diligence
Listing remarks MLS
-
Key facts
- Fenced yard
- Centrally located
- Wickham park
Tags
Property features AI
Exterior
- Parking: Other parking type
- Utilities: 150 Amp electrical service; Public sewer; Cable available
- Home design: Single family residence; One story; West-facing
- Construction: Block, concrete and stucco construction; Shingle roof
- Exterior features: Back yard fencing; Shed(s); Other exterior features
Interior
- Kitchen: Gas range; Refrigerator
- Bedrooms: 3 bedrooms
- Flooring: Laminate; Vinyl; Other
- Bathrooms: 1 full bathroom
- Heating & cooling: Wall/window cooling units; No central heating listed
- Interior features: Eat-in kitchen; Primary bathroom with shower (no tub)
- Laundry & utility: In-unit laundry; Washer; Dryer; Electric water heater
Neighborhood map
What this means for you Summary
Snapshot
- This is a 2-bed/1.0-bath single-family listed at $165k.
Deal economics
- At list price, monthly cash flow is $325 ($4k/yr) — positive.
- The deal already cash-flows at list — no discount required.
- To meet the 1% rule (rent ≥ 1% of price), the offer needs to be $164k (0.8% below list).
- Recommended offer: $145k (12.0% below list) — sets the bar for market timing.
Location & tenants
- Location reads: area grade C — affects rentability + tenant quality, not the cash-flow math above.
- Brevard (suburban): math 53% / reading 57% proficiency, ranked #19 of 73 in FL (top 26%) — acceptable for families but not a draw, mixed tenant base, ~2y average lease.
- Zoned schools: Sabal Elementary School (math 38% / reading 41%, grade F, #1,513 of 2,144 statewide, top 73%, 503 students, 69% FRL); Lyndon B. Johnson Middle School (math 40% / reading 42%, grade F, #353 of 571 statewide, top 63%, 610 students, 61% FRL); Eau Gallie High School (math 20% / reading 49%, grade F, #386 of 667 statewide, top 59%, 1,586 students, 55% FRL) — zoned schools average 62% FRL vs 43% district-wide (19 pts higher); higher-poverty schools than district average — tighter screening recommended.
- Zoned-school proficiency averages 38% at this address vs 55% district-wide (-17 pts) — the specific schools serving this property underperform the Brevard average; the district grade overstates school quality for this exact location.
- Market conditions: Rents flat; 332 active listings in the ZIP; 17 comparable units currently listed for rent nearby; rentals at typical pace (median 24d on market — plan ~3-4 weeks tenant-placement turnaround); 4,602 units permitted in Brevard County in 2024 (702 in 5+ unit buildings).
- This rent runs 30% of the median local income ($65k/yr) — at the standard rent-burdened threshold; future hikes will face affordability resistance.
Forward outlook
- Local home prices are declining (-3.0%/yr); year-one equity from $1k of loan paydown is wiped out by about $5k of value loss. Plan a longer hold.
- Brevard County population projected at +15% by 2050 — modest demand growth; plan on rents tracking national, not racing it.
Negotiation context
- It's been on market 135 days — a 12% lower offer ($145k) is reasonable based on typical stale-listing flexibility.
- 6 sale attempts since 16y ago; this cycle's ask has dropped $15k (8%) from the opening price — seller is motivated, your offer sets the floor, not the list.
- Current owner paid $48k; list at $165k implies a 247% gain — meaningful room to come down on a strong offer.
Risks & watch-outs
- Watch-outs: built in 1958 — expect roof / HVAC / electrical / plumbing capex.
- Climate carrying-cost: severe wind risk, 99% chance of damaging wind over 30y; extreme-heat days projected 7→25/yr by 2055 (HVAC capex compounding) — expect insurance premiums to compound above CPI over the hold.
Questions for the listing agent
- It's been on market 135 days. Have you received any prior offers? Is the seller open to a 12% concession, seller financing, or rate buy-down credit?
- Built in 1958 — when were the roof, HVAC, electrical panel, plumbing, and water heater last replaced?
- Why hasn't it sold? Are there any deal-killer items the seller is aware of (foundation, flood, title, zoning, code violations)?
- Is there a deadline driving the sale (1031 exchange, divorce, estate, relocation)? That informs how much negotiation room exists.
- What's the average days-on-market for RENTAL listings here right now (not sales)? A rising rental-DOM trend means longer vacancies and softer asking-rent achievability than the comps imply.
- What's the recent tenant-quality profile in this submarket — average credit score on applications, eviction rate, late-payment / NSF rate, and stable-employment percentage? A property-management company in the area should have these aggregated.
- How much new for-sale + rental construction is in the pipeline within 1–3 miles? Heavy new supply typically softens prices + rents 12–24 months out; constrained supply supports both.
Investment metrics
- 1% rule
- 0.99% ✗
- Cap rate
- 8.65%
- Cash-on-cash
- 8.43%
- DSCR
- 1.38
- GRM
- 8.4
CMA / ARV
No comps found within radius.
Projected returns pro-forma
-3.0% appreciation · 0.53% rent growth · sell at horizon
- IRR
- -6.0%
- Equity multiple
- 0.78×
- Total profit
- $-10,107
- Equity at exit
- $24,602
- IRR
- 0.7%
- Equity multiple
- 1.04×
- Total profit
- $1,993
- Equity at exit
- $14,266
Cash invested: $46,200 (down + closing). Projections, not guarantees.
Landlord ↔ Tenant lean methodology
- Overall (STATE)
- 87 Strongly Landlord-Friendly
- State Florida
- 87 Strongly Landlord-Friendly · R+3
- County
- — inherits STATE
- City
- — inherits STATE
ZIP-level market 32935
- Rents YoY
- 0.5%
- Active inventory
- 332
- Price-to-rent
- 8.4×
Monthly cashflow live
- Estimated rent
- $1,637 high interval (Pro) →
- Mortgage (P&I)
- −$865
- Tax from tax record
- −$35 /mo · $417/yr
- Insurance
- −$69
- HOA
- −$0
- Vacancy / Maint / Mgmt
- −$344
- Net cashflow
- $325
Break-even live
UW: 25.0% down · 7.5% · 30yr · 1.5% tax · 5.0% vac · 8.0% maint · 8.0% mgmt
Financing live
Cash to close
- Down payment
- $41,250
- Closing costs
- $4,950
- Reserves months
- —
- Total cash needed
- —
Loan-product check · same deal, 3 products live
Conventional
25% down · 7.5% · 30yr
- Down + closing
- —
- Monthly P&I
- —
- Monthly cashflow
- —
- DSCR
- —
- Eligible?
- —
Personal DTI + credit; lowest rate.
DSCR
20% down · 8.5% · 30yr
- Down + closing
- —
- Monthly P&I
- —
- Monthly cashflow
- —
- DSCR
- —
- Eligible?
- —
No personal income docs; deal must DSCR.
Hard money
10% down · 12.0% · 12mo
- Down + closing
- —
- Monthly P&I
- —
- Monthly cashflow
- —
- DSCR
- —
- Eligible?
- —
Short-term bridge; refi at stabilization.
Rent comps 17 comps
| Address | Beds | Baths | Sqft | Rent | $/sqft | DOM | Units | Dist |
|---|---|---|---|---|---|---|---|---|
| 2587 Pepper Ave Melbourne, FL | 3.0 | 1.0 | 800 | $1,575 | $1.97 | 23d | 1 | 0.17mi |
| 848 Comanche Ave Melbourne, FL | 3.0 | 2.0 | 1080 | $1,950 | $1.81 | 23d | 1 | 0.17mi |
| 2659 Burns Ave Melbourne, FL | 3.0 | 1.0 | 1044 | $1,850 | $1.77 | 23d | 1 | 0.25mi |
| 2794 Rhonda Ln Melbourne, FL | 2.0 | 2.0 | 996 | $1,900 | $1.91 | 23d | 1 | 0.42mi |
| 1225 N Wickham Rd #726 Melbourne, FL | 2.0 | 2.0 | 859 | $1,500 | $1.75 | 21d | 1 | 0.57mi |
| 2910 Zephyr Ln Melbourne, FL | 2.0 | 1.0 | 828 | $1,700 | $2.05 | 23d | 1 | 0.61mi |
| 1965 Barkley Ave Melbourne, FL | 3.0 | 1.0 | 1000 | $1,600 | $1.60 | 23d | 1 | 0.65mi |
| 820 N Wickham Rd Melbourne, FL | 1.0–2.0 | 1.0 | 720 | $1,385 | $1.92 | 14d | 8 | 0.75mi |
| 1688 Eisenhower Ave Melbourne, FL | 3.0 | 1.5 | 988 | $1,700 | $1.72 | 23d | 1 | 0.86mi |
| 653 Ridge Club Dr #27 Melbourne, FL | 2.0 | 1.5 | 900 | $1,550 | $1.72 | 23d | 1 | 0.92mi |
| 500 N Wickham Rd Melbourne, FL | 2.0 | 2.0 | 1000 | $1,449 | $1.45 | 14d | 8 | 0.93mi |
| 1032 Hidden Harbour Dr Melbourne, FL | 1.0 | 1.0 | 921 | $1,249 | $1.36 | 23d | 1 | 1.27mi |
| 1032 Hidden Harbour Dr Melbourne, FL | 1.0 | 1.0 | 752 | $1,259 | $1.67 | 14d | 1 | 1.27mi |
| 2242 Flower Tree Cir Melbourne, FL | 2.0 | 2.0 | 879 | $1,300 | $1.48 | 23d | 1 | 1.35mi |
| 109 San Juan Cir Melbourne, FL | 2.0 | 1.0 | 955 | $1,400 | $1.47 | 21d | 1 | 1.36mi |
| 196 San Juan Cir Melbourne, FL | 2.0 | 1.0 | 955 | $1,400 | $1.47 | 23d | 1 | 1.37mi |
| 214 San Juan Cir Melbourne, FL | 1.0 | 1.0 | 708 | $1,250 | $1.77 | 23d | 1 | 1.38mi |
Listing history 27 events
-
2026-06-18days on market $165,000 Active 135 DOM
-
2026-06-17days on market $165,000 Active 134 DOM
-
2026-06-16days on market $165,000 Active 133 DOM
-
2026-06-15days on market $165,000 Active 132 DOM
-
2026-06-14statusdays on market $165,000 Active 130 DOM
-
2026-06-10days on market $165,000 Active Under Contract 127 DOM
-
2026-06-08days on market $165,000 Active Under Contract 125 DOM
-
2026-06-07days on market $165,000 Active Under Contract 124 DOM
-
2026-06-05days on market $165,000 Active Under Contract 121 DOM
-
2026-06-03days on market $165,000 Active Under Contract 120 DOM
-
2026-06-02days on market $165,000 Active Under Contract 119 DOM
-
2026-06-01statusdays on market $165,000 Active Under Contract 118 DOM
-
2026-05-31days on market $165,000 Active 117 DOM
-
2026-05-31pricedays on market $165,000 Active 116 DOM
-
2026-05-07price $174,900
-
2026-04-04status Active
-
2026-03-04historical Active Under Contract
-
2026-02-25status Active
-
2026-02-20historical Active Under Contract
-
2026-02-19status Active
-
2026-02-06historical Active Under Contract
-
2026-02-03$179,900 Active
-
2017-03-23historical 1-char remark
Show marketing remark (1 chars)
-
-
2011-04-05soldstatus $47,500
-
2011-03-30soldstatus $47,500 424-char remark
Show marketing remark (424 chars)
ESTATE SALE! Great deal on a lovingly maintained and updated home, with workshop in shed. Bonus Room could be used as 3rd bedroom. Wonderful established neighborhood within minutes to every convenience! All modern appliances are included - even washer & dryer! Recently replaced roof with dimensional shingles. Brand new electric and breakers. Clean as a whistle! Nice and pretty and ready for the lucky new homeowner!
-
2011-01-07$54,900 424-char remark
Show marketing remark (424 chars)
ESTATE SALE! Great deal on a lovingly maintained and updated home, with workshop in shed. Bonus Room could be used as 3rd bedroom. Wonderful established neighborhood within minutes to every convenience! All modern appliances are included - even washer & dryer! Recently replaced roof with dimensional shingles. Brand new electric and breakers. Clean as a whistle! Nice and pretty and ready for the lucky new homeowner!
-
2010-11-18$65,000 1-char remark
Show marketing remark (1 chars)
-
ⓘ Source: listings_history table (triggers on properties + properties_extension) + one-shot
backfill from property_details.listing_events for pre-trigger history.
Tax reassessment forecast FL · Resets to sale price
- Current annual tax
- $417 · $35/mo
- Projected year-2 tax
- $1,370 · $114/mo
- Expected delta
- +$952/yr (+$79/mo · 228.3%)
ⓘ Screening estimate from a state-policy table — verify with the county assessor before closing.
Climate risk First Street
- Flood 1/10 Low FEMA zone X (unshaded) · 0% chance over 30 yrs
- Wildfire 3/10 Moderate
- Heat 10/10 Extreme 7 d/yr ≥105°F today · 25 d/yr by 30 yrs out
- Wind 10/10 Extreme 99% chance of damaging wind over 30 yrs
- Air quality 1/10 Low 0 unhealthy d/yr today · 0 by 30 yrs out
Nearby sold comps map
Loading sold comps map…
Walkable amenities ~0.75 mi
Loading nearby amenities…
Taxation est. · year 1
- Rental income
- $19,648
- − Mortgage interest
- −$9,243
- − Property taxes
- −$417
- − Insurance
- −$825
- − Repairs & maintenance
- −$1,572
- − Management
- −$1,572
- − Depreciation
- −$4,800
- Taxable income
- $1,220
- Est. tax owed @ 24.0%
- −$293
- After-tax cash flow
- $3,604/yr
For passive investors: Depreciation is non-cash, so a rental often shows a tax loss while cash-flowing — sheltering income. Rental losses are passive: they offset passive income freely, and up to $25,000/yr can offset ordinary (W-2) income if you actively participate and your MAGI is under $100k (phasing out to $0 by $150k); unused losses carry forward. On sale, claimed depreciation is recaptured at up to 25%, and gains may owe capital-gains tax (a 1031 exchange can defer both). Figures are a year-1 estimate at your 24.0% rate — not tax advice; consult a CPA.
Schools (NCES district)
- District
- Brevard
- NCES district ID
- 1200150
- Math proficiency
- 53% ▼ -9.00%
- Reading proficiency
- 57% ▼ -4.00%
- Median HH income
- $49,426
- Composite
- 46.86/100
- National rank
- #2370
- State rank
- #19 of 73 in FL
Livability — Melbourne
No livability data for this city. (Only ~50 U.S. cities are tracked.)
Census & demographics
- Census place
- Melbourne, FL
- County
- Brevard County · 602,871 people
- City population
- 178,420
- Metro
- Palm Bay-Melbourne-Titusville, FL
- Population (ZIP)
- 41,965
- Household income
- $64,588
- Rent vs Own
- Severe rent burden
- 1747.0
Population outlook (Brevard County) Hauer SSP2
- Today (2025)
- 623,254 people
- By 2030
- 648,420 · +4.0%
- By 2040
- 690,009 · +10.7%
- By 2050
- 715,669 · +14.8%
- By 2075
- 775,744 · +24.5%
- By 2100
- 776,687 · +24.6%
Race, ethnicity, and origin ACS 2023
- Neighborhood character
- Predominantly White (74%)
- Race & ethnicity
- White 74% Hispanic / Latino 13% Two or more races 9% Black 5% Asian 2%
- Hispanic origin (detail)
- Mexican 3% Puerto Rican 5%
- Common ancestry
- Slovak 2% Romanian 2% Lithuanian 2%
- Foreign-born
- 9% · Canada, Vietnam, Jamaica
- Languages at home
- 88% English-only · Spanish 8% Other Indo-European 1% Tagalog/Filipino 1%
Political lean MEDSL · Brevard
- 2024 margin
- Strong R (+20.8) · D 39.1% · R 59.9% · Other 1.0%
- 2008→2024 swing
- -10.4pp toward R · 2008: -10.4pp · 2024: -20.8pp
- All cycles
- 2024: R+20.8 2020: R+16.4 2016: R+19.8 2012: R+12.7 2008: R+10.4
Not yet ingested
- Civics
- —
Market trends
- HPI YoY
- ▼ -185.48%
- Current HPI
- 308.7443
- Rent YoY
- ▲ 0.53%
- Metro
- Palm Bay-Melbourne-Titusville, FL
- State GDP YoY
- ▲ 3.28%
- F500 in state
- 36
Industry mix (Fortune 500 HQ in FL)
| Industry | F500 HQs | Revenue |
|---|---|---|
| Industrial Technology | 2 | $29B |
|
||
| Insurance | 2 | $17B |
|
||
| Retail | 1 | $60B |
|
||
| Technology Distribution | 1 | $58B |
|
||
| Homebuilding | 1 | $35B |
|
||
| Technology Manufacturing | 1 | $35B |
|
||
Price history
+169.1% since first listed13 events — show timeline
- 2026-05-07 Price Changed $174,900 SCMLS
- 2026-04-04 Relisted — SCMLS
- 2026-03-04 Contingent — SCMLS
- 2026-02-25 Relisted — SCMLS
- 2026-02-20 Contingent — SCMLS
- 2026-02-19 Relisted — SCMLS
- 2026-02-06 Contingent — SCMLS
- 2026-02-03 Listed $179,900 SCMLS
- 2017-03-23 Listing Removed — SCMLS
- 2011-04-05 Sold (Public Records) $47,500 Public Records
- 2011-03-30 Sold (MLS) $47,500 SCMLS
- 2011-01-07 Listed $54,900 SCMLS
- 2010-11-18 Listed $65,000 SCMLS
Property tax history
+1.5%/yrLatest (2025): $417 · +8.6% YoY. Source: county tax records.
Cash-flow waterfall
monthlySold comps — $/sqft
last 12 mo · ≤1 miLoading sold comps…