3931 NW 108th Dr · Coral Springs, FL
Flood risk 1/10 · Minimal
- FEMA flood zone
- X (shaded)
- Chance of flooding over 30 yrs
- 0.0%
- Est. flood insurance / yr
- $507 – $1,088
Fire risk 1/10 · Minimal
- Est. fire insurance / yr
- $947 – $1,759
Heat risk 9/10 · Severe
- Hot days now (above 107°F)
- 7 days/yr
- Hot days in 30 yrs
- 26 days/yr
Wind risk 10/10 · Severe
- Chance of severe wind over 30 yrs
- 99.0%
Air-quality risk 2/10 · Minimal
- Unhealthy air days now
- 2 days/yr
- Unhealthy air days in 30 yrs
- 2 days/yr
Risk factors via First Street. Map © Google.
Why this score? — see what drove the B grade
The composite is a weighted blend of 9 inputs, each scored 0–100. Each bar is that input's sub-score; the figure is the points it added to the 100-point composite (weight × sub-score).
- Cash flow +30.0/30.0
- 1% rule +10.0/10.0
- DSCR +10.0/10.0
- ARV discount +7.5/15.0
- Schools +4.1/10.0
- Livability +4.0/5.0
- Rent growth +2.5/5.0
- Condition / age +2.5/5.0
- Appreciation +0.0/10.0
$160,000
🖨 Deal sheet 📄 Offer letter ✓ Due diligence
Listing remarks
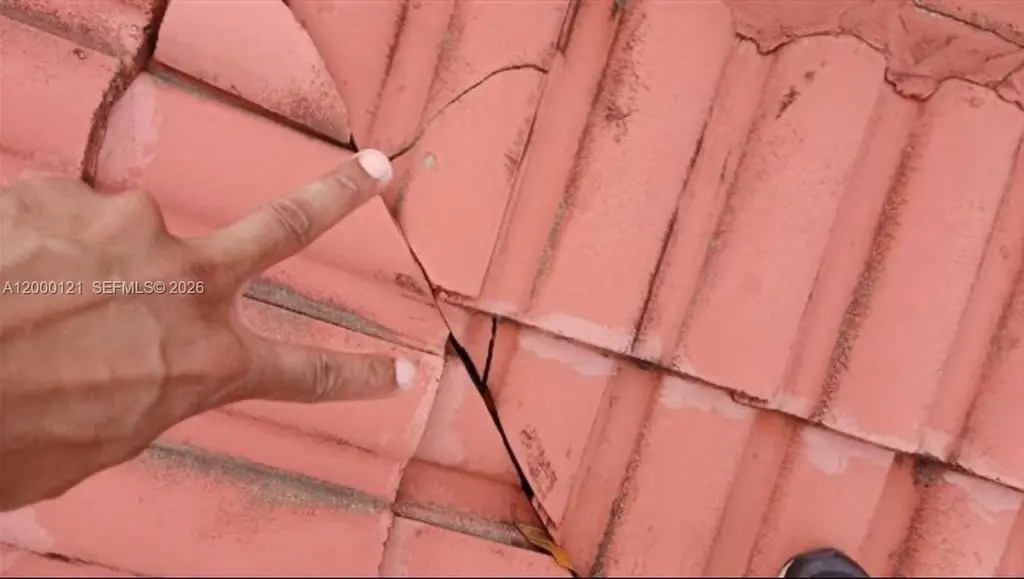
Distressed home-unapproved short sale - inspector found mold, fire damage in attic, termite damage, foundation damage, pool damage, AC ventilation damage, water damage and extensive overall repairs.
Key facts
- 0.29 acre lot
- 2 garage spots
- Pool
Neighborhood map
What this means for you Summary
Snapshot
- This is a 3-bed/2.0-bath single-family listed at $160k.
Deal economics
- At list price, monthly cash flow is $1k ($17k/yr) — positive.
- The deal already cash-flows at list — no discount required.
- Meets the 1% rule at list price ($3k rent vs $160k).
- Cap rate 17.1% vs local median 3.6% in Coral Springs — top-decile yield for the area; either an underpriced asset or a hidden risk that comps aren't pricing in. Stress-test before assuming the spread holds.
Location & tenants
- Location reads 79/100 on livability (#145 in FL, #2,163 nationally) — a middle-class / working-renter tenant base. Strengths: housing A+, health & safety A+, crime A; Watch: amenities F, cost of living F.
- Broward (suburban): math 42% / reading 53% proficiency, ranked #46 of 73 in FL (top 63%) — families likely to look elsewhere, expect single-tenant / working-renter base with shorter leases.
- Market conditions: Rents soft (-0.0%/yr); 365 active listings in the ZIP; 40 comparable units currently listed for rent nearby; rentals at typical pace (median 22d on market — plan ~3-4 weeks tenant-placement turnaround); 2,111 units permitted in Broward County in 2024 (1,265 in 5+ unit buildings).
- At $3,224/mo this rent would consume 52% of the median local household income ($74k/yr) (locally 3488% of renters already pay >50% of income on rent) — very limited rent-growth headroom before tenants either downsize or default.
Forward outlook
- Local home prices are declining (-3.0%/yr); year-one equity from $1k of loan paydown is wiped out by about $5k of value loss. Plan a longer hold.
- Broward County population projected at +34% by 2050 — long-run rental-demand tailwind backs the buy-and-hold thesis.
- At projected returns (-3.0% appreciation + 0.0% rent growth), your $45k cash investment doubles in ~4 years — after that, you're playing with house money.
Negotiation context
- Only 1 days on market — expect competitive offers; lowballing is unlikely to land.
- 10 sale attempts since 5y ago with the ask held roughly flat each time — persistent listings suggest the price (not the market) is what's stuck; bring a comps-based counter.
Risks & watch-outs
- Climate carrying-cost: severe wind risk, 99% chance of damaging wind over 30y; extreme-heat days projected 7→26/yr by 2055 (HVAC capex compounding) — expect insurance premiums to compound above CPI over the hold.
Questions for the listing agent
- Built in 1972 — when were the roof, HVAC, electrical panel, plumbing, and water heater last replaced?
- Is there a deadline driving the sale (1031 exchange, divorce, estate, relocation)? That informs how much negotiation room exists.
- Schools are A-rated — typically a magnet for longer-tenancy family renters. What's the average tenant stay here, and is there a school-zone premium baked into asking?
- What's the average days-on-market for RENTAL listings here right now (not sales)? A rising rental-DOM trend means longer vacancies and softer asking-rent achievability than the comps imply.
- What's the recent tenant-quality profile in this submarket — average credit score on applications, eviction rate, late-payment / NSF rate, and stable-employment percentage? A property-management company in the area should have these aggregated.
- How much new for-sale + rental construction is in the pipeline within 1–3 miles? Heavy new supply typically softens prices + rents 12–24 months out; constrained supply supports both.
Investment metrics
- 1% rule
- 2.01% ✓
- Cap rate
- 17.10%
- Cash-on-cash
- 38.60%
- DSCR
- 2.72
- GRM
- 4.1
CMA / ARV
- ARV (on-the-fly)
- $594,072
- Comps found
- 6
Show comp detail 6 sales within ~0.75 mi
| Address | Dist | Beds/Ba | Sqft | Sold | Price | $/sf | Match |
|---|---|---|---|---|---|---|---|
| 3700 NW 104th Ave | 0.35mi | 3/2.0 | 1,838 (+3%) | 3mo | $630,000 | $343 | 76 |
| 10930 NW 41st Dr | 0.20mi | 4/2.0 (+1) | 1,964 (+10%) | 1mo | $630,000 | $321 | 68 |
| 9921 NW 38th St | 0.71mi | 3/2.0 | 1,700 (-5%) | 3mo | $700,000 | $412 | 57 |
| 3980 NW 114th Ave | 0.55mi | 4/2.0 (+1) | 1,923 (+8%) | 3mo | $620,000 | $322 | 54 |
| 10601 NW 43rd Ct | 0.42mi | 4/2.0 (+1) | 2,050 (+15%) | 1mo | $480,000 | $234 | 50 |
| 4320 NW 113th Ter | 0.65mi | 3/2.0 | 1,616 (-9%) | 6mo | $538,000 | $333 | 49 |
Match score weights: distance 35% · size 25% · config 20% · recency 20%. Top-matched comps best support the ARV.
Projected returns pro-forma
-3.0% appreciation · 0.0% rent growth · sell at horizon
- IRR
- 31.3%
- Equity multiple
- 2.26×
- Total profit
- $56,456
- Equity at exit
- $23,857
- IRR
- 36.7%
- Equity multiple
- 3.92×
- Total profit
- $131,031
- Equity at exit
- $13,834
Cash invested: $44,800 (down + closing). Projections, not guarantees.
Landlord ↔ Tenant lean methodology
- Overall (STATE)
- 87 Strongly Landlord-Friendly
- State Florida
- 87 Strongly Landlord-Friendly · R+3
- County
- — inherits STATE
- City
- — inherits STATE
ZIP-level market 33065
- Home prices YoY
- -22.0%
- Rents YoY
- -0.0%
- Active inventory
- 365
- Price-to-rent
- 4.1×
Monthly cashflow live
- Estimated rent
- $3,224 high interval (Pro) →
- Mortgage (P&I)
- −$839
- Tax est. 1.5%
- −$200 /mo · $2,400/yr
- Insurance
- −$67
- HOA
- −$0
- Vacancy / Maint / Mgmt
- −$677
- Net cashflow
- $1,441
Break-even live
UW: 25.0% down · 7.5% · 30yr · 1.5% tax · 5.0% vac · 8.0% maint · 8.0% mgmt
Financing live
Cash to close
- Down payment
- $40,000
- Closing costs
- $4,800
- Reserves months
- —
- Total cash needed
- —
Loan-product check · same deal, 3 products live
Conventional
25% down · 7.5% · 30yr
- Down + closing
- —
- Monthly P&I
- —
- Monthly cashflow
- —
- DSCR
- —
- Eligible?
- —
Personal DTI + credit; lowest rate.
DSCR
20% down · 8.5% · 30yr
- Down + closing
- —
- Monthly P&I
- —
- Monthly cashflow
- —
- DSCR
- —
- Eligible?
- —
No personal income docs; deal must DSCR.
Hard money
10% down · 12.0% · 12mo
- Down + closing
- —
- Monthly P&I
- —
- Monthly cashflow
- —
- DSCR
- —
- Eligible?
- —
Short-term bridge; refi at stabilization.
Rent comps 40 comps
| Address | Beds | Baths | Sqft | Rent | $/sqft | DOM | Units | Dist |
|---|---|---|---|---|---|---|---|---|
| 10520 NW 41st St Unit 10520 Coral Springs, FL | 2.0 | 2.0 | 1233 | $2,400 | $1.95 | 21d | 1 | 0.25mi |
| 10559 La Placida Dr Coral Springs, FL | 3.0 | 2.0 | 1450 | $2,800 | $1.93 | 17d | 1 | 0.27mi |
| 10559 La Placida Dr Coral Springs, FL | 3.0 | 2.0 | 1450 | $2,800 | $1.93 | 24d | 1 | 0.27mi |
| 11055 NW 37th St Coral Springs, FL | 4.0 | 3.0 | 2012 | $4,200 | $2.09 | 24d | 1 | 0.28mi |
| 4100 NW 110th Ave Unit S Coral Springs, FL | 3.0 | 2.0 | 1800 | $3,450 | $1.92 | 8d | 1 | 0.29mi |
| 10777 W Sample Rd #312 Coral Springs, FL | 2.0 | 2.0 | 1350 | $2,200 | $1.63 | 24d | 1 | 0.38mi |
| 10777 W Sample Rd Coral Springs, FL | 2.0 | 2.0 | 1350 | $2,150 | $1.59 | 21d | 2 | 0.38mi |
| 3400 Coral Springs Dr Coral Springs, FL | 2.0–3.0 | 2.0 | 1852 | $3,300 | $1.78 | 19d | 4 | 0.40mi |
| 4305 Coral Springs Dr Unit 2H Coral Springs, FL | 3.0 | 3.5 | 2020 | $3,100 | $1.53 | 22d | 1 | 0.41mi |
| 10251 NW 39th Ct Coral Springs, FL | 4.0 | 2.0 | 2039 | $4,750 | $2.33 | 24d | 1 | 0.43mi |
| 3731 NW 114th Ave Coral Springs, FL | 3.0 | 2.0 | 1609 | $3,380 | $2.10 | 17d | 1 | 0.51mi |
| 3731 NW 114th Ave Coral Springs, FL | 3.0 | 2.0 | 1903 | $3,545 | $1.86 | 8d | 1 | 0.51mi |
| 10700 W Sample Rd Coral Springs, FL | 1.0–3.0 | 1.0–3.0 | 1141 | $2,972 | $2.60 | 2d | 5 | 0.52mi |
| 11235 NW 43rd Pl Coral Springs, FL | 4.0 | 2.0 | 1826 | $4,075 | $2.23 | 2d | 1 | 0.54mi |
| 10261 NW 35th St #10 Coral Springs, FL | 3.0 | 2.0 | 1238 | $2,450 | $1.98 | 2d | 1 | 0.55mi |
| 11461 NW 39th St Coral Springs, FL | 4.0 | 3.0 | 1999 | $4,700 | $2.35 | 24d | 1 | 0.56mi |
| 10633 NW 32nd Ct Coral Springs, FL | 3.0 | 2.0 | 2079 | $3,500 | $1.68 | 11d | 1 | 0.57mi |
| 11461 NW 38th St Coral Springs, FL | 3.0 | 2.0 | 1800 | $2,800 | $1.56 | 24d | 1 | 0.57mi |
| 11282 NW 44th St Coral Springs, FL | 4.0 | 2.0 | 1874 | $4,500 | $2.40 | 24d | 1 | 0.58mi |
| 11282 NW 44th St Coral Springs, FL | 4.0 | 2.0 | 1874 | $4,500 | $2.40 | 21d | 1 | 0.58mi |
| 3750 NW 115th Ave Unit 6 Coral Springs, FL | 3.0 | 2.5 | 1440 | $2,100 | $1.46 | 24d | 1 | 0.65mi |
| 11511 NW 36th St Coral Springs, FL | 3.0 | 2.0 | 1510 | $2,800 | $1.85 | 24d | 1 | 0.66mi |
| 4260 NW 114th Ter #60 Coral Springs, FL | 3.0 | 2.5 | 1600 | $2,990 | $1.87 | 5d | 1 | 0.66mi |
| 11221 NW 46th Dr Coral Springs, FL | 4.0 | 2.5 | 2103 | $3,650 | $1.74 | 3d | 1 | 0.72mi |
| 11640 NW 39th St #8 Coral Springs, FL | 3.0 | 2.5 | 1300 | $2,500 | $1.92 | 24d | 1 | 0.72mi |
| 11135 NW 46th Dr Coral Springs, FL | 3.0 | 2.5 | 1961 | $3,250 | $1.66 | 22d | 1 | 0.73mi |
| 11578 NW 39th Pl Coral Springs, FL | 4.0 | 3.0 | 1880 | $4,200 | $2.23 | 24d | 1 | 0.74mi |
| 3050 Coral Springs Dr Unit 3 Coral Springs, FL | 3.0 | 2.0 | 1400 | $2,400 | $1.71 | 24d | 1 | 0.75mi |
| 4315 NW 115th Ave Coral Springs, FL | 3.0 | 2.5 | 1650 | $3,200 | $1.94 | 11d | 1 | 0.75mi |
| 3050 Coral Springs Dr Unit 1 Coral Springs, FL | 2.0 | 2.0 | 1500 | $2,100 | $1.40 | 24d | 1 | 0.75mi |
| 11543 NW 44th St #2 Coral Springs, FL | 3.0 | 2.5 | 1742 | $2,590 | $1.49 | 4d | 1 | 0.85mi |
| 10890 W Sample Rd Coral Springs, FL | 1.0–3.0 | 1.0–2.0 | 1102 | $3,036 | $2.75 | 1d | 19 | 0.88mi |
| 10425 NW 48th Mnr Coral Springs, FL | 4.0 | 2.0 | 2285 | $5,400 | $2.36 | 24d | 1 | 0.88mi |
| 3165 NW 116th Ave Unit 3165 Coral Springs, FL | 3.0 | 2.0 | 1696 | $3,500 | $2.06 | 24d | 1 | 0.89mi |
| 3134 Coral Ridge Dr #3136 Coral Springs, FL | 3.0 | 2.5 | 1250 | $3,000 | $2.40 | 11d | 1 | 1.01mi |
| 2701 NW 107th Ave Coral Springs, FL | 3.0 | 2.5 | 1956 | $5,000 | $2.56 | 24d | 1 | 1.01mi |
| 2701 NW 107th Ave Coral Springs, FL | 3.0 | 2.5 | 1956 | $5,000 | $2.56 | 5d | 1 | 1.01mi |
| 2700 Coral Springs Dr Coral Springs, FL | 2.0 | 2.0 | 1204 | $2,075 | $1.72 | 19d | 2 | 1.08mi |
| 3105 NW 118th Dr Unit 3113 Coral Springs, FL | 3.0 | 2.5 | 2115 | $2,894 | $1.37 | 24d | 1 | 1.08mi |
| 2580 Coral Springs Dr #2580 Coral Springs, FL | 3.0 | 2.5 | 1478 | $2,590 | $1.75 | 22d | 1 | 1.13mi |
Listing history 36 events
-
2026-04-14status Pending
-
2026-04-07$160,000 Active
-
2025-08-01historical
-
2025-07-31status Active
-
2025-06-10historical Active Under Contract
-
2025-05-27status Active
-
2025-03-31status Pending
-
2025-03-31historical Active Under Contract
-
2025-03-11price $539,997
-
2025-03-04status Active
-
2025-02-27historical Active Under Contract
-
2025-02-20$580,000 Active
-
2024-11-25historical
-
2024-11-14historical Active Under Contract
-
2024-10-07status Active
-
2024-10-07price $587,000
-
2024-10-01historical Active Under Contract
-
2024-09-04price $689,000
-
2024-05-25$710,000 Active
-
2021-12-15soldstatus $545,000
-
2021-12-13soldstatus $545,000 Closed
-
2021-12-13soldstatus $545,000
-
2021-10-25historical Active Under Contract
-
2021-09-30price $550,000
-
2021-09-13price $560,000
-
2021-09-02status Active
-
2021-08-30historical Active Under Contract
-
2021-08-20price $565,000
-
2021-08-17price $574,991
-
2021-07-22$575,000 Active
-
2021-07-22$550,000
-
2005-12-05soldstatus $407,000
-
2001-09-06soldstatus $152,900
-
1994-04-29soldstatus $123,000
-
1989-03-22soldstatus $122,500
-
1986-08-20soldstatus $110,000
ⓘ Source: listings_history table (triggers on properties + properties_extension) + one-shot
backfill from property_details.listing_events for pre-trigger history.
Climate risk First Street
- Flood 1/10 Low FEMA zone X (shaded) · 0% chance over 30 yrs
- Wildfire 1/10 Low
- Heat 9/10 Extreme 7 d/yr ≥107°F today · 26 d/yr by 30 yrs out
- Wind 10/10 Extreme 99% chance of damaging wind over 30 yrs
- Air quality 2/10 Low 2 unhealthy d/yr today · 2 by 30 yrs out
Nearby sold comps map
Loading sold comps map…
Walkable amenities ~0.75 mi
Loading nearby amenities…
Taxation est. · year 1
- Rental income
- $38,685
- − Mortgage interest
- −$8,962
- − Property taxes
- −$2,400
- − Insurance
- −$800
- − Repairs & maintenance
- −$3,095
- − Management
- −$3,095
- − Depreciation
- −$4,655
- Taxable income
- $15,679
- Est. tax owed @ 24.0%
- −$3,763
- After-tax cash flow
- $13,530/yr
For passive investors: Depreciation is non-cash, so a rental often shows a tax loss while cash-flowing — sheltering income. Rental losses are passive: they offset passive income freely, and up to $25,000/yr can offset ordinary (W-2) income if you actively participate and your MAGI is under $100k (phasing out to $0 by $150k); unused losses carry forward. On sale, claimed depreciation is recaptured at up to 25%, and gains may owe capital-gains tax (a 1031 exchange can defer both). Figures are a year-1 estimate at your 24.0% rate — not tax advice; consult a CPA.
Schools (NCES district)
- District
- Broward
- NCES district ID
- 1200180
- Math proficiency
- 42% ▼ -18.00%
- Reading proficiency
- 53% ▼ -5.00%
- Median HH income
- $52,139
- Composite
- 40.88/100
- National rank
- #3621
- State rank
- #46 of 73 in FL
Livability — Coral Springs
- Score
- 79/100
- State rank
- #145
- US rank
- #2163
Category grades
Schools grade is shown separately in the Schools card above.
Census & demographics
- Census place
- Coral Springs, FL
- County
- Broward County · 1,963,430 people
- City population
- 101,171
- Metro
- Miami-Fort Lauderdale-Pompano Beach, FL
- Population (ZIP)
- 58,916
- Household income
- $74,226
- Rent vs Own
- Severe rent burden
- 3488.0
Population outlook (Broward County) Hauer SSP2
- Today (2025)
- 2,207,033 people
- By 2030
- 2,360,704 · +7.0%
- By 2040
- 2,661,208 · +20.6%
- By 2050
- 2,946,698 · +33.5%
- By 2075
- 3,602,273 · +63.2%
- By 2100
- 3,970,984 · +79.9%
Race, ethnicity, and origin ACS 2023
- Neighborhood character
- Highly diverse neighborhood (Simpson 0.72)
- Race & ethnicity
- Hispanic / Latino 33% White 30% Black 28% Two or more races 21% Asian 3%
- Hispanic origin (detail)
- Mexican 4% Puerto Rican 5% Cuban 2% Dominican 3%
- Common ancestry
- Hispanic 9% Romanian 2% Estonian 1%
- Foreign-born
- 35% · Canada, Jamaica, China
- Languages at home
- 61% English-only · Spanish 26% French/Haitian/Cajun 8% Other Indo-European 3%
Political lean MEDSL · Broward
- 2024 margin
- D (+17.0) · D 58.0% · R 41.0%
- 2008→2024 swing
- -17.8pp toward R · 2008: 34.7pp · 2024: 17.0pp
- All cycles
- 2024: D+17.0 2020: D+29.8 2016: D+35.0 2012: D+34.9 2008: D+34.7
Not yet ingested
- Civics
- —
Market trends
- HPI YoY
- ▼ -113.43%
- Current HPI
- 402.3476
- Rent YoY
- ▬ -0.03%
- Metro
- Miami-Fort Lauderdale-Pompano Beach, FL
- State GDP YoY
- ▲ 3.28%
- F500 in state
- 36
Industry mix (Fortune 500 HQ in FL)
| Industry | F500 HQs | Revenue |
|---|---|---|
| Industrial Technology | 2 | $29B |
|
||
| Insurance | 2 | $17B |
|
||
| Retail | 1 | $60B |
|
||
| Technology Distribution | 1 | $58B |
|
||
| Homebuilding | 1 | $35B |
|
||
| Technology Manufacturing | 1 | $35B |
|
||
Price history
+45.5% since first listed36 events — show timeline
- 2026-04-14 Pending — MARMLS
- 2026-04-07 Listed $160,000 MARMLS
- 2025-08-01 Listing Removed — MARMLS
- 2025-07-31 Relisted — MARMLS
- 2025-06-10 Contingent — MARMLS
- 2025-05-27 Relisted — MARMLS
- 2025-03-31 Pending — MARMLS
- 2025-03-31 Contingent — MARMLS
- 2025-03-11 Price Changed $539,997 MARMLS
- 2025-03-04 Relisted — MARMLS
- 2025-02-27 Contingent — MARMLS
- 2025-02-20 Listed $580,000 MARMLS
- 2024-11-25 Listing Removed — MARMLS
- 2024-11-14 Contingent — MARMLS
- 2024-10-07 Relisted — MARMLS
- 2024-10-07 Price Changed $587,000 MARMLS
- 2024-10-01 Contingent — MARMLS
- 2024-09-04 Price Changed $689,000 MARMLS
- 2024-05-25 Listed $710,000 MARMLS
- 2021-12-15 Sold (Public Records) $545,000 Public Records
- 2021-12-13 Sold (MLS) $545,000 HSBOR
- 2021-12-13 Sold (MLS) $545,000 Beaches MLS
- 2021-10-25 Contingent — Beaches MLS
- 2021-09-30 Price Changed $550,000 Beaches MLS
- 2021-09-13 Price Changed $560,000 Beaches MLS
- 2021-09-02 Relisted — Beaches MLS
- 2021-08-30 Contingent — Beaches MLS
- 2021-08-20 Price Changed $565,000 Beaches MLS
- 2021-08-17 Price Changed $574,991 Beaches MLS
- 2021-07-22 Listed $550,000 HSBOR
- 2021-07-22 Listed $575,000 Beaches MLS
- 2005-12-05 Sold (Public Records) $407,000 Public Records
- 2001-09-06 Sold (Public Records) $152,900 Public Records
- 1994-04-29 Sold (Public Records) $123,000 Public Records
- 1989-03-22 Sold (Public Records) $122,500 Public Records
- 1986-08-20 Sold (Public Records) $110,000 Public Records
Property tax history
+10.0%/yrLatest (2025): $14,546 · +13.7% YoY. Source: county tax records.
Cash-flow waterfall
monthlySold comps — $/sqft
last 12 mo · ≤1 miLoading sold comps…