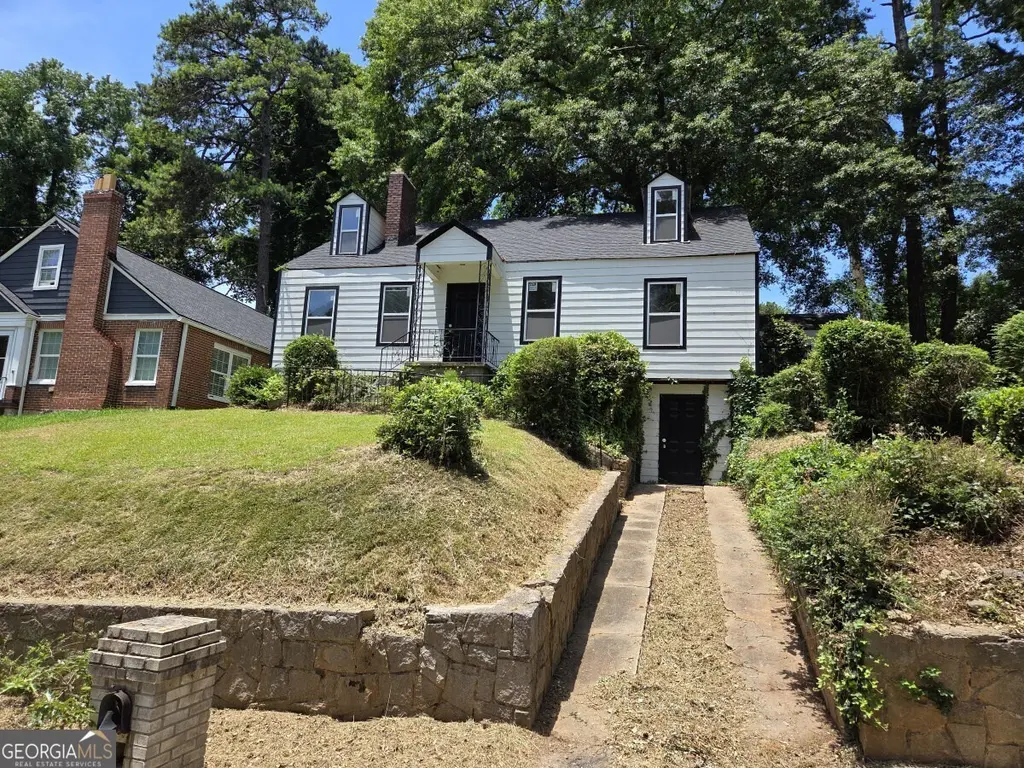
959 Gaston St SW · Atlanta, GA
Flood risk 1/10 · Minimal
- FEMA flood zone
- X (unshaded)
- Chance of flooding over 30 yrs
- 0.0%
- Est. flood insurance / yr
- $473 – $860
Fire risk 1/10 · Minimal
- Est. fire insurance / yr
- $963 – $1,789
Heat risk 5/10 · Moderate
- Hot days now (above 104°F)
- 6 days/yr
- Hot days in 30 yrs
- 16 days/yr
Wind risk 6/10 · Moderate
- Chance of severe wind over 30 yrs
- 27.0%
Air-quality risk 4/10 · Minor
- Unhealthy air days now
- 4 days/yr
- Unhealthy air days in 30 yrs
- 6 days/yr
Risk factors via First Street. Map © Google.
Why this score? — see what drove the C- grade
The composite is a weighted blend of 9 inputs, each scored 0–100. Each bar is that input's sub-score; the figure is the points it added to the 100-point composite (weight × sub-score).
- Cash flow +21.0/30.0
- ARV discount +7.5/15.0
- DSCR +6.7/10.0
- 1% rule +5.9/10.0
- Livability +4.2/5.0
- Rent growth +3.2/5.0
- Schools +2.7/10.0
- Condition / age +2.5/5.0
- Appreciation +0.0/10.0
$225,000
🖨 Deal sheet 📄 Offer letter ✓ Due diligence
Listing remarks MLS
2 properties for the price of 1! Fantastic opportunity to own a house in booming West End, PLUS the adjacent lot! The home is a clean slate to renovate to your own taste -- an oversized bungalow with a huge kitchen addition for a breakfast area, mud room, and den. The primary suite on the main level is spacious and feeds directly into the sunroom. The main level has hardwoods and a fireplace, and the partially finished attic has a huge 3rd bedroom and 2nd bathroom. The basement area has drive-up access for storage space. The adjacent lot has a driveway leading up to the kitchen level for easy access and extra off-street parking. Great potential to either build an ADU here or another home! Conveniently located near the BeltLine, popular restaurants, local shops, interstate highways, and Atlanta airport. Sale includes BOTH the house at 959 Gaston St (Parcel: 14-0138-0001-030-2) and the adjacent lot at 955 Gaston St (Parcel: 14-0138-0001-029-4). Survey available for more details.
Key facts
- Driveway leading up
- 6,141 sq ft lot
- Built 1945
Tags
Property features AI
Finance
- Other: Waterfrontage length: none; Directions: See GPS
Exterior
- Parking: Driveway and parking pad; Open parking available
- Utilities: Public water; Public sewer; Electric service listed as Other; Utilities listed as Other
- Home design: One-and-a-half story layout; Property condition: fixer; Entry/sun room present; Facing/direction details not provided; Ownership listed as Other
- Construction: Fiber cement exterior; Shingle roof; Brick/mortar foundation; Body type listed as Other
- Exterior features: Exterior features listed as Other; Paved road frontage
Interior
- Kitchen: Kitchen features listed as Other; Appliances listed as Other
- Bedrooms: Two main-level bedrooms; One upper-level bedroom; Bedroom features listed as Other
- Flooring: Hardwood flooring; Tile flooring
- Bathrooms: Two full bathrooms; One main-level bathroom and one upper-level full bathroom; Master bath features listed as Other
- Heating & cooling: Heating listed as Other; Cooling listed as Other
- Interior features: Fireplace in the living room; Partial, unfinished basement with both interior and exterior entry and walk-out access; No common walls
- Laundry & utility: Laundry features listed as Other
Neighborhood map
What this means for you Summary
Snapshot
- This is a 3-bed/1.0-bath single-family listed at $225k.
Deal economics
- At list price, monthly cash flow is $317 ($4k/yr) — positive.
- The deal already cash-flows at list — no discount required.
- Meets the 1% rule at list price ($2k rent vs $225k).
- Cap rate 8.0% vs local median 3.1% in Atlanta — top-decile yield for the area; either an underpriced asset or a hidden risk that comps aren't pricing in. Stress-test before assuming the spread holds.
Location & tenants
- Location reads 83/100 on livability (#6 in GA, #919 nationally) — a professional / high-income tenant draw. Strengths: amenities A+, commute A+, housing A+; Watch: cost of living C-.
- Atlanta Public Schools (urban): math 28% / reading 35% proficiency, ranked #80 of 174 in GA (top 46%) — families likely to look elsewhere, expect single-tenant / working-renter base with shorter leases; 71% free/reduced lunch — lower-income household profile, screen leases tightly.
- Zoned schools: Tuskegee Airman Global Academy (math 2% / reading 2%, grade F, #1,204 of 1,228 statewide, top 100%, 520 students, 100% FRL); Herman J. Russell West End Academy (math 12% / reading 12%, grade F, #417 of 470 statewide, top 90%, 399 students, 100% FRL); Booker T. Washington High School (math 24% / reading 24%, grade F, #184 of 424 statewide, top 48%, 831 students, 100% FRL) — zoned schools average 100% FRL vs 71% district-wide (29 pts higher); higher-poverty schools than district average — tighter screening recommended.
- Zoned-school proficiency averages 13% at this address vs 32% district-wide (-18 pts) — the specific schools serving this property underperform the Atlanta Public Schools average; the district grade overstates school quality for this exact location.
- Market conditions: Rents rising (+2.8%/yr); 452 active listings in the ZIP; 40 comparable units currently listed for rent nearby; rentals at typical pace (median 25d on market — plan ~3-4 weeks tenant-placement turnaround); 11,565 units permitted in Fulton County in 2024 (8,159 in 5+ unit buildings).
- At $2,454/mo this rent would consume 56% of the median local household income ($53k/yr) (locally 1676% of renters already pay >50% of income on rent) — very limited rent-growth headroom before tenants either downsize or default.
Forward outlook
- Local home prices are declining (-3.0%/yr); year-one equity from $2k of loan paydown is wiped out by about $7k of value loss. Plan a longer hold.
- Fulton County population projected at +38% by 2050 — long-run rental-demand tailwind backs the buy-and-hold thesis.
Negotiation context
- Only 2 days on market — expect competitive offers; lowballing is unlikely to land.
- 2 sale attempts with the ask held roughly flat each time — persistent listings suggest the price (not the market) is what's stuck; bring a comps-based counter.
Risks & watch-outs
- Watch-outs: built in 1945 — expect roof / HVAC / electrical / plumbing capex.
- Climate carrying-cost: major wind risk, 27% chance of damaging wind over 30y; extreme-heat days projected 6→16/yr by 2055 (HVAC capex compounding) — expect insurance premiums to compound above CPI over the hold.
Questions for the listing agent
- Built in 1945 — when were the roof, HVAC, electrical panel, plumbing, and water heater last replaced?
- Is there a deadline driving the sale (1031 exchange, divorce, estate, relocation)? That informs how much negotiation room exists.
- What's the average days-on-market for RENTAL listings here right now (not sales)? A rising rental-DOM trend means longer vacancies and softer asking-rent achievability than the comps imply.
- What's the recent tenant-quality profile in this submarket — average credit score on applications, eviction rate, late-payment / NSF rate, and stable-employment percentage? A property-management company in the area should have these aggregated.
- How much new for-sale + rental construction is in the pipeline within 1–3 miles? Heavy new supply typically softens prices + rents 12–24 months out; constrained supply supports both.
Investment metrics
- 1% rule
- 1.09% ✓
- Cap rate
- 7.98%
- Cash-on-cash
- 6.03%
- DSCR
- 1.27
- GRM
- 7.6
CMA / ARV
- ARV (on-the-fly)
- $464,835
- Comps found
- 12
Show comp detail 12 sales within ~0.75 mi
| Address | Dist | Beds/Ba | Sqft | Sold | Price | $/sf | Match |
|---|---|---|---|---|---|---|---|
| 1059 Orlando Pl SW | 0.24mi | 4/3.5 (+1) | 1,859 (-7%) | 2mo | $365,000 | $196 | 61 |
| 1707 Richland Rd SW | 0.44mi | 4/3.5 (+1) | 1,998 (+0%) | 4mo | $419,000 | $210 | 61 |
| 1684 Kenmore SW | 0.42mi | 4/3.0 (+1) | 1,905 (-4%) | 1mo | $380,000 | $199 | 60 |
| 1255 Ladd St SW | 0.46mi | 3/2.0 | 1,800 (-10%) | 1mo | $420,000 | $233 | 57 |
| 988 Cascade Rd SW | 0.33mi | 3/2.5 | 1,727 (-13%) | 2mo | $500,000 | $290 | 55 |
| 1530 S Gordon St SW | 0.73mi | 3/2.5 | 2,088 (+5%) | 1mo | $520,000 | $249 | 51 |
| 1227 Epworth St SW | 0.61mi | 4/2.0 (+1) | 1,848 (-7%) | 2mo | $293,000 | $159 | 48 |
| 1340 Wichita Dr SW | 0.73mi | 3/2.0 | 1,800 (-10%) | 1mo | $340,000 | $189 | 45 |
| 1666 Rogers Ave SW | 0.64mi | 3/2.0 | 1,750 (-12%) | 2mo | $460,000 | $263 | 44 |
| 1120 Cordova St SW | 0.69mi | 4/2.0 (+1) | 1,806 (-10%) | 0mo | $155,000 | $86 | 43 |
| 1156 Oakland Dr SW | 0.68mi | 4/2.5 (+1) | 2,200 (+10%) | 2mo | $539,900 | $245 | 38 |
| 1182 Merrill Ave | 0.59mi | 4/3.0 (+1) | 1,714 (-14%) | 1mo | $410,000 | $239 | 35 |
Match score weights: distance 35% · size 25% · config 20% · recency 20%. Top-matched comps best support the ARV.
Projected returns pro-forma
-3.0% appreciation · 2.77% rent growth · sell at horizon
- IRR
- -7.2%
- Equity multiple
- 0.73×
- Total profit
- $-16,782
- Equity at exit
- $33,548
- IRR
- 2.1%
- Equity multiple
- 1.15×
- Total profit
- $9,356
- Equity at exit
- $19,454
Cash invested: $63,000 (down + closing). Projections, not guarantees.
Landlord ↔ Tenant lean methodology
- Overall (STATE)
- 90 Strongly Landlord-Friendly
- State Georgia
- 90 Strongly Landlord-Friendly · R+3
- County
- — inherits STATE
- City
- — inherits STATE
ZIP-level market 30310
- Home prices YoY
- -32.8%
- Rents YoY
- 2.8%
- Active inventory
- 452
- Price-to-rent
- 7.6×
Monthly cashflow live
- Estimated rent
- $2,454 high interval (Pro) →
- Mortgage (P&I)
- −$1,180
- Tax from tax record
- −$348 /mo · $4,179/yr
- Insurance
- −$94
- HOA
- −$0
- Vacancy / Maint / Mgmt
- −$515
- Net cashflow
- $317
Break-even live
UW: 25.0% down · 7.5% · 30yr · 1.5% tax · 5.0% vac · 8.0% maint · 8.0% mgmt
Financing live
Cash to close
- Down payment
- $56,250
- Closing costs
- $6,750
- Reserves months
- —
- Total cash needed
- —
Loan-product check · same deal, 3 products live
Conventional
25% down · 7.5% · 30yr
- Down + closing
- —
- Monthly P&I
- —
- Monthly cashflow
- —
- DSCR
- —
- Eligible?
- —
Personal DTI + credit; lowest rate.
DSCR
20% down · 8.5% · 30yr
- Down + closing
- —
- Monthly P&I
- —
- Monthly cashflow
- —
- DSCR
- —
- Eligible?
- —
No personal income docs; deal must DSCR.
Hard money
10% down · 12.0% · 12mo
- Down + closing
- —
- Monthly P&I
- —
- Monthly cashflow
- —
- DSCR
- —
- Eligible?
- —
Short-term bridge; refi at stabilization.
Rent comps 40 comps
| Address | Beds | Baths | Sqft | Rent | $/sqft | DOM | Units | Dist |
|---|---|---|---|---|---|---|---|---|
| 966 Gaston St SW Atlanta, GA | 3.0 | 2.5 | 1331 | $2,250 | $1.69 | 24d | 1 | 0.05mi |
| 1550 Mayflower Ave SW Atlanta, GA | 4.0 | 2.5 | 1396 | $6,500 | $4.66 | 20d | 1 | 0.15mi |
| 1435 Richland Rd SW Atlanta, GA | 3.0 | 2.0 | 1637 | $2,875 | $1.76 | 15d | 1 | 0.20mi |
| 1401 Plaza Ave SW Atlanta, GA | 4.0 | 2.5 | 2600 | $2,495 | $0.96 | 24d | 1 | 0.20mi |
| 1409 Bridges Ave SW Atlanta, GA | 4.0 | 3.5 | 1750 | $6,500 | $3.71 | 22d | 1 | 0.22mi |
| 1448 Westboro Dr SW Atlanta, GA | 3.0 | 2.0 | 1437 | $2,300 | $1.60 | 7d | 1 | 0.23mi |
| 1474 Beecher St SW Atlanta, GA | 3.0 | 2.0 | 1332 | $3,200 | $2.40 | 24d | 1 | 0.29mi |
| 1473 Beecher St SW Atlanta, GA | 3.0 | 2.0 | 1547 | $2,600 | $1.68 | 24d | 1 | 0.32mi |
| 1338 Montreat Ave SW Atlanta, GA | 4.0 | 2.0 | 1750 | $2,260 | $1.29 | 24d | 1 | 0.33mi |
| 1435 Lanvale Dr SW Atlanta, GA | 3.0 | 1.0 | 1547 | $1,800 | $1.16 | 7d | 1 | 0.33mi |
| 1316 Plaza Ave SW Atlanta, GA | 3.0 | 2.0 | 1692 | $1,825 | $1.08 | 7d | 1 | 0.37mi |
| 1389 Lanvale Dr SW Atlanta, GA | 3.0 | 2.0 | 1430 | $2,500 | $1.75 | 7d | 1 | 0.38mi |
| 1449 Lynford Dr SW Atlanta, GA | 3.0 | 1.0 | 1242 | $1,895 | $1.53 | 18d | 1 | 0.38mi |
| 1449 Lynford Dr SW Atlanta, GA | 3.0 | 1.0 | 1242 | $1,895 | $1.53 | 24d | 1 | 0.38mi |
| 1578 Linda Way SW Atlanta, GA | 3.0 | 2.0 | 1343 | $2,030 | $1.51 | 14d | 1 | 0.38mi |
| 1749 S Alvarado Ter SW Atlanta, GA | 4.0 | 2.0 | 2400 | $2,541 | $1.06 | 7d | 1 | 0.49mi |
| 702 Cascade Ave SW Atlanta, GA | 3.0 | 4.0 | 2220 | $2,850 | $1.28 | 24d | 1 | 0.50mi |
| 1530 Rogers Ave SW Atlanta, GA | 4.0 | 3.0 | 2184 | $3,300 | $1.51 | 3d | 1 | 0.55mi |
| 1255 Westmont Rd SW Atlanta, GA | 3.0 | 2.0 | 1500 | $1,695 | $1.13 | 24d | 1 | 0.56mi |
| 1425 Oglethorpe Ave SW Atlanta, GA | 3.0 | 2.0 | 1540 | $2,950 | $1.92 | 5d | 1 | 0.57mi |
| 1735 Alvarado Ter SW Atlanta, GA | 3.0 | 2.0 | 1235 | $1,595 | $1.29 | 22d | 1 | 0.58mi |
| 1501 Rogers Ave SW Atlanta, GA | 3.0 | 1.0 | 1980 | $2,500 | $1.26 | 24d | 1 | 0.58mi |
| 1262 Kenilworth Dr SW Atlanta, GA | 4.0 | 2.0 | 1400 | $2,400 | $1.71 | 24d | 1 | 0.60mi |
| 1157 Indale Pl SW Atlanta, GA | 3.0 | 2.0 | 1568 | $2,100 | $1.34 | 22d | 1 | 0.61mi |
| 1262 Lorenzo Dr SW Atlanta, GA | 4.0 | 2.0 | 1292 | $2,100 | $1.63 | 24d | 1 | 0.64mi |
| 1515 Westwood Ave SW Atlanta, GA | 3.0 | 2.5 | 2278 | $6,000 | $2.63 | 22d | 1 | 0.66mi |
| 1313 Aniwaka Ave SW Atlanta, GA | 3.0 | 2.0 | 1530 | $2,145 | $1.40 | 2d | 1 | 0.69mi |
| 1307 Lorenzo Dr SW Unit A Atlanta, GA | 3.0 | 2.0 | 1300 | $1,795 | $1.38 | 24d | 1 | 0.70mi |
| 1346 Lorenzo Dr SW Atlanta, GA | 3.0 | 2.0 | 1486 | $5,000 | $3.36 | 24d | 1 | 0.79mi |
| 1420 Ralph David Abernathy Blvd SW Atlanta, GA | 3.0 | 2.0 | 1306 | $2,400 | $1.84 | 24d | 1 | 0.79mi |
| 684 Grady Pl SW Atlanta, GA | 4.0 | 2.5 | 1806 | $2,550 | $1.41 | 13d | 1 | 0.80mi |
| 1408 Lockwood Dr SW Atlanta, GA | 3.0 | 2.0 | 1300 | $1,950 | $1.50 | 24d | 1 | 0.85mi |
| 505 W Ontario Ave SW Atlanta, GA | 3.0 | 2.0 | 1587 | $2,800 | $1.76 | 20d | 1 | 0.86mi |
| 1619 Stokes Ave SW Atlanta, GA | 3.0 | 2.0 | 1332 | $2,400 | $1.80 | 3d | 1 | 0.87mi |
| 660 Queen St SW Unit B Atlanta, GA | 3.0 | 3.0 | 1840 | $3,250 | $1.77 | 24d | 1 | 0.88mi |
| 660 Queen St SW Unit A Atlanta, GA | 3.0 | 2.0 | 1840 | $2,500 | $1.36 | 24d | 1 | 0.88mi |
| 1265 Oak St SW Atlanta, GA | 4.0 | 3.0 | 1821 | $3,300 | $1.81 | 24d | 1 | 0.91mi |
| 1951 Handley Ave SW Atlanta, GA | 3.0 | 3.0 | 1589 | $3,200 | $2.01 | 24d | 1 | 0.93mi |
| 1017 Sparks St SW Atlanta, GA | 4.0 | 2.5 | 1950 | $2,475 | $1.27 | 24d | 1 | 0.93mi |
| 1255 Campbellton Rd SW Atlanta, GA | 3.0 | 2.0 | 1305 | $2,095 | $1.61 | 24d | 1 | 0.94mi |
Listing history 3 events
-
2026-06-18days on market $225,000 Active 2 DOM
-
2026-06-17remarks 699-char remark
-
2026-06-17$225,000 Active 1 DOM
ⓘ Source: listings_history table (triggers on properties + properties_extension) + one-shot
backfill from property_details.listing_events for pre-trigger history.
Tax reassessment forecast GA · Resets to sale price
- Current annual tax
- $4,179 · $348/mo
- Projected year-2 tax
- $4,179 · $348/mo
- Expected delta
- $0/yr ($0/mo · 0.0%)
ⓘ Screening estimate from a state-policy table — verify with the county assessor before closing.
Climate risk First Street
- Flood 1/10 Low FEMA zone X (unshaded) · 0% chance over 30 yrs
- Wildfire 1/10 Low
- Heat 5/10 Major 6 d/yr ≥104°F today · 16 d/yr by 30 yrs out
- Wind 6/10 Major 27% chance of damaging wind over 30 yrs
- Air quality 4/10 Moderate 4 unhealthy d/yr today · 6 by 30 yrs out
Nearby sold comps map
Loading sold comps map…
Walkable amenities ~0.75 mi
Loading nearby amenities…
Taxation est. · year 1
- Rental income
- $29,447
- − Mortgage interest
- −$12,603
- − Property taxes
- −$4,179
- − Insurance
- −$1,125
- − Repairs & maintenance
- −$2,356
- − Management
- −$2,356
- − Depreciation
- −$6,545
- Taxable income
- $282
- Est. tax owed @ 24.0%
- −$68
- After-tax cash flow
- $3,732/yr
For passive investors: Depreciation is non-cash, so a rental often shows a tax loss while cash-flowing — sheltering income. Rental losses are passive: they offset passive income freely, and up to $25,000/yr can offset ordinary (W-2) income if you actively participate and your MAGI is under $100k (phasing out to $0 by $150k); unused losses carry forward. On sale, claimed depreciation is recaptured at up to 25%, and gains may owe capital-gains tax (a 1031 exchange can defer both). Figures are a year-1 estimate at your 24.0% rate — not tax advice; consult a CPA.
Schools (NCES district)
- District
- Atlanta Public Schools
- NCES district ID
- 1300120
- Math proficiency
- 28% ▼ -6.00%
- Reading proficiency
- 35% ▼ -2.00%
- Median HH income
- $48,306
- Composite
- 27.27/100
- National rank
- #7006
- State rank
- #80 of 174 in GA
Livability — Atlanta
- Score
- 83/100
- State rank
- #6
- US rank
- #919
Category grades
Schools grade is shown separately in the Schools card above.
Census & demographics
- Census place
- Atlanta, GA
- County
- Fulton County · 1,094,430 people
- City population
- 629,525
- Metro
- Atlanta-Sandy Springs-Alpharetta, GA
- Population (ZIP)
- 27,186
- Household income
- $53,037
- Rent vs Own
- Severe rent burden
- 1676.0
Population outlook (Fulton County) Hauer SSP2
- Today (2025)
- 1,203,707 people
- By 2030
- 1,299,706 · +8.0%
- By 2040
- 1,488,256 · +23.6%
- By 2050
- 1,664,580 · +38.3%
- By 2075
- 2,036,072 · +69.2%
- By 2100
- 2,222,402 · +84.6%
Race, ethnicity, and origin ACS 2023
- Neighborhood character
- Predominantly Black (76%)
- Race & ethnicity
- Black 76% White 14% Two or more races 4% Hispanic / Latino 4% Asian 2%
- Common ancestry
- Lithuanian 1% Slovak 1% Serbian 0%
- Foreign-born
- 5% · Canada, South Korea, Vietnam
- Languages at home
- 92% English-only · Spanish 4% French/Haitian/Cajun 1% Other Indo-European 1%
Political lean MEDSL · Fulton
- 2024 margin
- Solid D (+44.9) · D 71.9% · R 27.0% · Other 1.1%
- 2008→2024 swing
- +9.8pp toward D · 2008: 35.0pp · 2024: 44.9pp
- All cycles
- 2024: D+44.9 2020: D+46.4 2016: D+42.1 2012: D+29.6 2008: D+35.0
Not yet ingested
- Civics
- —
Market trends
- HPI YoY
- ▼ -204.00%
- Current HPI
- 418.7297
- Rent YoY
- ▲ 2.77%
- Metro
- Atlanta-Sandy Springs-Alpharetta, GA
- State GDP YoY
- ▲ 2.66%
- F500 in state
- 28
Industry mix (Fortune 500 HQ in GA)
| Industry | F500 HQs | Revenue |
|---|---|---|
| Paper / Packaging | 2 | $29B |
|
||
| Retail | 1 | $160B |
|
||
| Transportation / Logistics | 1 | $91B |
|
||
| Airlines | 1 | $62B |
|
||
| Consumer Goods | 1 | $47B |
|
||
| Utilities | 1 | $25B |
|
||
Price history
+0.0% since first listed2 events — show timeline
- 2026-06-16 Listed $225,000 GAMLS
- 2026-06-16 Listed $225,000 FMLS
Property tax history
+11.1%/yrLatest (2025): $4,179 · +4.9% YoY. Source: county tax records.
Cash-flow waterfall
monthlySold comps — $/sqft
last 12 mo · ≤1 miLoading sold comps…