 Triplex
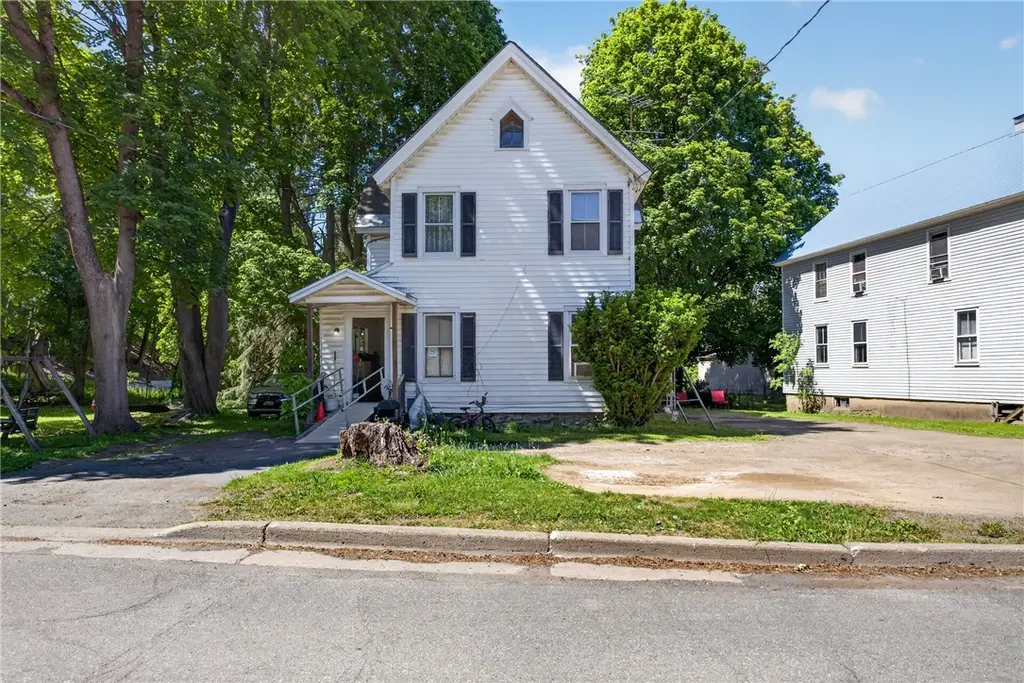
23 Academy St · New Berlin, NY
Flood risk 1/10 · Minimal
- FEMA flood zone
- X (unshaded)
- Chance of flooding over 30 yrs
- 0.0%
- Est. flood insurance / yr
- $473 – $860
Fire risk 1/10 · Minimal
- Est. fire insurance / yr
- $691 – $1,283
Heat risk 2/10 · Minimal
- Hot days now (above 93°F)
- 7 days/yr
- Hot days in 30 yrs
- 17 days/yr
Wind risk 2/10 · Minimal
- Chance of severe wind over 30 yrs
- 1.0%
Air-quality risk 1/10 · Minimal
- Unhealthy air days now
- 0 days/yr
- Unhealthy air days in 30 yrs
- 0 days/yr
Risk factors via First Street. Map © Google.
Why this score? — see what drove the B grade
The composite is a weighted blend of 9 inputs, each scored 0–100. Each bar is that input's sub-score; the figure is the points it added to the 100-point composite (weight × sub-score).
- Cash flow +30.0/30.0
- 1% rule +10.0/10.0
- DSCR +10.0/10.0
- Appreciation +10.0/10.0
- Livability +3.0/5.0
- Schools +2.7/10.0
- Rent growth +2.5/5.0
- Condition / age +2.5/5.0
- ARV discount +2.3/15.0
$144,900
🖨 Deal sheet 📄 Offer letter ✓ Due diligence
Multi-family units
County records classify this as Multi-Family (2-4 Unit). Listing-text estimate: 3 units. confirmed
Listing remarks MLS
Passive Income!!! Thinking about how to prepare for your future? Invest in this 3 family unit in New Berlin, NY. Located on a quiet one way street. This property has a good size yard, and is fully occupied. Apartments include- an efficiency, 2 bedroom downstairs and a 2 bedroom upstairs. Well priced and ready to go. Its such a great opportunity you might as well purchase the multi family next door at 25 Academy Street. (#132773) Now your'e cookin!!!
Key facts
- Off street parking
- Community parks
- 0.36 acre lot
Tags
Property features AI
Finance
- Other: Three total residential units; Three separate electric meters and two separate gas meters; All units are month-to-month
- Financial info: Owner pays water; water is included in rent; Operating expenses include fuel and water/sewer
Exterior
- Parking: Gravel/unpaved parking available
- Utilities: Public water connected; Septic tank sewer; Water service connected
- Home design: Two-story multi-unit property; Vinyl siding; Existing/resale condition
- Construction: Vinyl siding construction
- Exterior features: Enclosed porch; Open porch; Rectangular lot with 104 x 220 dimensions; Located on a main thoroughfare
Interior
- Kitchen: Eat-in kitchens in some units; Oven/range and refrigerator included in all units; Additional appliances listed per unit
- Bedrooms: Two 2-bedroom units; One 3-bedroom unit; One 1-bedroom unit
- Flooring: Carpet; Hardwood; Tile; Vinyl; Varies by unit
- Bathrooms: Three full bathrooms (total)
- Heating & cooling: Forced air heating; Oil-fired heat
- Interior features: Carpet, hardwood, tile, vinyl and varying flooring throughout; Partial basement
- Laundry & utility: Washer and dryer in some units; Laundry in unit for at least two units; Electric water heater
Neighborhood map
What this means for you Summary
Snapshot
- This is a 1×1bd/1.0ba + 2×2bd/1.0ba units multifamily listed at $145k.
Deal economics
- At list price, monthly cash flow is $1k ($13k/yr) — positive. Per door: $347/mo.
- The deal already cash-flows at list — no discount required.
- Meets the 1% rule at list price ($3k rent vs $145k).
Location & tenants
- Location reads 60/100 on livability (#960 in NY) — a middle-class / working-renter tenant base. Strengths: cost of living A+, housing A+; Watch: employment C-, health & safety C-, schools F.
- Unadilla Valley Central School District (rural): math 26% / reading 38% proficiency, ranked #571 of 590 in NY (top 97%) — families likely to look elsewhere, expect single-tenant / working-renter base with shorter leases.
- Market conditions: 28 active listings in the ZIP; 151 units permitted in Chenango County in 2024 (96 in 5+ unit buildings).
Forward outlook
- In year one you build about $15k of equity ($1k loan paydown + $14k appreciation (10.0% local appreciation)).
- Chenango County population projected at -26% by 2050 — secular population decline; favor cash flow + early exit over multi-decade hold.
- At projected returns (10.0% appreciation + 3.0% rent growth), your $41k cash investment doubles in ~2 years — after that, you're playing with house money.
- By year 3, paydown + projected appreciation supports a ~$39k cash-out refi (75% LTV) — recoverable capital for the next deal without selling this one.
Negotiation context
- Only 13 days on market — expect competitive offers; lowballing is unlikely to land.
- 4 sale attempts since 23y ago with the ask held roughly flat each time — persistent listings suggest the price (not the market) is what's stuck; bring a comps-based counter.
Risks & watch-outs
- Watch-outs: property tax is 2.7% of price; built in 1860 — expect roof / HVAC / electrical / plumbing capex.
Questions for the listing agent
- Can we see the unit-by-unit rent roll, current vacancy, and any below-market leases? What's the average tenancy length?
- What capital expenditures (roof, boiler, parking lot, exteriors) have been made in the last 5 years, and what's planned in the next 2?
- Built in 1860 — when were the roof, HVAC, electrical panel, plumbing, and water heater last replaced?
- Property tax is high relative to price — has the assessment been appealed recently, and will the sale trigger a re-assessment?
- Is there a deadline driving the sale (1031 exchange, divorce, estate, relocation)? That informs how much negotiation room exists.
- Schools are F-rated, which usually means shorter tenancies and higher turnover. Who's the typical renter profile here, and what's been the actual vacancy rate?
- Crime grade is F in this area — have there been break-ins, vandalism, or insurance claims at this property in the last 3 years? What carrier currently insures it and at what premium?
- What's the average days-on-market for RENTAL listings here right now (not sales)? A rising rental-DOM trend means longer vacancies and softer asking-rent achievability than the comps imply.
- What's the recent tenant-quality profile in this submarket — average credit score on applications, eviction rate, late-payment / NSF rate, and stable-employment percentage? A property-management company in the area should have these aggregated.
- How much new apartment / multifamily construction is in the pipeline within 1–3 miles? Heavy new supply (>2% of stock underway) typically softens rents 12–24 months out; light construction supports rent growth.
Investment metrics
- 1% rule
- 1.91% ✓
- Cap rate
- 14.92%
- Cash-on-cash
- 30.81%
- DSCR
- 2.37
- GRM
- 4.4
CMA / ARV
- ARV (on-the-fly)
- $129,976
- Comps found
- 1
Show comp detail 1 sale within ~0.75 mi
| Address | Dist | Beds/Ba | Sqft | Sold | Price | $/sf | Match |
|---|---|---|---|---|---|---|---|
| 11 Moss St | 0.30mi | 4/3.5 (-1) | 2,630 (-11%) | 10mo | $115,000 | $44 | 52 |
Match score weights: distance 35% · size 25% · config 20% · recency 20%. Top-matched comps best support the ARV.
Projected returns pro-forma
10.0% appreciation · 3.0% rent growth · sell at horizon
- IRR
- 47.8%
- Equity multiple
- 4.58×
- Total profit
- $145,394
- Equity at exit
- $130,537
- IRR
- 41.6%
- Equity multiple
- 10.27×
- Total profit
- $376,243
- Equity at exit
- $281,509
Cash invested: $40,572 (down + closing). Projections, not guarantees.
Landlord ↔ Tenant lean methodology
- Overall (STATE)
- 15 Strongly Tenant-Friendly
- State New York
- 15 Strongly Tenant-Friendly · D+10
- County
- — inherits STATE
- City
- — inherits STATE
ZIP-level market 13411
- Home prices YoY
- 3.3%
- Active inventory
- 28
- Price-to-rent
- 13.4×
Monthly cashflow live
- Estimated rent
- $2,767 medium interval (Pro) →
- Mortgage (P&I)
- −$760
- Tax from tax record
- −$324 /mo · $3,888/yr
- Insurance
- −$60
- HOA
- −$0
- Vacancy / Maint / Mgmt
- −$581
- Net cashflow
- $1,042
Break-even live
3-unit breakdown (identical units grouped — click to expand)
| Units | Beds | Baths | Est. rent |
|---|---|---|---|
| 1× unit | 1 | 1 | $899 |
| 2× units | 2 | 1 | $1,868 |
| #2 | 2 | 1 | $934 |
| #3 | 2 | 1 | $934 |
| Total (3 units) | $2,767 | ||
UW: 25.0% down · 7.5% · 30yr · 1.5% tax · 5.0% vac · 8.0% maint · 8.0% mgmt
Financing live
Cash to close
- Down payment
- $36,225
- Closing costs
- $4,347
- Reserves months
- —
- Total cash needed
- —
Loan-product check · same deal, 3 products live
Conventional
25% down · 7.5% · 30yr
- Down + closing
- —
- Monthly P&I
- —
- Monthly cashflow
- —
- DSCR
- —
- Eligible?
- —
Personal DTI + credit; lowest rate.
DSCR
20% down · 8.5% · 30yr
- Down + closing
- —
- Monthly P&I
- —
- Monthly cashflow
- —
- DSCR
- —
- Eligible?
- —
No personal income docs; deal must DSCR.
Hard money
10% down · 12.0% · 12mo
- Down + closing
- —
- Monthly P&I
- —
- Monthly cashflow
- —
- DSCR
- —
- Eligible?
- —
Short-term bridge; refi at stabilization.
Listing history 10 events
-
2026-06-18days on market $144,900 Active 13 DOM
-
2026-06-17days on market $144,900 Active 12 DOM
-
2026-06-16days on market $144,900 Active 11 DOM
-
2026-06-15days on market $144,900 Active 10 DOM
-
2026-06-13days on market $144,900 Active 8 DOM
-
2026-06-12days on market $144,900 Active 7 DOM
-
2026-06-09days on market $144,900 Active 4 DOM
-
2026-06-08days on market $144,900 Active 3 DOM
-
2026-06-07remarks 699-char remark
-
2026-06-07$144,900 Active 2 DOM
ⓘ Source: listings_history table (triggers on properties + properties_extension) + one-shot
backfill from property_details.listing_events for pre-trigger history.
Tax reassessment forecast NY · Partial reset (capped growth)
- Current annual tax
- $3,888 · $324/mo
- Projected year-2 tax
- $3,888 · $324/mo
- Expected delta
- $0/yr ($0/mo · 0.0%)
ⓘ Screening estimate from a state-policy table — verify with the county assessor before closing.
Climate risk First Street
- Flood 1/10 Low FEMA zone X (unshaded) · 0% chance over 30 yrs
- Wildfire 1/10 Low
- Heat 2/10 Low 7 d/yr ≥93°F today · 17 d/yr by 30 yrs out
- Wind 2/10 Low 100% chance of damaging wind over 30 yrs
- Air quality 1/10 Low 0 unhealthy d/yr today · 0 by 30 yrs out
Nearby sold comps map
Loading sold comps map…
Walkable amenities ~0.75 mi
Loading nearby amenities…
Taxation est. · year 1
- Rental income
- $33,204
- − Mortgage interest
- −$8,117
- − Property taxes
- −$3,888
- − Insurance
- −$724
- − Repairs & maintenance
- −$2,656
- − Management
- −$2,656
- − Depreciation
- −$4,215
- Taxable income
- $10,947
- Est. tax owed @ 24.0%
- −$2,627
- After-tax cash flow
- $9,873/yr
For passive investors: Depreciation is non-cash, so a rental often shows a tax loss while cash-flowing — sheltering income. Rental losses are passive: they offset passive income freely, and up to $25,000/yr can offset ordinary (W-2) income if you actively participate and your MAGI is under $100k (phasing out to $0 by $150k); unused losses carry forward. On sale, claimed depreciation is recaptured at up to 25%, and gains may owe capital-gains tax (a 1031 exchange can defer both). Figures are a year-1 estimate at your 24.0% rate — not tax advice; consult a CPA.
Schools (NCES district)
- District
- Unadilla Valley Central School District
- NCES district ID
- 3600019
- Math proficiency
- 26% ▼ -16.00%
- Reading proficiency
- 38% ▲ 5.00%
- Median HH income
- $45,176
- Composite
- 27.35/100
- National rank
- #6985
- State rank
- #571 of 590 in NY
Livability — New Berlin
- Score
- 60/100
- State rank
- #960
- US rank
- #18789
Category grades
Schools grade is shown separately in the Schools card above.
Census & demographics
- Census place
- New Berlin, NY
- Population (ZIP)
- 2,920
Population outlook (Chenango County) Hauer SSP2
- Today (2025)
- 45,669 people
- By 2030
- 43,484 · -4.8%
- By 2040
- 38,774 · -15.1%
- By 2050
- 34,000 · -25.6%
- By 2075
- 24,637 · -46.1%
- By 2100
- 16,452 · -64.0%
Race, ethnicity, and origin ACS 2023
- Neighborhood character
- Predominantly White (94%)
- Race & ethnicity
- White 94% Two or more races 4% Hispanic / Latino 3%
- Common ancestry
- Romanian 4% Lithuanian 3% Slovak 3%
- Foreign-born
- 1% · Canada
- Languages at home
- 95% English-only · German/W. Germanic 3% Spanish 2%
Political lean MEDSL · Chenango
- 2024 margin
- Strong R (+27.2) · D 36.4% · R 63.6%
- 2008→2024 swing
- -26.1pp toward R · 2008: -1.1pp · 2024: -27.2pp
- All cycles
- 2024: R+27.2 2020: R+23.3 2016: R+28.1 2012: R+3.4 2008: R+1.1
Not yet ingested
- Civics
- —
Market trends
- HPI YoY
- ▲ 10.20%
- Current HPI
- 323.6602
- Rent YoY
- —
- Metro
- —
- State GDP YoY
- ▲ 2.60%
- F500 in state
- 92
Industry mix (Fortune 500 HQ in NY)
| Industry | F500 HQs | Revenue |
|---|---|---|
| Financial Services | 10 | $950B |
|
||
| Consumer Goods | 9 | $162B |
|
||
| Insurance | 4 | $225B |
|
||
| Telecommunications | 2 | $144B |
|
||
| Pharmaceuticals | 2 | $112B |
|
||
| Media / Entertainment | 2 | $69B |
|
||
Price history
+145.6% since first listed8 events — show timeline
- 2026-06-05 Listed $144,900 UNYREIS
- 2022-01-06 Sold (Public Records) $144,000 Public Records
- 2021-12-24 Sold (MLS) $75,500 ODBOR
- 2021-12-24 Sold (MLS) $75,500 UNYREIS
- 2021-10-04 Listed $79,000 ODBOR
- 2021-10-04 Listed $79,000 UNYREIS
- 2004-02-09 Sold (MLS) $50,000 UNYREIS
- 2003-04-10 Listed $59,000 UNYREIS
Property tax history
+1.7%/yrLatest (2025): $3,888 · +2.0% YoY. Source: county tax records.
Cash-flow waterfall
monthlySold comps — $/sqft
last 12 mo · ≤1 miLoading sold comps…