 16-Plex
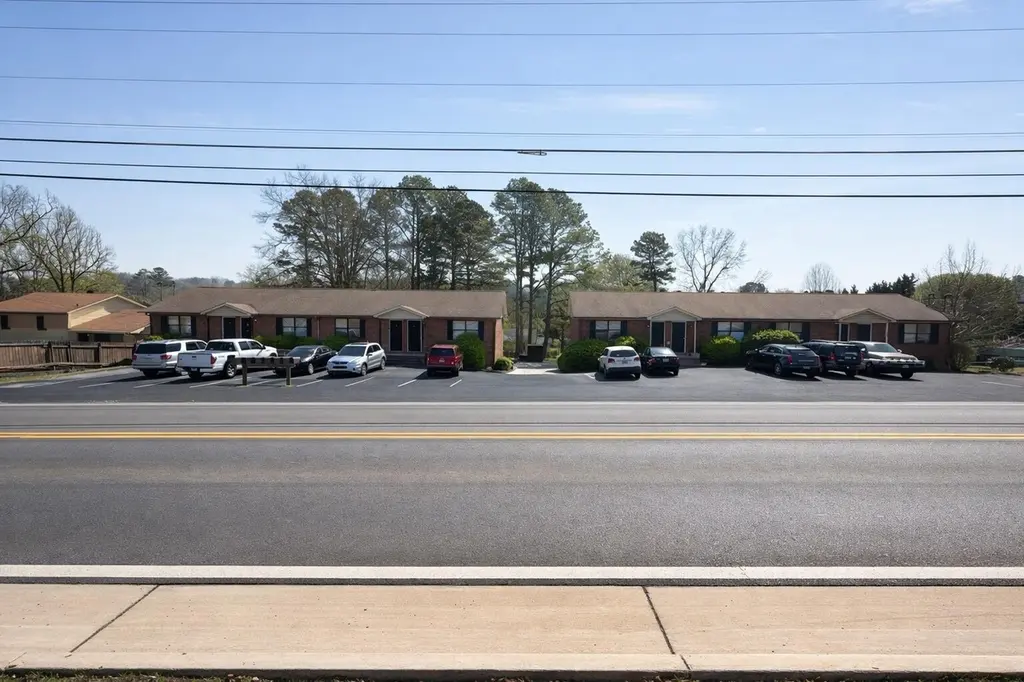
3540 Adkisson Dr NW · Cleveland, TN
Flood risk 1/10 · Minimal
- FEMA flood zone
- X (unshaded)
- Chance of flooding over 30 yrs
- 0.0%
- Est. flood insurance / yr
- $473 – $860
Fire risk 4/10 · Minor
- Est. fire insurance / yr
- $949 – $1,763
Heat risk 6/10 · Moderate
- Hot days now (above 105°F)
- 7 days/yr
- Hot days in 30 yrs
- 19 days/yr
Wind risk 3/10 · Minor
- Chance of severe wind over 30 yrs
- 6.0%
Air-quality risk 3/10 · Minor
- Unhealthy air days now
- 2 days/yr
- Unhealthy air days in 30 yrs
- 3 days/yr
Risk factors via First Street. Map © Google.
Why this score? — see what drove the C grade
The composite is a weighted blend of 9 inputs, each scored 0–100. Each bar is that input's sub-score; the figure is the points it added to the 100-point composite (weight × sub-score).
- Cash flow +25.9/30.0
- DSCR +8.7/10.0
- ARV discount +7.5/15.0
- 1% rule +5.7/10.0
- Livability +3.5/5.0
- Rent growth +2.5/5.0
- Condition / age +2.5/5.0
- Schools +2.1/10.0
- Appreciation +0.0/10.0
$1,499,000
🖨 Deal sheet 📄 Offer letter ✓ Due diligence
Multi-family units
County records classify this as Multi-Family (5+ Unit). Listing-text estimate: 16 units. confirmed
5+ unit building — per-unit beds/baths from public records are typically unavailable; the breakdown below (if shown) is an estimate from the listing text.
Listing remarks MLS
This 16-unit multifamily opportunity (two buildings with 8 units each) offers a compelling value-add investment in a high-demand rental corridor adjacent to Cleveland State Community College. The property consists of all 1 bed / 1 bath units, ideally suited for student housing, providing consistent occupancy potential and reliable rental demand. Constructed of low-maintenance brick, the asset includes an on-site laundry facility, creating an additional income stream opportunity. With its prime location near campus, tenants benefit from walkable access to school and a short drive to restaurants, retail, and I-75, enhancing long-term desirability. Value-add potential exists through interior upgrades, rent optimization, and operational efficiencies--positioning this asset for increased NOI and long-term appreciation. Ideal for investors seeking stable cash flow with upside, this property combines location, durability, and scalability in a growing rental market.
Key facts
- Short drive to i-75
- 0.93 acre lot
- Built 1986
Tags
Property features AI
Finance
- Financial info: Property listed as residential income with 16 total units; Owner pays: Other; Tenants pay: Other and electricity
Exterior
- Parking: Concrete and paved parking areas; No covered parking reported
- Security: Smoke detector(s)
- Utilities: Public water; Public sewer; Electric service available
- Home design: Residential income property; Attached multi-family; Two-story building; Multi-family structure
- Construction: Brick and other construction materials; Shingle roof; Existing structure
- Exterior features: Public water; Public sewer; Electricity available; Water available; Lot approximately 202 x 201
Interior
- Flooring: Laminate
- Heating & cooling: Central electric heating; Central air conditioning
- Interior features: Laminate flooring; Central heating (electric); Central air conditioning; Smoke detectors
Neighborhood map
What this means for you Summary
Snapshot
- This is a 16 × 1-bed/1-bath units multifamily listed at $1.50M.
Deal economics
- At list price, monthly cash flow is $4k ($44k/yr) — positive. Per door: $230/mo.
- The deal already cash-flows at list — no discount required.
- Meets the 1% rule at list price ($16k rent vs $1.50M).
- Recommended offer: $1.48M (1.5% below list) — sets the bar for market timing.
- Cap rate 9.2% vs local median 3.5% in Cleveland — top-decile yield for the area; either an underpriced asset or a hidden risk that comps aren't pricing in. Stress-test before assuming the spread holds.
Location & tenants
- Location reads 70/100 on livability (#55 in TN) — a middle-class / working-renter tenant base. Strengths: cost of living A+, health & safety A+, housing A; Watch: employment D, crime F, amenities F.
- Cleveland (urban): math 23% / reading 28% proficiency, ranked #85 of 139 in TN (top 61%) — low school quality limits family demand, transient renter base, plan for 1-2y turnover.
- Zoned schools: Cleveland High (math 8% / reading 29%, grade F, #208 of 332 statewide, top 63%, 1,842 students, 0% FRL) — zoned schools average 0% FRL vs 53% district-wide (53 pts lower); this property's tenant base skews higher-income than the district average.
- Market conditions: Rents flat; 549 active listings in the ZIP; solid renter incomes; 768 units permitted in Bradley County in 2024 (0 in 5+ unit buildings).
- At $16,019/mo this rent would consume 246% of the median local household income ($78k/yr) (locally 908% of renters already pay >50% of income on rent) — very limited rent-growth headroom before tenants either downsize or default.
Forward outlook
- Local home prices are declining (-3.0%/yr); year-one equity from $10k of loan paydown is wiped out by about $45k of value loss. Plan a longer hold.
- Bradley County population projected at +21% by 2050 — long-run rental-demand tailwind backs the buy-and-hold thesis.
Negotiation context
- It's been on market 30 days — a 2% lower offer ($1.48M) is reasonable based on typical stale-listing flexibility.
- 3 sale attempts since 9y ago; this cycle's ask has dropped $101k (6%) from the opening price — seller is motivated, your offer sets the floor, not the list.
- Current owner paid $670k; list at $1.50M implies a 124% gain — meaningful room to come down on a strong offer.
Risks & watch-outs
- Climate carrying-cost: extreme-heat days projected 7→19/yr by 2055 (HVAC capex compounding) — expect insurance premiums to compound above CPI over the hold.
Questions for the listing agent
- Can we see the unit-by-unit rent roll, current vacancy, and any below-market leases? What's the average tenancy length?
- What capital expenditures (roof, boiler, parking lot, exteriors) have been made in the last 5 years, and what's planned in the next 2?
- Is there a deadline driving the sale (1031 exchange, divorce, estate, relocation)? That informs how much negotiation room exists.
- Schools are D-rated, which usually means shorter tenancies and higher turnover. Who's the typical renter profile here, and what's been the actual vacancy rate?
- Crime grade is F in this area — have there been break-ins, vandalism, or insurance claims at this property in the last 3 years? What carrier currently insures it and at what premium?
- What's the average days-on-market for RENTAL listings here right now (not sales)? A rising rental-DOM trend means longer vacancies and softer asking-rent achievability than the comps imply.
- What's the recent tenant-quality profile in this submarket — average credit score on applications, eviction rate, late-payment / NSF rate, and stable-employment percentage? A property-management company in the area should have these aggregated.
- How much new apartment / multifamily construction is in the pipeline within 1–3 miles? Heavy new supply (>2% of stock underway) typically softens rents 12–24 months out; light construction supports rent growth.
Investment metrics
- 1% rule
- 1.07% ✓
- Cap rate
- 9.24%
- Cash-on-cash
- 10.51%
- DSCR
- 1.47
- GRM
- 7.8
CMA / ARV
No comps found within radius.
Projected returns pro-forma
-3.0% appreciation · 0.15% rent growth · sell at horizon
- IRR
- -3.5%
- Equity multiple
- 0.87×
- Total profit
- $-53,973
- Equity at exit
- $223,506
- IRR
- 3.0%
- Equity multiple
- 1.19×
- Total profit
- $78,986
- Equity at exit
- $129,606
Cash invested: $419,720 (down + closing). Projections, not guarantees.
Landlord ↔ Tenant lean methodology
- Overall (STATE)
- 87 Strongly Landlord-Friendly
- State Tennessee
- 87 Strongly Landlord-Friendly · R+13
- County
- — inherits STATE
- City
- — inherits STATE
ZIP-level market 37312
- Rents YoY
- 0.1%
- Active inventory
- 549
- Price-to-rent
- 124.8×
Monthly cashflow live
- Estimated rent
- $16,019 medium interval (Pro) →
- Mortgage (P&I)
- −$7,861
- Tax from tax record
- −$492 /mo · $5,908/yr
- Insurance
- −$625
- HOA
- −$0
- Vacancy / Maint / Mgmt
- −$3,364
- Net cashflow
- $3,677
Break-even live
16-unit breakdown (identical units grouped — click to expand)
| Units | Beds | Baths | Est. rent |
|---|---|---|---|
| 16× units | 1 | 1 | $16,016 |
| #1 | 1 | 1 | $1,001 |
| #2 | 1 | 1 | $1,001 |
| #3 | 1 | 1 | $1,001 |
| #4 | 1 | 1 | $1,001 |
| #5 | 1 | 1 | $1,001 |
| #6 | 1 | 1 | $1,001 |
| #7 | 1 | 1 | $1,001 |
| #8 | 1 | 1 | $1,001 |
| #9 | 1 | 1 | $1,001 |
| #10 | 1 | 1 | $1,001 |
| #11 | 1 | 1 | $1,001 |
| #12 | 1 | 1 | $1,001 |
| #13 | 1 | 1 | $1,001 |
| #14 | 1 | 1 | $1,001 |
| #15 | 1 | 1 | $1,001 |
| #16 | 1 | 1 | $1,001 |
| Total (16 units) | $16,019 | ||
UW: 25.0% down · 7.5% · 30yr · 1.5% tax · 5.0% vac · 8.0% maint · 8.0% mgmt
Financing live
Cash to close
- Down payment
- $374,750
- Closing costs
- $44,970
- Reserves months
- —
- Total cash needed
- —
Loan-product check · same deal, 3 products live
Conventional
25% down · 7.5% · 30yr
- Down + closing
- —
- Monthly P&I
- —
- Monthly cashflow
- —
- DSCR
- —
- Eligible?
- —
Personal DTI + credit; lowest rate.
DSCR
20% down · 8.5% · 30yr
- Down + closing
- —
- Monthly P&I
- —
- Monthly cashflow
- —
- DSCR
- —
- Eligible?
- —
No personal income docs; deal must DSCR.
Hard money
10% down · 12.0% · 12mo
- Down + closing
- —
- Monthly P&I
- —
- Monthly cashflow
- —
- DSCR
- —
- Eligible?
- —
Short-term bridge; refi at stabilization.
Listing history 26 events
-
2026-06-19days on market $1,499,000 Active 30 DOM
-
2026-06-18days on market $1,499,000 Active 29 DOM
-
2026-06-18price $1,499,000 Active 28 DOM
-
2026-06-17days on market $1,600,000 Active 28 DOM
-
2026-06-16days on market $1,600,000 Active 27 DOM
-
2026-06-15days on market $1,600,000 Active 26 DOM
-
2026-06-14days on market $1,600,000 Active 24 DOM
-
2026-06-13days on market $1,600,000 Active 23 DOM
-
2026-06-10days on market $1,600,000 Active 21 DOM
-
2026-06-09days on market $1,600,000 Active 20 DOM
-
2026-06-08days on market $1,600,000 Active 19 DOM
-
2026-06-07days on market $1,600,000 Active 18 DOM
-
2026-06-05days on market $1,600,000 Active 15 DOM
-
2026-06-03days on market $1,600,000 Active 14 DOM
-
2026-06-02days on market $1,600,000 Active 13 DOM
-
2026-06-01days on market $1,600,000 Active 12 DOM
-
2026-05-31days on market $1,600,000 Active 11 DOM
-
2026-05-30days on market $1,600,000 Active 10 DOM
-
2026-03-20$1,600,000 Active
-
2026-03-19$1,600,000 Active 972-char remark
Show marketing remark (972 chars)
This 16-unit multifamily opportunity (two buildings with 8 units each) offers a compelling value-add investment in a high-demand rental corridor adjacent to Cleveland State Community College. The property consists of all 1 bed / 1 bath units, ideally suited for student housing, providing consistent occupancy potential and reliable rental demand. Constructed of low-maintenance brick, the asset includes an on-site laundry facility, creating an additional income stream opportunity. With its prime location near campus, tenants benefit from walkable access to school and a short drive to restaurants, retail, and I-75, enhancing long-term desirability. Value-add potential exists through interior upgrades, rent optimization, and operational efficiencies--positioning this asset for increased NOI and long-term appreciation. Ideal for investors seeking stable cash flow with upside, this property combines location, durability, and scalability in a growing rental market.
-
2017-07-21soldstatus $670,000
-
2017-07-19soldstatus $670,000 48-char remark
Show marketing remark (48 chars)
16 Unit 1 BR Apartments in two 8 unit buildings.
-
2017-07-19soldstatus $670,000
Show marketing remark (48 chars)
16 Unit 1 BR Apartments in two 8 unit buildings.
-
2017-07-19$670,000 48-char remark
Show marketing remark (48 chars)
16 Unit 1 BR Apartments in two 8 unit buildings.
-
2007-06-06soldstatus $430,000
-
2007-01-16soldstatus $370,000
ⓘ Source: listings_history table (triggers on properties + properties_extension) + one-shot
backfill from property_details.listing_events for pre-trigger history.
Tax reassessment forecast TN · Resets to sale price
- Current annual tax
- $5,908 · $492/mo
- Projected year-2 tax
- $10,643 · $887/mo
- Expected delta
- +$4,735/yr (+$395/mo · 80.1%)
ⓘ Screening estimate from a state-policy table — verify with the county assessor before closing.
Climate risk First Street
- Flood 1/10 Low FEMA zone X (unshaded) · 0% chance over 30 yrs
- Wildfire 4/10 Moderate
- Heat 6/10 Major 7 d/yr ≥105°F today · 19 d/yr by 30 yrs out
- Wind 3/10 Moderate 6% chance of damaging wind over 30 yrs
- Air quality 3/10 Moderate 2 unhealthy d/yr today · 3 by 30 yrs out
Nearby sold comps map
Loading sold comps map…
Walkable amenities ~0.75 mi
Loading nearby amenities…
Taxation est. · year 1
- Rental income
- $192,228
- − Mortgage interest
- −$83,967
- − Property taxes
- −$5,908
- − Insurance
- −$7,495
- − Repairs & maintenance
- −$15,378
- − Management
- −$15,378
- − Depreciation
- −$43,607
- Taxable income
- $20,494
- Est. tax owed @ 24.0%
- −$4,919
- After-tax cash flow
- $39,208/yr
For passive investors: Depreciation is non-cash, so a rental often shows a tax loss while cash-flowing — sheltering income. Rental losses are passive: they offset passive income freely, and up to $25,000/yr can offset ordinary (W-2) income if you actively participate and your MAGI is under $100k (phasing out to $0 by $150k); unused losses carry forward. On sale, claimed depreciation is recaptured at up to 25%, and gains may owe capital-gains tax (a 1031 exchange can defer both). Figures are a year-1 estimate at your 24.0% rate — not tax advice; consult a CPA.
Schools (NCES district)
- District
- Cleveland
- NCES district ID
- 4700690
- Math proficiency
- 23% ▼ -9.00%
- Reading proficiency
- 28% ▼ -6.00%
- Median HH income
- $37,612
- Composite
- 21.28/100
- National rank
- #8394
- State rank
- #85 of 139 in TN
Livability — Cleveland
- Score
- 70/100
- State rank
- #55
- US rank
- #7689
Category grades
Schools grade is shown separately in the Schools card above.
Census & demographics
- Census place
- Cleveland, TN
- County
- Bradley County · 99,337 people
- City population
- 99,337
- Metro
- Cleveland, TN
- Population (ZIP)
- 36,669
- Household income
- $78,261
- Rent vs Own
- Severe rent burden
- 908.0
Population outlook (Bradley County) Hauer SSP2
- Today (2025)
- 114,901 people
- By 2030
- 120,137 · +4.6%
- By 2040
- 130,125 · +13.2%
- By 2050
- 139,257 · +21.2%
- By 2075
- 161,664 · +40.7%
- By 2100
- 179,767 · +56.5%
Race, ethnicity, and origin ACS 2023
- Neighborhood character
- Predominantly White (82%)
- Race & ethnicity
- White 82% Hispanic / Latino 7% Two or more races 6% Black 4% Asian 3%
- Hispanic origin (detail)
- Mexican 3% Puerto Rican 1%
- Common ancestry
- Serbian 3% Slovak 2% Italian 2%
- Foreign-born
- 7% · Canada, South Korea
- Languages at home
- 92% English-only · Spanish 4% Other Indo-European 2% Russian/Polish/Slavic 1%
Political lean MEDSL · Bradley
- 2024 margin
- Solid R (+58.9) · D 20.0% · R 78.9% · Other 1.1%
- 2008→2024 swing
- -9.2pp toward R · 2008: -49.7pp · 2024: -58.9pp
- All cycles
- 2024: R+58.9 2020: R+55.3 2016: R+59.1 2012: R+53.9 2008: R+49.7
Not yet ingested
- Civics
- —
Market trends
- HPI YoY
- ▼ -206.27%
- Current HPI
- 260.8746
- Rent YoY
- ▲ 0.15%
- Metro
- Cleveland, TN
- State GDP YoY
- ▲ 2.78%
- F500 in state
- 22
Industry mix (Fortune 500 HQ in TN)
| Industry | F500 HQs | Revenue |
|---|---|---|
| Healthcare | 3 | $91B |
|
||
| Retail | 3 | $72B |
|
||
| Transportation / Logistics | 1 | $88B |
|
||
| Paper / Packaging | 1 | $19B |
|
||
| Insurance | 1 | $13B |
|
||
| Energy | 1 | $12B |
|
||
Price history
+332.4% since first listed8 events — show timeline
- 2026-03-20 Listed $1,600,000 REALTRACS as Distributed by MLS Grid
- 2026-03-19 Listed $1,600,000 RCAOR
- 2017-07-21 Sold (Public Records) $670,000 Public Records
- 2017-07-19 Listed $670,000 RCAOR
- 2017-07-19 Sold (MLS) $670,000 REALTRACS as Distributed by MLS Grid
- 2017-07-19 Sold (MLS) $670,000 RCAOR
- 2007-06-06 Sold (Public Records) $430,000 Public Records
- 2007-01-16 Sold (Public Records) $370,000 Public Records
Property tax history
-1.4%/yrLatest (2025): $5,908 · +17.4% YoY. Source: county tax records.
Cash-flow waterfall
monthlySold comps — $/sqft
last 12 mo · ≤1 miLoading sold comps…