 Triplex
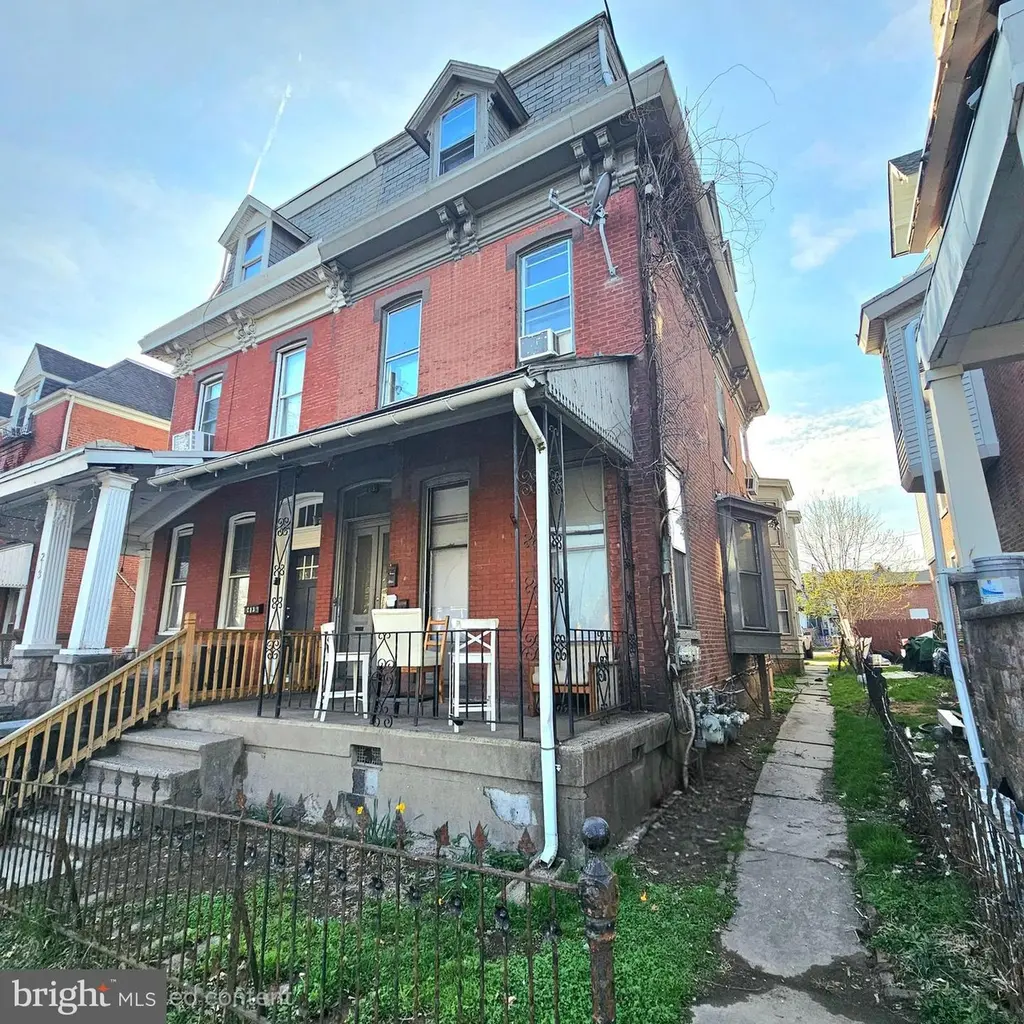
215 Haws Ave · Norristown, PA
Flood risk 1/10 · Minimal
- FEMA flood zone
- X (unshaded)
- Chance of flooding over 30 yrs
- 0.0%
- Est. flood insurance / yr
- $473 – $860
Fire risk 1/10 · Minimal
- Est. fire insurance / yr
- $511 – $949
Heat risk 6/10 · Moderate
- Hot days now (above 102°F)
- 7 days/yr
- Hot days in 30 yrs
- 15 days/yr
Wind risk 6/10 · Moderate
- Chance of severe wind over 30 yrs
- 27.0%
Air-quality risk 4/10 · Minor
- Unhealthy air days now
- 3 days/yr
- Unhealthy air days in 30 yrs
- 5 days/yr
Risk factors via First Street. Map © Google.
Why this score? — see what drove the C+ grade
The composite is a weighted blend of 9 inputs, each scored 0–100. Each bar is that input's sub-score; the figure is the points it added to the 100-point composite (weight × sub-score).
- Cash flow +30.0/30.0
- 1% rule +10.0/10.0
- DSCR +10.0/10.0
- Livability +4.2/5.0
- Rent growth +2.8/5.0
- Condition / age +2.5/5.0
- Schools +2.2/10.0
- ARV discount +2.1/15.0
- Appreciation +0.0/10.0
$350,000
🖨 Deal sheet 📄 Offer letter ✓ Due diligence
Multi-family units
County records classify this as Multi-Family (2-4 Unit). Listing-text estimate: 3 units. confirmed
Listing remarks MLS
* * Investor Alert! * * Price reduced! Excellent opportunity to own a Triplex just minutes from Main Street. The property is partially occupied, with the potential to increase returns. It features four rear parking spaces and is conveniently located near the train station, bus stops, gas stations, and popular Main Street dining. A solid investment in a high-demand area with great upside potential. Schedule your showing today to explore everything this property has to offer!
Key facts
- High demand area
- 3,100 sq ft lot
- 4 parking spots
Tags
Neighborhood map
What this means for you Summary
Snapshot
- This is a 3 × 5-bed/3.0-bath units multifamily listed at $350k.
Deal economics
- At list price, monthly cash flow is $4k ($48k/yr) — positive. Per door: $1k/mo.
- The deal already cash-flows at list — no discount required.
- Meets the 1% rule at list price ($8k rent vs $350k).
- Recommended offer: $308k (12.0% below list) — sets the bar for market timing.
- Cap rate 20.0% vs local median 4.5% in Norristown — top-decile yield for the area; either an underpriced asset or a hidden risk that comps aren't pricing in. Stress-test before assuming the spread holds.
Location & tenants
- Location reads 84/100 on livability (#100 in PA, #720 nationally) — a professional / high-income tenant draw. Strengths: amenities A+, commute A+, cost of living A+; Watch: schools C-, crime D-.
- Norristown Area SD (suburban): math 18% / reading 31% proficiency, ranked #466 of 539 in PA (top 86%) — low school quality limits family demand, transient renter base, plan for 1-2y turnover; 70% free/reduced lunch — lower-income household profile, screen leases tightly.
- Market conditions: Rents rising (+1.3%/yr); 164 active listings in the ZIP; 1 comparable units currently listed for rent nearby; 1,936 units permitted in Montgomery County in 2024 (530 in 5+ unit buildings).
- At $8,102/mo this rent would consume 139% of the median local household income ($70k/yr) (locally 2725% of renters already pay >50% of income on rent) — very limited rent-growth headroom before tenants either downsize or default.
Forward outlook
- Local home prices are declining (-3.0%/yr); year-one equity from $2k of loan paydown is wiped out by about $10k of value loss. Plan a longer hold.
- Montgomery County population projected at +5% by 2050 — modest demand growth; plan on rents tracking national, not racing it.
- At projected returns (-3.0% appreciation + 1.3% rent growth), your $98k cash investment doubles in ~3 years — after that, you're playing with house money.
Negotiation context
- It's been on market 138 days — a 12% lower offer ($308k) is reasonable based on typical stale-listing flexibility.
- 2 sale attempts since 7y ago; this cycle's ask has dropped $39k (10%) from the opening price — seller is motivated, your offer sets the floor, not the list.
- Current owner paid $202k; list at $350k implies a 73% gain — meaningful room to come down on a strong offer.
Risks & watch-outs
- Watch-outs: built in 1900 — expect roof / HVAC / electrical / plumbing capex.
- Climate carrying-cost: major wind risk, 27% chance of damaging wind over 30y; extreme-heat days projected 7→15/yr by 2055 (HVAC capex compounding) — expect insurance premiums to compound above CPI over the hold.
Questions for the listing agent
- It's been on market 138 days. Have you received any prior offers? Is the seller open to a 12% concession, seller financing, or rate buy-down credit?
- Can we see the unit-by-unit rent roll, current vacancy, and any below-market leases? What's the average tenancy length?
- What capital expenditures (roof, boiler, parking lot, exteriors) have been made in the last 5 years, and what's planned in the next 2?
- Built in 1900 — when were the roof, HVAC, electrical panel, plumbing, and water heater last replaced?
- Why hasn't it sold? Are there any deal-killer items the seller is aware of (foundation, flood, title, zoning, code violations)?
- Is there a deadline driving the sale (1031 exchange, divorce, estate, relocation)? That informs how much negotiation room exists.
- Crime grade is D in this area — have there been break-ins, vandalism, or insurance claims at this property in the last 3 years? What carrier currently insures it and at what premium?
- What's the average days-on-market for RENTAL listings here right now (not sales)? A rising rental-DOM trend means longer vacancies and softer asking-rent achievability than the comps imply.
- What's the recent tenant-quality profile in this submarket — average credit score on applications, eviction rate, late-payment / NSF rate, and stable-employment percentage? A property-management company in the area should have these aggregated.
- How much new apartment / multifamily construction is in the pipeline within 1–3 miles? Heavy new supply (>2% of stock underway) typically softens rents 12–24 months out; light construction supports rent growth.
Investment metrics
- 1% rule
- 2.31% ✓
- Cap rate
- 19.97%
- Cash-on-cash
- 48.84%
- DSCR
- 3.17
- GRM
- 3.6
CMA / ARV
- ARV (median comp)
- $312,199
- List price
- $350,000
- Delta
- 12.11%
- Verdict
- OVERPRICED
- Comps
- 20 within 1.0 mi
Show comp detail 5 sales within ~0.75 mi
| Address | Dist | Beds/Ba | Sqft | Sold | Price | $/sf | Match |
|---|---|---|---|---|---|---|---|
| 1008 W Main St | 0.20mi | 5/— (-1) | 2,998 (-2%) | 9mo | $302,500 | $101 | 75 |
| 557 Haws Ave | 0.23mi | 5/3.0 (-1) | 2,950 (-3%) | 7mo | $210,000 | $71 | 74 |
| 1105 W Main St | 0.29mi | 5/— (-1) | 3,082 (+1%) | 15mo | $275,000 | $89 | 67 |
| 501 Stanbridge St | 0.15mi | 7/4.0 (+1) | 2,735 (-10%) | 10mo | $365,000 | $133 | 58 |
| 515 Cherry St | 0.54mi | 5/5.0 (-1) | 2,664 (-12%) | 16mo | $395,000 | $148 | 28 |
Match score weights: distance 35% · size 25% · config 20% · recency 20%. Top-matched comps best support the ARV.
Projected returns pro-forma
-3.0% appreciation · 1.29% rent growth · sell at horizon
- IRR
- 44.5%
- Equity multiple
- 2.88×
- Total profit
- $183,757
- Equity at exit
- $52,186
- IRR
- 49.6%
- Equity multiple
- 5.42×
- Total profit
- $433,290
- Equity at exit
- $30,262
Cash invested: $98,000 (down + closing). Projections, not guarantees.
Landlord ↔ Tenant lean methodology
- Overall (STATE)
- 62 Landlord-Friendly
- State Pennsylvania
- 62 Landlord-Friendly · EVEN
- County
- — inherits STATE
- City
- — inherits STATE
ZIP-level market 19401
- Rents YoY
- 1.3%
- Active inventory
- 164
- Price-to-rent
- 10.8×
Monthly cashflow live
- Estimated rent
- $8,102 medium interval (Pro) →
- Mortgage (P&I)
- −$1,835
- Tax from tax record
- −$430 /mo · $5,164/yr
- Insurance
- −$146
- HOA
- −$0
- Vacancy / Maint / Mgmt
- −$1,701
- Net cashflow
- $3,989
Break-even live
3-unit breakdown (identical units grouped — click to expand)
| Units | Beds | Baths | Est. rent |
|---|---|---|---|
| 3× units | 5 | 3 | $8,103 |
| #1 | 5 | 3 | $2,701 |
| #2 | 5 | 3 | $2,701 |
| #3 | 5 | 3 | $2,701 |
| Total (3 units) | $8,102 | ||
UW: 25.0% down · 7.5% · 30yr · 1.5% tax · 5.0% vac · 8.0% maint · 8.0% mgmt
Financing live
Cash to close
- Down payment
- $87,500
- Closing costs
- $10,500
- Reserves months
- —
- Total cash needed
- —
Loan-product check · same deal, 3 products live
Conventional
25% down · 7.5% · 30yr
- Down + closing
- —
- Monthly P&I
- —
- Monthly cashflow
- —
- DSCR
- —
- Eligible?
- —
Personal DTI + credit; lowest rate.
DSCR
20% down · 8.5% · 30yr
- Down + closing
- —
- Monthly P&I
- —
- Monthly cashflow
- —
- DSCR
- —
- Eligible?
- —
No personal income docs; deal must DSCR.
Hard money
10% down · 12.0% · 12mo
- Down + closing
- —
- Monthly P&I
- —
- Monthly cashflow
- —
- DSCR
- —
- Eligible?
- —
Short-term bridge; refi at stabilization.
Rent comps 1 comps
| Address | Beds | Baths | Sqft | Rent | $/sqft | DOM | Units | Dist |
|---|---|---|---|---|---|---|---|---|
| 217 E Marshall St Norristown, PA | 5.0 | 1.5 | 2142 | $2,450 | $1.14 | 4d | 1 | 0.86mi |
Listing history 24 events
-
2026-06-18days on market $350,000 Active 138 DOM
-
2026-06-17days on market $350,000 Active 137 DOM
-
2026-06-16days on market $350,000 Active 136 DOM
-
2026-06-15days on market $350,000 Active 135 DOM
-
2026-06-13days on market $350,000 Active 133 DOM
-
2026-06-13days on market $350,000 Active 132 DOM
-
2026-06-09days on market $350,000 Active 129 DOM
-
2026-06-08days on market $350,000 Active 128 DOM
-
2026-06-07days on market $350,000 Active 127 DOM
-
2026-06-04days on market $350,000 Active 124 DOM
-
2026-06-03days on market $350,000 Active 123 DOM
-
2026-06-02days on market $350,000 Active 122 DOM
-
2026-06-01days on market $350,000 Active 121 DOM
-
2026-05-31pricedays on market $350,000 Active 120 DOM
-
2026-05-08price $365,000 481-char remark
Show marketing remark (481 chars)
* * Investor Alert! * * Price reduced! Excellent opportunity to own a Triplex just minutes from Main Street. The property is partially occupied, with the potential to increase returns. It features four rear parking spaces and is conveniently located near the train station, bus stops, gas stations, and popular Main Street dining. A solid investment in a high-demand area with great upside potential. Schedule your showing today to explore everything this property has to offer!
-
2026-01-31$389,000 Active 481-char remark
Show marketing remark (481 chars)
* * Investor Alert! * * Price reduced! Excellent opportunity to own a Triplex just minutes from Main Street. The property is partially occupied, with the potential to increase returns. It features four rear parking spaces and is conveniently located near the train station, bus stops, gas stations, and popular Main Street dining. A solid investment in a high-demand area with great upside potential. Schedule your showing today to explore everything this property has to offer!
-
2022-08-19soldstatus $202,400
-
2022-04-06soldstatus $190,000
-
2019-11-27historical
-
2019-11-12$149,900 Active
-
2003-04-11soldstatus $110,000
-
1990-09-12soldstatus $115,000
-
1988-01-28soldstatus $80,500
-
1983-09-26soldstatus $48,000
ⓘ Source: listings_history table (triggers on properties + properties_extension) + one-shot
backfill from property_details.listing_events for pre-trigger history.
Tax reassessment forecast PA · Partial reset (capped growth)
- Current annual tax
- $5,164 · $430/mo
- Projected year-2 tax
- $5,347 · $446/mo
- Expected delta
- +$183/yr (+$15/mo · 3.5%)
ⓘ Screening estimate from a state-policy table — verify with the county assessor before closing.
Climate risk First Street
- Flood 1/10 Low FEMA zone X (unshaded) · 0% chance over 30 yrs
- Wildfire 1/10 Low
- Heat 6/10 Major 7 d/yr ≥102°F today · 15 d/yr by 30 yrs out
- Wind 6/10 Major 27% chance of damaging wind over 30 yrs
- Air quality 4/10 Moderate 3 unhealthy d/yr today · 5 by 30 yrs out
Nearby sold comps map
Loading sold comps map…
Walkable amenities ~0.75 mi
Loading nearby amenities…
Taxation est. · year 1
- Rental income
- $97,224
- − Mortgage interest
- −$19,605
- − Property taxes
- −$5,164
- − Insurance
- −$1,750
- − Repairs & maintenance
- −$7,778
- − Management
- −$7,778
- − Depreciation
- −$10,182
- Taxable income
- $44,967
- Est. tax owed @ 24.0%
- −$10,792
- After-tax cash flow
- $37,076/yr
For passive investors: Depreciation is non-cash, so a rental often shows a tax loss while cash-flowing — sheltering income. Rental losses are passive: they offset passive income freely, and up to $25,000/yr can offset ordinary (W-2) income if you actively participate and your MAGI is under $100k (phasing out to $0 by $150k); unused losses carry forward. On sale, claimed depreciation is recaptured at up to 25%, and gains may owe capital-gains tax (a 1031 exchange can defer both). Figures are a year-1 estimate at your 24.0% rate — not tax advice; consult a CPA.
Schools (NCES district)
- District
- Norristown Area SD
- NCES district ID
- 4216980
- Math proficiency
- 18% ▼ -11.00%
- Reading proficiency
- 31% ▼ -14.00%
- Median HH income
- $56,024
- Composite
- 22.17/100
- National rank
- #8166
- State rank
- #466 of 539 in PA
Livability — Norristown
- Score
- 84/100
- State rank
- #100
- US rank
- #720
Category grades
Schools grade is shown separately in the Schools card above.
Census & demographics
- Census place
- Norristown, PA
- County
- Montgomery County · 712,331 people
- City population
- 87,376
- Metro
- Philadelphia-Camden-Wilmington, PA-NJ-DE-MD
- Population (ZIP)
- 43,359
- Household income
- $69,908
- Rent vs Own
- Severe rent burden
- 2725.0
Population outlook (Montgomery County) Hauer SSP2
- Today (2025)
- 856,074 people
- By 2030
- 870,887 · +1.7%
- By 2040
- 891,195 · +4.1%
- By 2050
- 896,417 · +4.7%
- By 2075
- 903,212 · +5.5%
- By 2100
- 843,240 · -1.5%
Race, ethnicity, and origin ACS 2023
- Neighborhood character
- Highly diverse neighborhood (Simpson 0.72)
- Race & ethnicity
- White 33% Black 29% Hispanic / Latino 29% Two or more races 16% Asian 3% Native American 2%
- Hispanic origin (detail)
- Mexican 16% Puerto Rican 5% Dominican 2%
- Common ancestry
- Romanian 3% Slovak 1%
- Foreign-born
- 17% · Canada, Jamaica, South Korea
- Languages at home
- 71% English-only · Spanish 22% Other Indo-European 2% Russian/Polish/Slavic 1%
Political lean MEDSL · Montgomery
- 2024 margin
- Strong D (+22.8) · D 60.9% · R 38.1% · Other 1.1%
- 2008→2024 swing
- +2.0pp toward D · 2008: 20.8pp · 2024: 22.8pp
- All cycles
- 2024: D+22.8 2020: D+26.3 2016: D+21.1 2012: D+14.3 2008: D+20.8
Not yet ingested
- Civics
- —
Market trends
- HPI YoY
- ▼ -203.75%
- Current HPI
- 301.7748
- Rent YoY
- ▲ 1.29%
- Metro
- Philadelphia-Camden-Wilmington, PA-NJ-DE-MD
- State GDP YoY
- ▲ 1.68%
- F500 in state
- 34
Industry mix (Fortune 500 HQ in PA)
| Industry | F500 HQs | Revenue |
|---|---|---|
| Healthcare | 2 | $309B |
|
||
| Insurance | 2 | $27B |
|
||
| Telecommunications / Media | 1 | $124B |
|
||
| Industrial Distribution | 1 | $22B |
|
||
| Financial Services | 1 | $20B |
|
||
| Chemicals / Materials | 1 | $18B |
|
||
Price history
+660.4% since first listed10 events — show timeline
- 2026-05-08 Price Changed $365,000 BRIGHT MLS
- 2026-01-31 Listed $389,000 BRIGHT MLS
- 2022-08-19 Sold (Public Records) $202,400 Public Records
- 2022-04-06 Sold (Public Records) $190,000 Public Records
- 2019-11-27 Listing Removed — BRIGHT MLS
- 2019-11-12 Listed $149,900 BRIGHT MLS
- 2003-04-11 Sold (Public Records) $110,000 Public Records
- 1990-09-12 Sold (Public Records) $115,000 Public Records
- 1988-01-28 Sold (Public Records) $80,500 Public Records
- 1983-09-26 Sold (Public Records) $48,000 Public Records
Property tax history
+2.6%/yrLatest (2026): $5,164 · +2.3% YoY. Source: county tax records.
Cash-flow waterfall
monthlySold comps — $/sqft
last 12 mo · ≤1 miLoading sold comps…