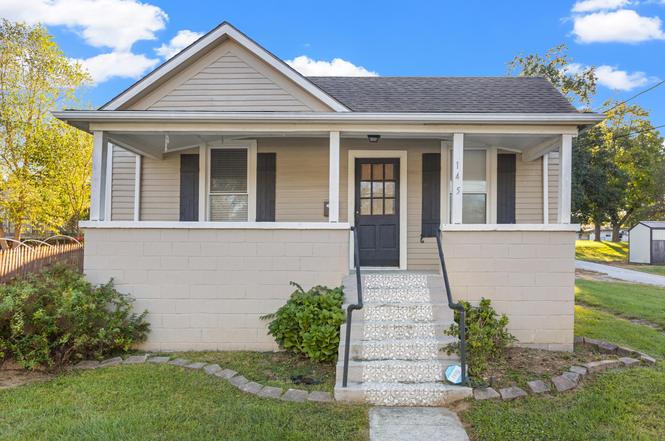
145 Myrtle Ave · Frankfort, KY
Flood risk 1/10 · Minimal
- FEMA flood zone
- X (unshaded)
- Chance of flooding over 30 yrs
- 0.0%
- Est. flood insurance / yr
- $507 – $1,088
Fire risk 2/10 · Minimal
- Est. fire insurance / yr
- $839 – $1,559
Heat risk 4/10 · Minor
- Hot days now (above 102°F)
- 7 days/yr
- Hot days in 30 yrs
- 19 days/yr
Wind risk 2/10 · Minimal
- Chance of severe wind over 30 yrs
- 1.0%
Air-quality risk 2/10 · Minimal
- Unhealthy air days now
- 1 days/yr
- Unhealthy air days in 30 yrs
- 1 days/yr
Risk factors via First Street. Map © Google.
Why this score? — see what drove the B- grade
The composite is a weighted blend of 9 inputs, each scored 0–100. Each bar is that input's sub-score; the figure is the points it added to the 100-point composite (weight × sub-score).
- Cash flow +26.4/30.0
- ARV discount +15.0/15.0
- DSCR +9.0/10.0
- 1% rule +6.3/10.0
- Rent growth +4.1/5.0
- Livability +3.7/5.0
- Schools +2.7/10.0
- Condition / age +2.5/5.0
- Appreciation +0.0/10.0
$95,000
🖨 Deal sheet (PDF) 📄 Offer letter ✓ Due diligence
Listing remarks
Welcome to 145 Myrtle Ave. ! Set on a spacious corner lot, this home offers a full-length front porch for relaxing afternoons. Inside, renovations are underway with new flooring and updated light fixtures. The layout provides flexible options - start with a potential bedroom or living area at the front, with another attached room for more possibilities. Continue to the second bedroom, utility room, and full bath. Toward the back, a generous kitchen awaits your finishing touches, and pull-down attic stairs hint at additional living space potential. Step outside to the back of the property to find a covered storage area, an attached shed and a fully fenced in backyard featuring privacy fence,
Key facts
- Generous kitchen
- Flexible layout
- Covered storage area
Tags
Neighborhood map
What this means for you Summary
Snapshot
- This is a 2-bed/1.0-bath single-family listed at $95k.
Deal economics
- At list price, monthly cash flow is $249 ($3k/yr) — positive.
- The deal already cash-flows at list — no discount required.
- Meets the 1% rule at list price ($1k rent vs $95k).
- Cap rate 9.4% vs local median 3.3% in Frankfort — top-decile yield for the area; either an underpriced asset or a hidden risk that comps aren't pricing in. Stress-test before assuming the spread holds.
Location & tenants
- Location reads 74/100 on livability (#111 in KY, #4,772 nationally) — a middle-class / working-renter tenant base. Strengths: cost of living A+, housing A+, crime B; Watch: employment C-, amenities F, health & safety F.
- Franklin County (town): math 25% / reading 37% proficiency, ranked #89 of 165 in KY (top 54%) — families likely to look elsewhere, expect single-tenant / working-renter base with shorter leases.
- Zoned schools: Elkhorn Elementary School (math 24% / reading 37%, grade F, #384 of 676 statewide, top 57%, 396 students, 75% FRL); Elkhorn Middle School (math 17% / reading 33%, grade F, #184 of 217 statewide, top 87%, 737 students, 60% FRL); Franklin County High School (math 27% / reading 37%, grade F, #97 of 254 statewide, top 46%, 960 students, 48% FRL).
- Market conditions: Rents rising fast (+6.5%/yr); 306 active listings in the ZIP; 4 comparable units currently listed for rent nearby; rentals lingering (median 45d on market — plan ~5-8 weeks vacancy on turnover, expect pricing pressure); 75% of comp listings sitting > 30 days — soft ceiling on asking rent; 123 units permitted in Franklin County in 2024 (0 in 5+ unit buildings).
Forward outlook
- Local home prices are declining (-3.0%/yr); year-one equity from $657 of loan paydown is wiped out by about $3k of value loss. Plan a longer hold.
- Franklin County population projected at +7% by 2050 — modest demand growth; plan on rents tracking national, not racing it.
- At projected returns (-3.0% appreciation + 6.5% rent growth), your $27k cash investment doubles in ~8 years — after that, you're playing with house money.
Negotiation context
- Only 10 days on market — expect competitive offers; lowballing is unlikely to land.
- Current owner paid $35k; list at $95k implies a 171% gain — meaningful room to come down on a strong offer.
Questions for the listing agent
- Is there a deadline driving the sale (1031 exchange, divorce, estate, relocation)? That informs how much negotiation room exists.
- Schools are D-rated, which usually means shorter tenancies and higher turnover. Who's the typical renter profile here, and what's been the actual vacancy rate?
- What's the average days-on-market for RENTAL listings here right now (not sales)? A rising rental-DOM trend means longer vacancies and softer asking-rent achievability than the comps imply.
- What's the recent tenant-quality profile in this submarket — average credit score on applications, eviction rate, late-payment / NSF rate, and stable-employment percentage? A property-management company in the area should have these aggregated.
- How much new for-sale + rental construction is in the pipeline within 1–3 miles? Heavy new supply typically softens prices + rents 12–24 months out; constrained supply supports both.
Investment metrics
- 1% rule
- 1.13% ✓
- Cap rate
- 9.44%
- Cash-on-cash
- 11.23%
- DSCR
- 1.50
- GRM
- 7.3
CMA / ARV
- ARV (on-the-fly)
- $189,140
- Comps found
- 12
Show comp detail 12 sales within ~0.75 mi
| Address | Dist | Beds/Ba | Sqft | Sold | Price | $/sf | Match |
|---|---|---|---|---|---|---|---|
| 110 Rancho Ct | 0.11mi | 3/1.0 (+1) | 1,026 (+5%) | 2mo | $230,000 | $224 | 81 |
| 156 Winding Way Dr | 0.31mi | 3/1.0 (+1) | 1,000 (+2%) | 2mo | $215,000 | $215 | 76 |
| 122 Linden Ave | 0.30mi | 2/1.0 | 1,042 (+6%) | 2mo | $205,000 | $197 | 73 |
| 121 Meredith Ave | 0.10mi | 2/2.0 | 1,040 (+6%) | 10mo | $216,000 | $208 | 73 |
| 158 Rolling Acres Dr | 0.17mi | 2/1.0 | 900 (-8%) | 12mo | $159,900 | $178 | 68 |
| 137 Allnutt Dr | 0.43mi | 2/1.0 | 936 (-4%) | 8mo | $165,000 | $176 | 66 |
| 103 Valley View Dr | 0.60mi | 2/1.0 | 1,001 (+2%) | 8mo | $190,000 | $190 | 62 |
| 248 Rancho Dr | 0.26mi | 3/1.0 (+1) | 1,088 (+11%) | 6mo | $178,000 | $164 | 59 |
| 105 Maple Ave | 0.32mi | 2/1.0 | 858 (-12%) | 9mo | $90,000 | $105 | 57 |
| 129 Sunset Dr | 0.67mi | 2/1.0 | 904 (-8%) | 7mo | $174,500 | $193 | 50 |
| 865 Hillwood Ave | 0.35mi | 1/1.0 (-1) | 865 (-12%) | 11mo | $130,000 | $150 | 50 |
| 154 Sunset Dr | 0.69mi | 3/1.0 (+1) | 1,069 (+9%) | 1mo | $212,900 | $199 | 47 |
Match score weights: distance 35% · size 25% · config 20% · recency 20%. Top-matched comps best support the ARV.
Projected returns pro-forma
-3.0% appreciation · 6.55% rent growth · sell at horizon
- IRR
- 4.2%
- Equity multiple
- 1.17×
- Total profit
- $4,430
- Equity at exit
- $14,165
- IRR
- 16.6%
- Equity multiple
- 2.57×
- Total profit
- $41,806
- Equity at exit
- $8,214
Cash invested: $26,600 (down + closing). Projections, not guarantees.
Landlord ↔ Tenant lean methodology
- Overall (STATE)
- 83 Strongly Landlord-Friendly
- State Kentucky
- 83 Strongly Landlord-Friendly · R+16
- County
- — inherits STATE
- City
- — inherits STATE
ZIP-level market 40601
- Home prices YoY
- -26.1%
- Rents YoY
- 6.5%
- Active inventory
- 306
- Price-to-rent
- 7.3×
Monthly cashflow live
- Estimated rent
- $1,078 medium interval (Pro) →
- Mortgage (P&I)
- −$498
- Tax from tax record
- −$65 /mo · $779/yr
- Insurance
- −$40
- HOA
- −$0
- Vacancy / Maint / Mgmt
- −$226
- Net cashflow
- $249
Break-even live
Sensitivity live
| Price | -10% $303 | -5% $276 | +0% $249 | +5% $222 | +10% $195 |
|---|---|---|---|---|---|
| Rent | -10% $164 | -5% $206 | +0% $249 | +5% $291 | +10% $334 |
| Rate | -1.0pp $297 | -0.5pp $273 | base $249 | +0.5pp $224 | +1.0pp $199 |
UW: 25.0% down · 7.5% · 30yr · 1.5% tax · 5.0% vac · 8.0% maint · 8.0% mgmt
Financing live
Cash to close
- Down payment
- $23,750
- Closing costs
- $2,850
- Reserves months
- —
- Total cash needed
- —
Loan-product check · same deal, 3 products live
Conventional
25% down · 7.5% · 30yr
- Down + closing
- —
- Monthly P&I
- —
- Monthly cashflow
- —
- DSCR
- —
- Eligible?
- —
Personal DTI + credit; lowest rate.
DSCR
20% down · 8.5% · 30yr
- Down + closing
- —
- Monthly P&I
- —
- Monthly cashflow
- —
- DSCR
- —
- Eligible?
- —
No personal income docs; deal must DSCR.
Hard money
10% down · 12.0% · 12mo
- Down + closing
- —
- Monthly P&I
- —
- Monthly cashflow
- —
- DSCR
- —
- Eligible?
- —
Short-term bridge; refi at stabilization.
Rent comps 4 comps
| Address | Beds | Baths | Sqft | Rent | $/sqft | DOM | Units | Dist |
|---|---|---|---|---|---|---|---|---|
| 565 Schenkel Ln Frankfort, KY | 2.0–3.0 | 1.0–2.0 | 987 | $877 | $0.89 | 15d | 8 | 0.75mi |
| 315 Bypass Plaza Dr Frankfort, KY | 2.0–3.0 | 1.0–2.0 | 825 | $1,049 | $1.27 | 45d | 2 | 1.16mi |
| 720 Ridgeview Dr Frankfort, KY | 2.0 | 1.0–2.0 | 576 | $1,170 | $2.03 | 45d | 11 | 1.28mi |
| 101 Compton Dr Frankfort, KY | 2.0 | 1.0 | 500 | $930 | $1.86 | 45d | 9 | 1.45mi |
Listing history 6 events
-
2024-11-23status Pending
-
2024-11-13$95,000 Active
-
2024-08-07soldstatus $35,000
-
2021-09-03soldstatus $65,000
-
2000-04-10soldstatus $38,000
-
1999-08-23soldstatus $85,000
ⓘ Source: listings_history table (triggers on properties + properties_extension) + one-shot
backfill from property_details.listing_events for pre-trigger history.
Tax reassessment forecast KY · Resets to sale price
- Current annual tax
- $779 · $65/mo
- Projected year-2 tax
- $817 · $68/mo
- Expected delta
- +$38/yr (+$3/mo · 4.9%)
ⓘ Screening estimate from a state-policy table — verify with the county assessor before closing.
Climate risk First Street
- Flood 1/10 Low FEMA zone X (unshaded) · 0% chance over 30 yrs
- Wildfire 2/10 Low
- Heat 4/10 Moderate 7 d/yr ≥102°F today · 19 d/yr by 30 yrs out
- Wind 2/10 Low 100% chance of damaging wind over 30 yrs
- Air quality 2/10 Low 1 unhealthy d/yr today · 1 by 30 yrs out
Nearby sold comps map
Loading sold comps map…
Walkable amenities ~0.75 mi
Loading nearby amenities…
Taxation est. · year 1
- Rental income
- $12,935
- − Mortgage interest
- −$5,321
- − Property taxes
- −$779
- − Insurance
- −$475
- − Repairs & maintenance
- −$1,035
- − Management
- −$1,035
- − Depreciation
- −$2,764
- Taxable income
- $1,527
- Est. tax owed @ 24.0%
- −$366
- After-tax cash flow
- $2,621/yr
For passive investors: Depreciation is non-cash, so a rental often shows a tax loss while cash-flowing — sheltering income. Rental losses are passive: they offset passive income freely, and up to $25,000/yr can offset ordinary (W-2) income if you actively participate and your MAGI is under $100k (phasing out to $0 by $150k); unused losses carry forward. On sale, claimed depreciation is recaptured at up to 25%, and gains may owe capital-gains tax (a 1031 exchange can defer both). Figures are a year-1 estimate at your 24.0% rate — not tax advice; consult a CPA.
Schools (NCES district)
- District
- Franklin County
- NCES district ID
- 2102010
- Math proficiency
- 25% ▼ -15.00%
- Reading proficiency
- 37% ▼ -14.00%
- Median HH income
- $50,879
- Composite
- 27.07/100
- National rank
- #7049
- State rank
- #89 of 165 in KY
Livability — Frankfort
- Score
- 74/100
- State rank
- #111
- US rank
- #4772
Category grades
Schools grade is shown separately in the Schools card above.
Census & demographics
- Census place
- Frankfort, KY
- County
- Franklin County · 51,893 people
- City population
- 51,893
- Metro
- Frankfort, KY
- Population (ZIP)
- 51,893
- Household income
- $65,732
- Rent vs Own
- Severe rent burden
- 1621.0
Population outlook (Franklin County) Hauer SSP2
- Today (2025)
- 52,996 people
- By 2030
- 54,049 · +2.0%
- By 2040
- 55,561 · +4.8%
- By 2050
- 56,677 · +6.9%
- By 2075
- 59,458 · +12.2%
- By 2100
- 58,885 · +11.1%
Race, ethnicity, and origin ACS 2023
- Neighborhood character
- Predominantly White (81%)
- Race & ethnicity
- White 81% Black 9% Two or more races 5% Hispanic / Latino 4% Asian 2%
- Common ancestry
- Italian 3% Slovak 2% Lithuanian 1%
- Foreign-born
- 4% · Canada
- Languages at home
- 94% English-only · Spanish 3% Other Asian/Pacific 1% Tagalog/Filipino 1%
Political lean MEDSL · Franklin
- 2024 margin
- Toss-up / Even · D 46.6% · R 51.4% · Other 2.0%
- 2008→2024 swing
- -4.2pp toward R · 2008: -0.6pp · 2024: -4.8pp
- All cycles
- 2024: R+4.8 2020: R+0.9 2016: R+4.6 2012: D+0.8 2008: R+0.6
Not yet ingested
- Civics
- —
Market trends
- HPI YoY
- ▼ -87.43%
- Current HPI
- 248.0324
- Rent YoY
- ▲ 6.55%
- Metro
- Frankfort, KY
- State GDP YoY
- ▲ 1.81%
- F500 in state
- 4
Industry mix (Fortune 500 HQ in KY)
| Industry | F500 HQs | Revenue |
|---|---|---|
| Healthcare | 1 | $118B |
|
||
| Food / Beverage | 1 | $7B |
|
||
Price history
+11.8% since first listed6 events — show timeline
- 2024-11-23 Pending — ImagineMLS
- 2024-11-13 Listed $95,000 ImagineMLS
- 2024-08-07 Sold (Public Records) $35,000 Public Records
- 2021-09-03 Sold (Public Records) $65,000 Public Records
- 2000-04-10 Sold (Public Records) $38,000 Public Records
- 1999-08-23 Sold (Public Records) $85,000 Public Records
Property tax history
+3.1%/yrLatest (2025): $779 · +1.3% YoY. Source: county tax records.
Cash-flow waterfall
monthlySold comps — $/sqft
last 12 mo · ≤1 miLoading sold comps…