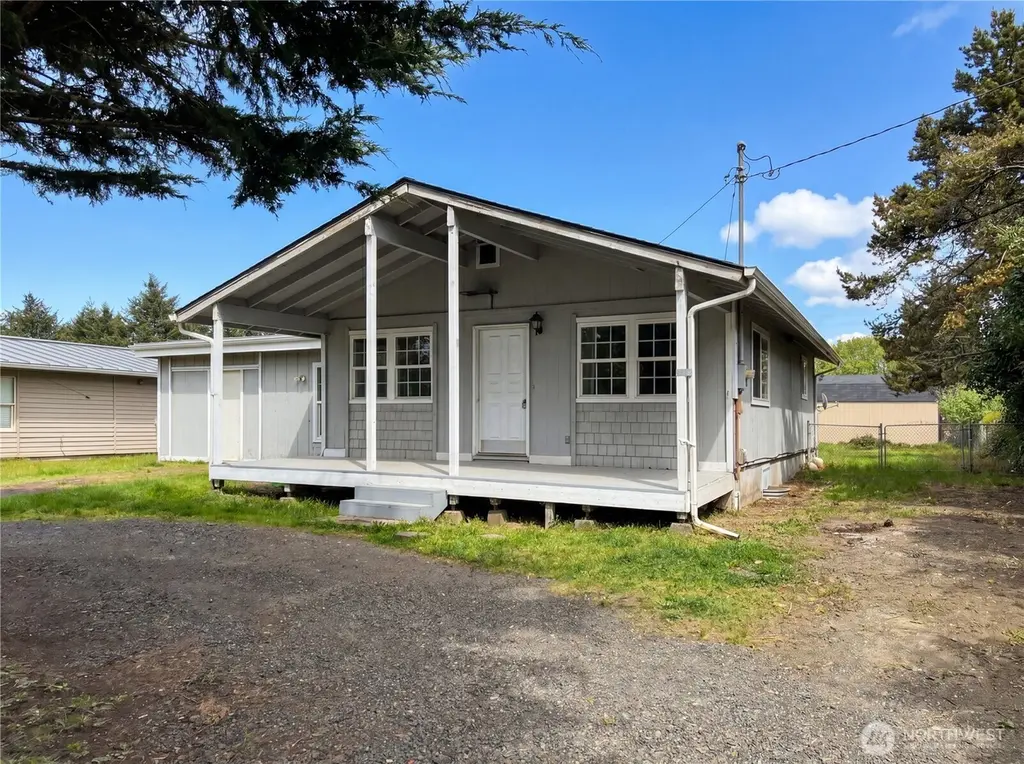
494 Inlet Ave NW · Ocean Shores, WA
Flood risk 1/10 · Minimal
- FEMA flood zone
- X (unshaded)
- Chance of flooding over 30 yrs
- 0.0%
- Est. flood insurance / yr
- $507 – $1,088
Fire risk 1/10 · Minimal
- Est. fire insurance / yr
- $604 – $1,122
Heat risk 1/10 · Minimal
- Hot days now (above 72°F)
- 7 days/yr
- Hot days in 30 yrs
- 17 days/yr
Wind risk 1/10 · Minimal
- Chance of severe wind over 30 yrs
- —
Air-quality risk 5/10 · Moderate
- Unhealthy air days now
- 6 days/yr
- Unhealthy air days in 30 yrs
- 6 days/yr
Risk factors via First Street. Map © Google.
Why this score? — see what drove the D grade
The composite is a weighted blend of 9 inputs, each scored 0–100. Each bar is that input's sub-score; the figure is the points it added to the 100-point composite (weight × sub-score).
- ARV discount +15.0/15.0
- Cash flow +11.2/30.0
- Schools +3.4/10.0
- DSCR +3.3/10.0
- Livability +3.1/5.0
- Rent growth +2.5/5.0
- Condition / age +2.5/5.0
- 1% rule +2.3/10.0
- Appreciation +0.0/10.0
$260,000
🖨 Deal sheet (PDF) 📄 Offer letter ✓ Due diligence
Listing remarks
Step into 494 Inlet Ave NW, a property enhanced by recent updates including fresh interior paint and a partial flooring replacement, creating a refreshed atmosphere. The functional exterior space includes a storage shed for added utility, complemented by a fully fenced in backyard that defines the outdoor area. This blend provides a comfortable and practical environment. Freshly updated and perfectly equipped for comfortable living.
Key facts
- Storage shed
- 7,700 sq ft lot
- Built 1975
Tags
Property features AI
Finance
- Financial info: Accepts Conventional, FHA, and VA financing
Exterior
- Parking: Driveway
- Utilities: Electric service; Public water; Sewer connected
- Home design: Single-family residence; Detached house; One story
- Construction: Wood construction; Composition roof; Torch down roof
- Exterior features: Wood exterior
Interior
- Bedrooms: 3 bedrooms (all on the main level)
- Bathrooms: 2 full bathrooms; 2 bathtubs
- Heating & cooling: Baseboard heating; No air conditioning
- Interior features: Baseboard heating; No cooling
Neighborhood map
What this means for you Summary
Snapshot
- This is a 3-bed/2.0-bath single-family listed at $260k.
Deal economics
- At list price, monthly cash flow is $-102 ($-1k/yr) — negative.
- To cash-flow at today's rent, offer at most $242k (6.9% below list).
- To meet the 1% rule (rent ≥ 1% of price), the offer needs to be $189k (27.5% below list).
- Recommended offer: $189k (27.5% below list) — sets the bar for 1% rule.
- Cap rate 5.8% vs local median 3.1% in Ocean Shores — top-decile yield for the area; either an underpriced asset or a hidden risk that comps aren't pricing in. Stress-test before assuming the spread holds.
Location & tenants
- Location reads 62/100 on livability (#424 in WA) — a middle-class / working-renter tenant base. Strengths: housing A; Watch: crime C-, health & safety C-, amenities F.
- North Beach School District (rural): math 32% / reading 44% proficiency, ranked #236 of 291 in WA (top 81%) — families likely to look elsewhere, expect single-tenant / working-renter base with shorter leases; 63% free/reduced lunch — lower-income household profile, screen leases tightly.
- Zoned schools: Ocean Shores Elementary (240 students, 76% FRL); North Beach Junior High School (162 students, 78% FRL); North Beach Senior High School (177 students, 63% FRL).
- Market conditions: 653 active listings in the ZIP; 1 comparable units currently listed for rent nearby; 297 units permitted in Grays Harbor County in 2024 (17 in 5+ unit buildings).
- This rent runs 39% of the median local income ($58k/yr) — at the standard rent-burdened threshold; future hikes will face affordability resistance.
Forward outlook
- Local home prices are declining (-3.0%/yr); year-one equity from $2k of loan paydown is wiped out by about $8k of value loss. Plan a longer hold.
- Grays Harbor County population projected at -24% by 2050 — secular population decline; favor cash flow + early exit over multi-decade hold.
Negotiation context
- It's been on market 35 days — a 3% lower offer ($252k) is reasonable based on typical stale-listing flexibility.
- 3 sale attempts since 22y ago; this cycle's ask has dropped $20k (7%) from the opening price — seller is motivated, your offer sets the floor, not the list.
Questions for the listing agent
- What do current leases actually rent for vs. the listed asking? Can we see a recent rent roll and the last 12 months of T-12 income?
- It's been on market 35 days. Have you received any prior offers? Is the seller open to a 27% concession, seller financing, or rate buy-down credit?
- Built in 1975 — when were the roof, HVAC, electrical panel, plumbing, and water heater last replaced?
- Is there a deadline driving the sale (1031 exchange, divorce, estate, relocation)? That informs how much negotiation room exists.
- The area grade is low — what's the realistic commute time and amenity access for the typical tenant pool here? Any planned neighborhood developments (good or bad) we should know about?
- What's the average days-on-market for RENTAL listings here right now (not sales)? A rising rental-DOM trend means longer vacancies and softer asking-rent achievability than the comps imply.
- What's the recent tenant-quality profile in this submarket — average credit score on applications, eviction rate, late-payment / NSF rate, and stable-employment percentage? A property-management company in the area should have these aggregated.
- How much new for-sale + rental construction is in the pipeline within 1–3 miles? Heavy new supply typically softens prices + rents 12–24 months out; constrained supply supports both.
Investment metrics
- 1% rule
- 0.73% ✗
- Cap rate
- 5.82%
- Cash-on-cash
- -1.68%
- DSCR
- 0.93
- GRM
- 11.5
CMA / ARV
- ARV (median comp)
- $368,971
- List price
- $260,000
- Delta
- -29.53%
- Verdict
- UNDERPRICED
- Comps
- 20 within 1.0 mi
Show comp detail 12 sales within ~0.75 mi
| Address | Dist | Beds/Ba | Sqft | Sold | Price | $/sf | Match |
|---|---|---|---|---|---|---|---|
| 554 Ocean Shores Blvd NW | 0.15mi | 2/2.0 (-1) | 1,266 (-5%) | 1mo | $370,800 | $293 | 79 |
| 506 Point Brown Ave NE | 0.24mi | 3/2.0 | 1,423 (+7%) | 5mo | $335,000 | $235 | 73 |
| 492 Ensign Ave NW | 0.19mi | 2/2.0 (-1) | 1,496 (+13%) | 3mo | $350,000 | $234 | 63 |
| 546 canal Dr NE | 0.38mi | 2/2.0 (-1) | 1,248 (-6%) | 8mo | $320,000 | $256 | 61 |
| 198 Clover St NW | 0.55mi | 2/2.0 (-1) | 1,352 (+2%) | 7mo | $330,000 | $244 | 60 |
| 262 Octopus Ave NE | 0.69mi | 2/2.0 (-1) | 1,335 (+0%) | 4mo | $429,000 | $321 | 59 |
| 618 Woodland Loop NE | 0.66mi | 3/2.0 | 1,400 (+5%) | 4mo | $310,000 | $221 | 56 |
| 490 Dolphin Ave NE | 0.52mi | 3/1.5 | 1,456 (+10%) | 4mo | $439,000 | $302 | 54 |
| 611 Weatherwax Loop NE | 0.68mi | 2/2.0 (-1) | 1,159 (-13%) | 1mo | $379,900 | $328 | 42 |
| 304 Ocean Shores Blvd NW | 0.54mi | 2/2.0 (-1) | 1,134 (-15%) | 6mo | $350,000 | $309 | 40 |
| 213 Canal Dr NE | 0.68mi | 2/1.0 (-1) | 1,474 (+11%) | 3mo | $376,500 | $255 | 38 |
| 445 Bass Ave NE | 0.61mi | 2/2.0 (-1) | 1,525 (+15%) | 7mo | $367,500 | $241 | 36 |
Match score weights: distance 35% · size 25% · config 20% · recency 20%. Top-matched comps best support the ARV.
Projected returns pro-forma
-3.0% appreciation · 3.0% rent growth · sell at horizon
- IRR
- -19.1%
- Equity multiple
- 0.33×
- Total profit
- $-48,728
- Equity at exit
- $38,767
- IRR
- -11.8%
- Equity multiple
- 0.30×
- Total profit
- $-51,196
- Equity at exit
- $22,480
Cash invested: $72,800 (down + closing). Projections, not guarantees.
Landlord ↔ Tenant lean methodology
- Overall (STATE)
- 28 Tenant-Leaning
- State Washington
- 28 Tenant-Leaning · D+8
- County
- — inherits STATE
- City
- — inherits STATE
ZIP-level market 98569
- Home prices YoY
- -3.4%
- Active inventory
- 653
- Price-to-rent
- 11.5×
Monthly cashflow live
- Estimated rent
- $1,885 medium interval (Pro) →
- Mortgage (P&I)
- −$1,363
- Tax from tax record
- −$120 /mo · $1,436/yr
- Insurance
- −$108
- HOA
- −$0
- Vacancy / Maint / Mgmt
- −$396
- Net cashflow
- $-102
Break-even live
Sensitivity live
| Price | -10% $45 | -5% $-28 | +0% $-102 | +5% $-176 | +10% $-249 |
|---|---|---|---|---|---|
| Rent | -10% $-251 | -5% $-177 | +0% $-102 | +5% $-28 | +10% $47 |
| Rate | -1.0pp $29 | -0.5pp $-36 | base $-102 | +0.5pp $-169 | +1.0pp $-238 |
UW: 25.0% down · 7.5% · 30yr · 1.5% tax · 5.0% vac · 8.0% maint · 8.0% mgmt
Financing live
Cash to close
- Down payment
- $65,000
- Closing costs
- $7,800
- Reserves months
- —
- Total cash needed
- —
Loan-product check · same deal, 3 products live
Conventional
25% down · 7.5% · 30yr
- Down + closing
- —
- Monthly P&I
- —
- Monthly cashflow
- —
- DSCR
- —
- Eligible?
- —
Personal DTI + credit; lowest rate.
DSCR
20% down · 8.5% · 30yr
- Down + closing
- —
- Monthly P&I
- —
- Monthly cashflow
- —
- DSCR
- —
- Eligible?
- —
No personal income docs; deal must DSCR.
Hard money
10% down · 12.0% · 12mo
- Down + closing
- —
- Monthly P&I
- —
- Monthly cashflow
- —
- DSCR
- —
- Eligible?
- —
Short-term bridge; refi at stabilization.
Rent comps 1 comps
| Address | Beds | Baths | Sqft | Rent | $/sqft | DOM | Units | Dist |
|---|---|---|---|---|---|---|---|---|
| 569 Sunset Ave NE Unit A Ocean Shores, WA | 2.0 | 1.5 | 1001 | $1,500 | $1.50 | 45d | 1 | 0.55mi |
Listing history 26 events
-
2026-06-19days on market $260,000 Active 35 DOM
-
2026-06-18days on market $260,000 Active 34 DOM
-
2026-06-17days on market $260,000 Active 33 DOM
-
2026-06-16days on market $260,000 Active 32 DOM
-
2026-06-15days on market $260,000 Active 31 DOM
-
2026-06-14days on market $260,000 Active 29 DOM
-
2026-06-12pricedays on market $260,000 Active 28 DOM
-
2026-06-09days on market $277,000 Active 25 DOM
-
2026-06-08days on market $277,000 Active 24 DOM
-
2026-06-07days on market $277,000 Active 23 DOM
-
2026-06-05days on market $277,000 Active 20 DOM
-
2026-06-03days on market $277,000 Active 19 DOM
-
2026-06-02days on market $277,000 Active 18 DOM
-
2026-06-01days on market $277,000 Active 17 DOM
-
2026-05-31days on market $277,000 Active 16 DOM
-
2026-05-30days on market $277,000 Active 15 DOM
-
2026-05-15$280,000 Active
-
2016-09-08soldstatus $129,500 Sold
-
2016-09-08soldstatus $129,500
-
2016-08-24status Pending
-
2016-08-06status Pending Inspection
-
2016-03-29$129,500 Active
-
2005-01-31soldstatus $78,800
-
2005-01-31soldstatus $78,800
-
2004-12-13$75,000
-
2000-09-21soldstatus $64,000
ⓘ Source: listings_history table (triggers on properties + properties_extension) + one-shot
backfill from property_details.listing_events for pre-trigger history.
Tax reassessment forecast WA · Resets to sale price
- Current annual tax
- $1,436 · $120/mo
- Projected year-2 tax
- $2,548 · $212/mo
- Expected delta
- +$1,112/yr (+$93/mo · 77.5%)
ⓘ Screening estimate from a state-policy table — verify with the county assessor before closing.
Climate risk First Street
- Flood 1/10 Low FEMA zone X (unshaded) · 0% chance over 30 yrs
- Wildfire 1/10 Low
- Heat 1/10 Low 7 d/yr ≥72°F today · 17 d/yr by 30 yrs out
- Wind 1/10 Low
- Air quality 5/10 Major 6 unhealthy d/yr today · 6 by 30 yrs out
Nearby sold comps map
Loading sold comps map…
Walkable amenities ~0.75 mi
Loading nearby amenities…
Taxation est. · year 1
- Rental income
- $22,624
- − Mortgage interest
- −$14,564
- − Property taxes
- −$1,436
- − Insurance
- −$1,300
- − Repairs & maintenance
- −$1,810
- − Management
- −$1,810
- − Depreciation
- −$7,564
- Taxable loss
- −$5,859
- Est. tax savings @ 24.0%
- +$1,406
- After-tax cash flow
- $182/yr
For passive investors: Depreciation is non-cash, so a rental often shows a tax loss while cash-flowing — sheltering income. Rental losses are passive: they offset passive income freely, and up to $25,000/yr can offset ordinary (W-2) income if you actively participate and your MAGI is under $100k (phasing out to $0 by $150k); unused losses carry forward. On sale, claimed depreciation is recaptured at up to 25%, and gains may owe capital-gains tax (a 1031 exchange can defer both). Figures are a year-1 estimate at your 24.0% rate — not tax advice; consult a CPA.
Schools (NCES district)
- District
- North Beach School District
- NCES district ID
- 5305700
- Math proficiency
- 32% ▼ -4.00%
- Reading proficiency
- 44% ▬ 0.00%
- Median HH income
- $40,966
- Composite
- 34.46/100
- National rank
- #10153
- State rank
- #236 of 291 in WA
Livability — Ocean Shores
- Score
- 62/100
- State rank
- #424
- US rank
- #16852
Category grades
Schools grade is shown separately in the Schools card above.
Census & demographics
- Census place
- Ocean Shores, WA
- County
- Grays Harbor County · 44,693 people
- City population
- 7,187
- Metro
- Aberdeen, WA
- Population (ZIP)
- 7,489
- Household income
- $58,378
- Rent vs Own
- Severe rent burden
- 172.0
Population outlook (Grays Harbor County) Hauer SSP2
- Today (2025)
- 66,443 people
- By 2030
- 63,255 · -4.8%
- By 2040
- 56,466 · -15.0%
- By 2050
- 50,516 · -24.0%
- By 2075
- 39,296 · -40.9%
- By 2100
- 31,142 · -53.1%
Race, ethnicity, and origin ACS 2023
- Neighborhood character
- Predominantly White (86%)
- Race & ethnicity
- White 86% Two or more races 5% Hispanic / Latino 4% Asian 3% Native American 3%
- Common ancestry
- Portuguese 8% Iranian 5% Lithuanian 4%
- Foreign-born
- 5% · Canada
- Languages at home
- 92% English-only · Spanish 3% Tagalog/Filipino 2% German/W. Germanic 2%
Political lean MEDSL · Grays Harbor
- 2024 margin
- Lean R (+6.0) · D 45.6% · R 51.6% · Other 2.8%
- 2008→2024 swing
- -20.6pp toward R · 2008: 14.6pp · 2024: -6.0pp
- All cycles
- 2024: R+6.0 2020: R+6.6 2016: R+7.1 2012: D+14.0 2008: D+14.6
Not yet ingested
- Civics
- —
Market trends
- HPI YoY
- ▼ -13.33%
- Current HPI
- 380.05
- Rent YoY
- —
- Metro
- Aberdeen, WA
- State GDP YoY
- ▲ 4.65%
- F500 in state
- 22
Industry mix (Fortune 500 HQ in WA)
| Industry | F500 HQs | Revenue |
|---|---|---|
| Retail | 2 | $269B |
|
||
| Technology / Retail | 1 | $638B |
|
||
| Technology | 1 | $245B |
|
||
| Telecommunications | 1 | $38B |
|
||
| Food / Beverage | 1 | $36B |
|
||
| Automotive / Trucks | 1 | $34B |
|
||
Price history
+306.2% since first listed13 events — show timeline
- 2026-06-11 Price Changed $260,000 NWMLS as Distributed by MLS Grid
- 2026-05-29 Price Changed $277,000 NWMLS as Distributed by MLS Grid
- 2026-05-15 Listed $280,000 NWMLS as Distributed by MLS Grid
- 2026-04-07 Sold (Public Records) $280,370 Public Records
- 2016-09-08 Sold (Public Records) $129,500 Public Records
- 2016-09-08 Sold (MLS) $129,500 NWMLS as Distributed by MLS Grid
- 2016-08-24 Pending — NWMLS as Distributed by MLS Grid
- 2016-08-06 Pending — NWMLS as Distributed by MLS Grid
- 2016-03-29 Listed $129,500 NWMLS as Distributed by MLS Grid
- 2005-01-31 Sold (Public Records) $78,800 Public Records
- 2005-01-31 Sold (MLS) $78,800 NWMLS as Distributed by MLS Grid
- 2004-12-13 Listed $75,000 NWMLS as Distributed by MLS Grid
- 2000-09-21 Sold (Public Records) $64,000 Public Records
Property tax history
+4.6%/yrLatest (2026): $1,436 · -0.2% YoY. Source: county tax records.
Cash-flow waterfall
monthlySold comps — $/sqft
last 12 mo · ≤1 miLoading sold comps…