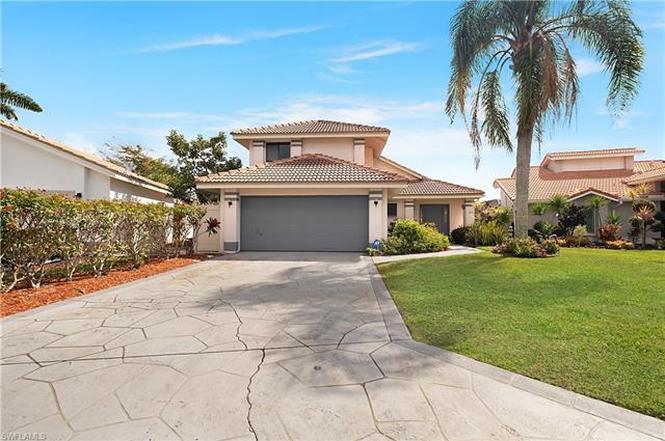
1250 Jardin Dr · Berkshire Lakes, FL
Flood risk 5/10 · Moderate
- FEMA flood zone
- X (unshaded)
- Chance of flooding over 30 yrs
- 0.24%
- Est. flood insurance / yr
- $507 – $1,088
Fire risk 1/10 · Minimal
- Est. fire insurance / yr
- $947 – $1,759
Heat risk 10/10 · Severe
- Hot days now (above 107°F)
- 7 days/yr
- Hot days in 30 yrs
- 30 days/yr
Wind risk 10/10 · Severe
- Chance of severe wind over 30 yrs
- 99.0%
Air-quality risk 2/10 · Minimal
- Unhealthy air days now
- 2 days/yr
- Unhealthy air days in 30 yrs
- 2 days/yr
Risk factors via First Street. Map © Google.
Why this score? — see what drove the F grade
The composite is a weighted blend of 9 inputs, each scored 0–100. Each bar is that input's sub-score; the figure is the points it added to the 100-point composite (weight × sub-score).
- ARV discount +7.5/15.0
- Schools +5.0/10.0
- Cash flow +4.9/30.0
- Livability +2.5/5.0
- Condition / age +2.5/5.0
- Rent growth +2.2/5.0
- 1% rule +0.4/10.0
- DSCR +0.0/10.0
- Appreciation +0.0/10.0
$499,000
🖨 Deal sheet 📄 Offer letter ✓ Due diligence
Listing remarks
Welcome to this comfortable pool home in Moon Lake where entertaining comes naturally and everyday living feels relaxed. This residence features three bedrooms and two and a half bathrooms across 1,857 square feet designed for Florida lifestyle enjoyment. The enclosed pool area creates a private retreat surrounded by protective walls and fencing, ideal for family gatherings or peaceful afternoon relaxation. Step inside to discover generous living spaces filled with natural light from multiple glass sliders that connect indoor rooms to outdoor areas throughout the home. The main living area showcases volume ceilings and easy-maintenance tile floors that flow seamlessly between spaces. A conv
Key facts
- Community pool
- Pass-through window
- Hurricane shutters
Tags
Property features AI
Finance
- Financial info: Total annual recurring HOA fees and assessments disclosed
- HOA & community: Mandatory HOA; Quarterly HOA fee; Professional management; HOA covers cable, internet/WiFi access, lawn/land maintenance, exterior pest control, recreation facilities, security, street lights, and trash removal; Community amenities include BBQ/picnic area, bike and jogging path, community pool, tennis court, and underground utilities; Non-gated community
Exterior
- Parking: Attached 2-car garage; Paved driveway
- Security: Entry keypad; Gated community
- Utilities: Central water; Central sewer; Cable available
- Home design: Residential single-family home; Two-story design; Rear exposure facing southeast; Part of Moon Lake development
- Construction: Concrete block construction; Tile roof; Built in 1989; Concrete pool
- Exterior features: Outdoor fireplace; Screened below-ground concrete pool; Stucco exterior; Single hung and sliding windows; Landscaped yard; Privacy wall; Corner lot; Irrigation (central)
Interior
- Kitchen: Range; Self-cleaning oven; Microwave; Refrigerator/freezer; Disposal
- Bedrooms: 3 bedrooms (split bedroom floor plan)
- Flooring: Carpet; Tile
- Bathrooms: 2 full bathrooms; 1 half bathroom; Master bath with dual sinks and separate tub and shower
- Heating & cooling: Central electric heat; Central electric cooling
- Interior features: Built-in cabinets; Cable prewire; High-speed internet available; Volume ceilings; Breakfast bar / dining in living; Guest bath and guest room; Screened lanai/porch
- Laundry & utility: Washer; Dryer; Laundry in residence; Automatic garage door opener
Neighborhood map
What this means for you Summary
Snapshot
- This is a 3-bed/2.5-bath single-family listed at $499k.
Deal economics
- At list price, monthly cash flow is $-1k ($-14k/yr) — negative.
- To cash-flow at today's rent, offer at most $286k (42.7% below list).
- To meet the 1% rule (rent ≥ 1% of price), the offer needs to be $269k (46.1% below list).
- Recommended offer: $269k (46.1% below list) — sets the bar for 1% rule.
Location & tenants
- Location reads: area grade F — affects rentability + tenant quality, not the cash-flow math above.
- Collier (suburban): math 60% / reading 56% proficiency, ranked #16 of 73 in FL (top 22%) — acceptable for families but not a draw, mixed tenant base, ~2y average lease.
- Market conditions: Rents soft (-1.1%/yr); 436 active listings in the ZIP; 40 comparable units currently listed for rent nearby; rentals at typical pace (median 22d on market — plan ~3-4 weeks tenant-placement turnaround); 3,520 units permitted in Collier County in 2024 (959 in 5+ unit buildings).
- At $2,691/mo this rent would consume 45% of the median local household income ($72k/yr) (locally 1423% of renters already pay >50% of income on rent) — very limited rent-growth headroom before tenants either downsize or default.
Forward outlook
- Local home prices are declining (-3.0%/yr); year-one equity from $3k of loan paydown is wiped out by about $15k of value loss. Plan a longer hold.
- Collier County population projected at +30% by 2050 — long-run rental-demand tailwind backs the buy-and-hold thesis.
Negotiation context
- It's been on market 127 days — a 12% lower offer ($439k) is reasonable based on typical stale-listing flexibility.
- 7 sale attempts since 5y ago with the ask held roughly flat each time — persistent listings suggest the price (not the market) is what's stuck; bring a comps-based counter.
- Current owner paid $410k; 22% above their basis — modest negotiation headroom, anchor on the comps not their cost.
Risks & watch-outs
- Climate carrying-cost: moderate flood risk; severe wind risk, 99% chance of damaging wind over 30y; extreme-heat days projected 7→30/yr by 2055 (HVAC capex compounding) — expect insurance premiums to compound above CPI over the hold.
Questions for the listing agent
- What do current leases actually rent for vs. the listed asking? Can we see a recent rent roll and the last 12 months of T-12 income?
- It's been on market 127 days. Have you received any prior offers? Is the seller open to a 46% concession, seller financing, or rate buy-down credit?
- What does the HOA fee cover, when was the last increase, and are there any pending special assessments or reserve-fund shortfalls?
- Why hasn't it sold? Are there any deal-killer items the seller is aware of (foundation, flood, title, zoning, code violations)?
- Is there a deadline driving the sale (1031 exchange, divorce, estate, relocation)? That informs how much negotiation room exists.
- The area grade is low — what's the realistic commute time and amenity access for the typical tenant pool here? Any planned neighborhood developments (good or bad) we should know about?
- What's the average days-on-market for RENTAL listings here right now (not sales)? A rising rental-DOM trend means longer vacancies and softer asking-rent achievability than the comps imply.
- What's the recent tenant-quality profile in this submarket — average credit score on applications, eviction rate, late-payment / NSF rate, and stable-employment percentage? A property-management company in the area should have these aggregated.
- How much new for-sale + rental construction is in the pipeline within 1–3 miles? Heavy new supply typically softens prices + rents 12–24 months out; constrained supply supports both.
Investment metrics
- 1% rule
- 0.54% ✗
- Cap rate
- 3.39%
- Cash-on-cash
- -10.37%
- DSCR
- 0.54
- GRM
- 15.5
CMA / ARV
No comps found within radius.
Projected returns pro-forma
-3.0% appreciation · 0.0% rent growth · sell at horizon
- IRR
- -38.1%
- Equity multiple
- -0.19×
- Total profit
- $-165,641
- Equity at exit
- $74,403
- IRR
- -78.6%
- Equity multiple
- -0.96×
- Total profit
- $-273,813
- Equity at exit
- $43,144
Cash invested: $139,720 (down + closing). Projections, not guarantees.
Landlord ↔ Tenant lean methodology
- Overall (STATE)
- 87 Strongly Landlord-Friendly
- State Florida
- 87 Strongly Landlord-Friendly · R+3
- County
- — inherits STATE
- City
- — inherits STATE
ZIP-level market 34104
- Rents YoY
- -1.1%
- Active inventory
- 436
- Price-to-rent
- 15.5×
Monthly cashflow live
- Estimated rent
- $2,691 high interval (Pro) →
- Mortgage (P&I)
- −$2,617
- Tax from tax record
- −$308 /mo · $3,694/yr
- Insurance
- −$208
- HOA
- −$200
- Vacancy / Maint / Mgmt
- −$565
- Net cashflow
- $-1,207
Break-even live
UW: 25.0% down · 7.5% · 30yr · 1.5% tax · 5.0% vac · 8.0% maint · 8.0% mgmt
Financing live
Cash to close
- Down payment
- $124,750
- Closing costs
- $14,970
- Reserves months
- —
- Total cash needed
- —
Loan-product check · same deal, 3 products live
Conventional
25% down · 7.5% · 30yr
- Down + closing
- —
- Monthly P&I
- —
- Monthly cashflow
- —
- DSCR
- —
- Eligible?
- —
Personal DTI + credit; lowest rate.
DSCR
20% down · 8.5% · 30yr
- Down + closing
- —
- Monthly P&I
- —
- Monthly cashflow
- —
- DSCR
- —
- Eligible?
- —
No personal income docs; deal must DSCR.
Hard money
10% down · 12.0% · 12mo
- Down + closing
- —
- Monthly P&I
- —
- Monthly cashflow
- —
- DSCR
- —
- Eligible?
- —
Short-term bridge; refi at stabilization.
Rent comps 40 comps
| Address | Beds | Baths | Sqft | Rent | $/sqft | DOM | Units | Dist |
|---|---|---|---|---|---|---|---|---|
| 5257 Whitten Dr Naples, FL | 2.0 | 2.0 | 1500 | $2,500 | $1.67 | 14d | 1 | 0.22mi |
| 1787 Reuven Cir Unit 1001 Naples, FL | 2.0 | 2.0 | 1112 | $1,300 | $1.17 | 14d | 1 | 0.23mi |
| 5301 Whitten Dr #81 Naples, FL | 3.0 | 2.0 | 1386 | $2,700 | $1.95 | 23d | 1 | 0.24mi |
| 1748 Royal Cir Naples, FL | 3.0 | 2.0 | 1451 | $3,200 | $2.21 | 23d | 1 | 0.28mi |
| 2972 Kings Lake Blvd #2972 Naples, FL | 2.0 | 2.0 | 1100 | $3,000 | $2.73 | 23d | 1 | 0.33mi |
| 1950 W Crown Pointe Blvd Unit B207 Naples, FL | 2.0 | 2.0 | 1129 | $1,950 | $1.73 | 23d | 1 | 0.35mi |
| 2050 W Crown Pointe Blvd Unit C214 Naples, FL | 3.0 | 2.0 | 1267 | $4,200 | $3.31 | 23d | 1 | 0.40mi |
| 1701 Courtyard Way Naples, FL | 2.0 | 2.0 | 1072 | $1,990 | $1.86 | 23d | 1 | 0.50mi |
| 1765 Courtyard Way Unit C-104 Naples, FL | 2.0 | 2.0 | 1132 | $2,700 | $2.39 | 14d | 1 | 0.51mi |
| 1765 Courtyard Way Unit C206 Naples, FL | 2.0 | 2.5 | 1150 | $1,650 | $1.43 | 14d | 1 | 0.51mi |
| 1820 Florida Club Cir Naples, FL | 3.0 | 2.0 | 1282 | $2,850 | $2.22 | 23d | 2 | 0.51mi |
| 1933 Courtyard Way Unit D-103 Naples, FL | 2.0 | 2.0 | 947 | $1,850 | $1.95 | 14d | 1 | 0.53mi |
| 1810 Florida Club Cir Naples, FL | 2.0 | 2.0 | 1200 | $2,075 | $1.73 | 14d | 2 | 0.53mi |
| 6700 Dennis Cir Unit A103 Naples, FL | 2.0 | 2.0 | 1308 | $2,000 | $1.53 | 14d | 1 | 0.56mi |
| 1802 Kings Lake Blvd Unit 2-101 Naples, FL | 2.0 | 2.0 | 1465 | $5,500 | $3.75 | 23d | 1 | 0.56mi |
| 141 Bristol Ln Unit C21 Naples, FL | 2.0 | 2.0 | 1400 | $5,900 | $4.21 | 23d | 1 | 0.57mi |
| 1895 Courtyard Way #103 Naples, FL | 3.0 | 2.0 | 1046 | $2,200 | $2.10 | 21d | 1 | 0.57mi |
| 1830 Florida Club Cir #4111 Naples, FL | 3.0 | 2.0 | 1189 | $2,250 | $1.89 | 21d | 1 | 0.57mi |
| 2644 Kings Lake Blvd Unit 6-103 Naples, FL | 2.0 | 2.0 | 911 | $1,875 | $2.06 | 23d | 1 | 0.57mi |
| 2648 Kings Lake Blvd Unit 6-201 Naples, FL | 3.0 | 2.0 | 1060 | $2,200 | $2.08 | 21d | 1 | 0.58mi |
| 1075 Foxfire Ln Naples, FL | 2.0 | 2.0 | 1092 | $3,300 | $3.02 | 23d | 3 | 0.58mi |
| 1840 Florida Club Cir #5309 Naples, FL | 2.0 | 1.0 | 1328 | $2,300 | $1.73 | 23d | 1 | 0.59mi |
| 1835 Florida Club Cir #3201 Naples, FL | 3.0 | 2.0 | 1375 | $2,095 | $1.52 | 14d | 1 | 0.60mi |
| 153 Bristol Ln Unit A Naples, FL | 2.0 | 2.0 | 1009 | $2,250 | $2.23 | 14d | 1 | 0.62mi |
| 153 Bristol Ln Unit F102 Naples, FL | 2.0 | 2.0 | 1009 | $4,900 | $4.86 | 23d | 1 | 0.62mi |
| 1826 Kings Lake Blvd #101 Naples, FL | 3.0 | 2.0 | 1456 | $2,700 | $1.85 | 14d | 1 | 0.63mi |
| 1808 Kings Lake Blvd #203 Naples, FL | 2.0 | 2.0 | 1312 | $1,775 | $1.35 | 14d | 1 | 0.64mi |
| 2132 Tama Cir #102 Naples, FL | 2.0 | 2.0 | 1368 | $4,000 | $2.92 | 23d | 1 | 0.68mi |
| 7065 Dennis Cir #302 Naples, FL | 2.0 | 2.0 | 1097 | $4,000 | $3.65 | 21d | 1 | 0.69mi |
| 1865 Florida Club Dr #6211 Naples, FL | 3.0 | 2.0 | 1500 | $2,000 | $1.33 | 14d | 1 | 0.71mi |
| 4210 Looking Glass Ln Unit 4210 Naples, FL | 2.0 | 2.0 | 1300 | $3,000 | $2.31 | 14d | 1 | 0.71mi |
| 1875 Florida Club Dr Naples, FL | 2.0 | 1.0 | 1016 | $1,722 | $1.69 | 23d | 2 | 0.72mi |
| 1865 Florida Club Dr Naples, FL | 2.0–3.0 | 1.0–2.0 | 1214 | $1,950 | $1.61 | 23d | 2 | 0.72mi |
| 1814 Kings Lake Blvd #204 Naples, FL | 2.0 | 2.0 | 1400 | $2,450 | $1.75 | 23d | 1 | 0.73mi |
| 4180 Looking Glass Ln Unit 4104 Naples, FL | 2.0 | 2.0 | 1246 | $4,000 | $3.21 | 14d | 1 | 0.74mi |
| 2103 Tama Cir Unit 2 Naples, FL | 2.0 | 2.0 | 1368 | $4,000 | $2.92 | 21d | 1 | 0.75mi |
| 882 Bluebird St Naples, FL | 3.0 | 2.0 | 1308 | $6,000 | $4.59 | 23d | 1 | 0.76mi |
| 6954 Avalon Cir #703 Naples, FL | 2.0 | 2.0 | 1467 | $3,000 | $2.04 | 14d | 1 | 0.77mi |
| 6954 Avalon Cir #702 Naples, FL | 2.0 | 2.0 | 1467 | $4,500 | $3.07 | 23d | 1 | 0.77mi |
| 1051 Eastham Way Unit B104 Naples, FL | 2.0 | 2.0 | 1091 | $4,300 | $3.94 | 14d | 1 | 0.80mi |
HOA detail
- Monthly dues
- $200 · $2,400/yr
- Likely covers
- pool
Listing history 32 events
-
2026-06-18days on market $499,000 Active 127 DOM
-
2026-06-17days on market $499,000 Active 126 DOM
-
2026-06-16days on market $499,000 Active 125 DOM
-
2026-06-15days on market $499,000 Active 124 DOM
-
2026-06-14days on market $499,000 Active 122 DOM
-
2026-06-10days on market $499,000 Active 119 DOM
-
2026-06-09days on market $499,000 Active 118 DOM
-
2026-06-08days on market $499,000 Active 117 DOM
-
2026-06-07days on market $499,000 Active 116 DOM
-
2026-06-03days on market $499,000 Active 112 DOM
-
2026-06-02days on market $499,000 Active 111 DOM
-
2026-06-01days on market $499,000 Active 110 DOM
-
2026-05-31days on market $499,000 Active 109 DOM
-
2026-05-30days on market $499,000 Active 108 DOM
-
2026-05-11price $499,000
-
2026-02-11$509,000 Active
-
2025-07-01historical
-
2025-03-10price $515,000
-
2025-03-04price $525,000
-
2025-01-31status Active
-
2025-01-06status Pending With Contingencies
-
2024-09-28$550,000 Active
-
2024-07-01historical
-
2024-04-01$559,000 Active
-
2022-09-15historical
-
2022-08-19status Active
-
2022-05-03status Pending With Contingencies
-
2022-04-30$559,000 Active
-
2021-06-14soldstatus $410,000
-
2021-06-10soldstatus $410,000 Sold
-
2021-04-27status Pending With Contingencies
-
2021-04-23$399,000 Active
ⓘ Source: listings_history table (triggers on properties + properties_extension) + one-shot
backfill from property_details.listing_events for pre-trigger history.
Tax reassessment forecast FL · Resets to sale price
- Current annual tax
- $3,694 · $308/mo
- Projected year-2 tax
- $4,142 · $345/mo
- Expected delta
- +$448/yr (+$37/mo · 12.1%)
ⓘ Screening estimate from a state-policy table — verify with the county assessor before closing.
Climate risk First Street
- Flood 5/10 Major FEMA zone X (unshaded) · 24% chance over 30 yrs
- Wildfire 1/10 Low
- Heat 10/10 Extreme 7 d/yr ≥107°F today · 30 d/yr by 30 yrs out
- Wind 10/10 Extreme 99% chance of damaging wind over 30 yrs
- Air quality 2/10 Low 2 unhealthy d/yr today · 2 by 30 yrs out
Nearby sold comps map
Loading sold comps map…
Walkable amenities ~0.75 mi
Loading nearby amenities…
Taxation est. · year 1
- Rental income
- $32,289
- − Mortgage interest
- −$27,952
- − Property taxes
- −$3,694
- − Insurance
- −$2,495
- − Repairs & maintenance
- −$2,583
- − Management
- −$2,583
- − HOA
- −$2,400
- − Depreciation
- −$14,516
- Taxable loss
- −$23,934
- Est. tax savings @ 24.0%
- +$5,744
- After-tax cash flow
- $-8,738/yr
For passive investors: Depreciation is non-cash, so a rental often shows a tax loss while cash-flowing — sheltering income. Rental losses are passive: they offset passive income freely, and up to $25,000/yr can offset ordinary (W-2) income if you actively participate and your MAGI is under $100k (phasing out to $0 by $150k); unused losses carry forward. On sale, claimed depreciation is recaptured at up to 25%, and gains may owe capital-gains tax (a 1031 exchange can defer both). Figures are a year-1 estimate at your 24.0% rate — not tax advice; consult a CPA.
Schools (NCES district)
- District
- Collier
- NCES district ID
- 1200330
- Math proficiency
- 60% ▼ -4.00%
- Reading proficiency
- 56% ▼ -2.00%
- Median HH income
- $58,275
- Composite
- 50.23/100
- National rank
- #1892
- State rank
- #16 of 73 in FL
Livability — Berkshire Lakes
No livability data for this city. (Only ~50 U.S. cities are tracked.)
Census & demographics
- County
- Collier County · 396,295 people
- Metro
- Naples-Marco Island, FL
- Population (ZIP)
- 26,408
- Household income
- $71,686
- Rent vs Own
- Severe rent burden
- 1423.0
Population outlook (Collier County) Hauer SSP2
- Today (2025)
- 420,858 people
- By 2030
- 450,054 · +6.9%
- By 2040
- 502,232 · +19.3%
- By 2050
- 544,932 · +29.5%
- By 2075
- 627,203 · +49.0%
- By 2100
- 659,015 · +56.6%
Race, ethnicity, and origin ACS 2023
- Neighborhood character
- Majority White (62%)
- Race & ethnicity
- White 62% Hispanic / Latino 30% Two or more races 19% Black 4% Asian 2%
- Hispanic origin (detail)
- Mexican 7% Puerto Rican 3% Cuban 6% Dominican 1%
- Common ancestry
- Lithuanian 6% Romanian 3% Hispanic 2%
- Foreign-born
- 30% · Canada, Jamaica, Dominican Republic
- Languages at home
- 66% English-only · Spanish 24% French/Haitian/Cajun 5% Russian/Polish/Slavic 1%
Political lean MEDSL · Collier
- 2024 margin
- Solid R (+33.1) · D 33.1% · R 66.2%
- 2008→2024 swing
- -10.6pp toward R · 2008: -22.5pp · 2024: -33.1pp
- All cycles
- 2024: R+33.1 2020: R+24.7 2016: R+26.0 2012: R+30.1 2008: R+22.5
Not yet ingested
- Civics
- —
Market trends
- HPI YoY
- ▼ -252.48%
- Current HPI
- 259.3498
- Rent YoY
- ▼ -1.10%
- Metro
- Naples-Marco Island, FL
- State GDP YoY
- ▲ 3.28%
- F500 in state
- 36
Industry mix (Fortune 500 HQ in FL)
| Industry | F500 HQs | Revenue |
|---|---|---|
| Industrial Technology | 2 | $29B |
|
||
| Insurance | 2 | $17B |
|
||
| Retail | 1 | $60B |
|
||
| Technology Distribution | 1 | $58B |
|
||
| Homebuilding | 1 | $35B |
|
||
| Technology Manufacturing | 1 | $35B |
|
||
Price history
+25.1% since first listed18 events — show timeline
- 2026-05-11 Price Changed $499,000 NAPLESMLS
- 2026-02-11 Listed $509,000 NAPLESMLS
- 2025-07-01 Listing Removed — NAPLESMLS
- 2025-03-10 Price Changed $515,000 NAPLESMLS
- 2025-03-04 Price Changed $525,000 NAPLESMLS
- 2025-01-31 Relisted — NAPLESMLS
- 2025-01-06 Pending — NAPLESMLS
- 2024-09-28 Listed $550,000 NAPLESMLS
- 2024-07-01 Listing Removed — NAPLESMLS
- 2024-04-01 Listed $559,000 NAPLESMLS
- 2022-09-15 Listing Removed — NAPLESMLS
- 2022-08-19 Relisted — NAPLESMLS
- 2022-05-03 Pending — NAPLESMLS
- 2022-04-30 Listed $559,000 NAPLESMLS
- 2021-06-14 Sold (Public Records) $410,000 Public Records
- 2021-06-10 Sold (MLS) $410,000 NAPLESMLS
- 2021-04-27 Pending — NAPLESMLS
- 2021-04-23 Listed $399,000 NAPLESMLS
Property tax history
+9.1%/yrLatest (2025): $3,694 · +1.0% YoY. Source: county tax records.
Cash-flow waterfall
monthlySold comps — $/sqft
last 12 mo · ≤1 miLoading sold comps…