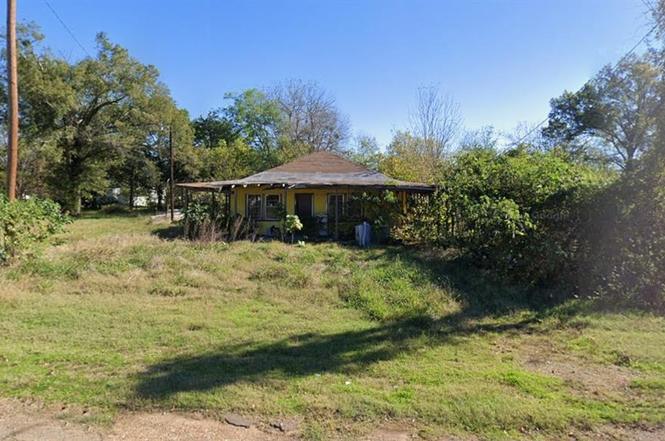
204 N 6th St · Talco, TX
Flood risk 1/10 · Minimal
- FEMA flood zone
- X (unshaded)
- Chance of flooding over 30 yrs
- 0.0%
- Est. flood insurance / yr
- $507 – $1,088
Fire risk 6/10 · Moderate
- Est. fire insurance / yr
- $1,222 – $2,270
Heat risk 7/10 · Major
- Hot days now (above 112°F)
- 7 days/yr
- Hot days in 30 yrs
- 24 days/yr
Wind risk 6/10 · Moderate
- Chance of severe wind over 30 yrs
- 27.0%
Air-quality risk 2/10 · Minimal
- Unhealthy air days now
- 1 days/yr
- Unhealthy air days in 30 yrs
- 1 days/yr
Risk factors via First Street. Map © Google.
Why this score? — see what drove the B grade
The composite is a weighted blend of 9 inputs, each scored 0–100. Each bar is that input's sub-score; the figure is the points it added to the 100-point composite (weight × sub-score).
- Cash flow +30.0/30.0
- 1% rule +10.0/10.0
- DSCR +10.0/10.0
- ARV discount +7.5/15.0
- Appreciation +5.0/10.0
- Schools +4.1/10.0
- Livability +2.9/5.0
- Rent growth +2.5/5.0
- Condition / age +2.5/5.0
$58,000
🖨 Deal sheet 📄 Offer letter ✓ Due diligence
Listing remarks
INVESTOR SPECIAL - FULL REHAB OPPORTUNITY UNDER $60K!!! This 1808sf home on a . 172 acre lot is ready for a full renovation. Located in Talco, TX, just 20 miles from Mount Pleasant, 30 miles from Longview, & 50 miles from Texarkana -- this property offers solid rental and resale potential in a market still within reach of multiple East Texas hubs. City water already in place. Structure offers space for creative reconfiguration or a full flip. Whether you're an investor looking to add to your portfolio or a first-time home flipper searching for your next project, this one is priced to move at JUST $58,000!!! Seller will carry with $15K down
Key facts
- City water in place
- 7,492 sq ft lot
- Built 1980
Tags
Neighborhood map
What this means for you Summary
Snapshot
- This is a 3-bed/1.0-bath single-family listed at $58k.
Deal economics
- At list price, monthly cash flow is $560 ($7k/yr) — positive.
- The deal already cash-flows at list — no discount required.
- Meets the 1% rule at list price ($1k rent vs $58k).
- Recommended offer: $55k (6.0% below list) — sets the bar for market timing.
Location & tenants
- Location reads 58/100 on livability (#1,195 in TX) — a working-class tenant base; expect higher turnover. Strengths: cost of living A+, housing A+; Watch: crime F, amenities F, commute F.
- Rivercrest ISD (rural): math 50% / reading 48% proficiency, ranked #212 of 826 in TX (top 26%) — families likely to look elsewhere, expect single-tenant / working-renter base with shorter leases.
- Zoned schools: Rivercrest El (math 32% / reading 42%, grade F, #1,769 of 4,322 statewide, top 44%, 334 students, 68% FRL).
- Zoned-school proficiency averages 37% at this address vs 49% district-wide (-12 pts) — the specific schools serving this property underperform the Rivercrest ISD average; the district grade overstates school quality for this exact location.
- Market conditions: 31 active listings in the ZIP; 47 units permitted in Titus County in 2024 (10 in 5+ unit buildings).
Forward outlook
- In year one you build about $2k of equity ($401 loan paydown + $2k appreciation (3.0% local appreciation)).
- At projected returns (3.0% appreciation + 3.0% rent growth), your $16k cash investment doubles in ~2 years — after that, you're playing with house money.
Negotiation context
- It's been on market 71 days — a 6% lower offer ($55k) is reasonable based on typical stale-listing flexibility.
- 2 sale attempts with the ask held roughly flat each time — persistent listings suggest the price (not the market) is what's stuck; bring a comps-based counter.
Risks & watch-outs
- Climate carrying-cost: major wind risk, 27% chance of damaging wind over 30y; major wildfire risk; extreme-heat days projected 7→24/yr by 2055 (HVAC capex compounding) — expect insurance premiums to compound above CPI over the hold.
Questions for the listing agent
- It's been on market 71 days. Have you received any prior offers? Is the seller open to a 6% concession, seller financing, or rate buy-down credit?
- Why hasn't it sold? Are there any deal-killer items the seller is aware of (foundation, flood, title, zoning, code violations)?
- Is there a deadline driving the sale (1031 exchange, divorce, estate, relocation)? That informs how much negotiation room exists.
- Schools are F-rated, which usually means shorter tenancies and higher turnover. Who's the typical renter profile here, and what's been the actual vacancy rate?
- Crime grade is F in this area — have there been break-ins, vandalism, or insurance claims at this property in the last 3 years? What carrier currently insures it and at what premium?
- What's the average days-on-market for RENTAL listings here right now (not sales)? A rising rental-DOM trend means longer vacancies and softer asking-rent achievability than the comps imply.
- What's the recent tenant-quality profile in this submarket — average credit score on applications, eviction rate, late-payment / NSF rate, and stable-employment percentage? A property-management company in the area should have these aggregated.
- How much new for-sale + rental construction is in the pipeline within 1–3 miles? Heavy new supply typically softens prices + rents 12–24 months out; constrained supply supports both.
Investment metrics
- 1% rule
- 2.10% ✓
- Cap rate
- 17.88%
- Cash-on-cash
- 41.37%
- DSCR
- 2.84
- GRM
- 4.0
CMA / ARV
- ARV (on-the-fly)
- $164,528
- Comps found
- 2
Show comp detail 2 sales within ~0.75 mi
| Address | Dist | Beds/Ba | Sqft | Sold | Price | $/sf | Match |
|---|---|---|---|---|---|---|---|
| 204 N 6th St | 0.00mi | 3/1.0 | 1,808 (0%) | 1mo | $58,000 | $32 | 99 |
| 307 E Lide St | 0.17mi | 3/2.0 | 1,538 (-15%) | 20mo | $139,900 | $91 | 46 |
Match score weights: distance 35% · size 25% · config 20% · recency 20%. Top-matched comps best support the ARV.
Projected returns pro-forma
3.0% appreciation · 3.0% rent growth · sell at horizon
- IRR
- 46.8%
- Equity multiple
- 3.63×
- Total profit
- $42,668
- Equity at exit
- $26,079
- IRR
- 46.6%
- Equity multiple
- 7.28×
- Total profit
- $101,948
- Equity at exit
- $40,191
Cash invested: $16,240 (down + closing). Projections, not guarantees.
Landlord ↔ Tenant lean methodology
- Overall (STATE)
- 87 Strongly Landlord-Friendly
- State Texas
- 87 Strongly Landlord-Friendly · R+5
- County
- — inherits STATE
- City
- — inherits STATE
ZIP-level market 75487
- Active inventory
- 31
- Price-to-rent
- 4.0×
Monthly cashflow live
- Estimated rent
- $1,216 medium interval (Pro) →
- Mortgage (P&I)
- −$304
- Tax est. 1.5%
- −$72 /mo · $870/yr
- Insurance
- −$24
- HOA
- −$0
- Vacancy / Maint / Mgmt
- −$255
- Net cashflow
- $560
Break-even live
UW: 25.0% down · 7.5% · 30yr · 1.5% tax · 5.0% vac · 8.0% maint · 8.0% mgmt
Financing live
Cash to close
- Down payment
- $14,500
- Closing costs
- $1,740
- Reserves months
- —
- Total cash needed
- —
Loan-product check · same deal, 3 products live
Conventional
25% down · 7.5% · 30yr
- Down + closing
- —
- Monthly P&I
- —
- Monthly cashflow
- —
- DSCR
- —
- Eligible?
- —
Personal DTI + credit; lowest rate.
DSCR
20% down · 8.5% · 30yr
- Down + closing
- —
- Monthly P&I
- —
- Monthly cashflow
- —
- DSCR
- —
- Eligible?
- —
No personal income docs; deal must DSCR.
Hard money
10% down · 12.0% · 12mo
- Down + closing
- —
- Monthly P&I
- —
- Monthly cashflow
- —
- DSCR
- —
- Eligible?
- —
Short-term bridge; refi at stabilization.
Listing history 6 events
-
2026-03-23soldstatus
-
2026-01-21status Pending
-
2025-11-11$58,000 Active
-
2025-09-16historical
-
2025-05-16$15,000 Active
-
1998-09-18soldstatus
ⓘ Source: listings_history table (triggers on properties + properties_extension) + one-shot
backfill from property_details.listing_events for pre-trigger history.
Climate risk First Street
- Flood 1/10 Low FEMA zone X (unshaded) · 0% chance over 30 yrs
- Wildfire 6/10 Major
- Heat 7/10 Severe 7 d/yr ≥112°F today · 24 d/yr by 30 yrs out
- Wind 6/10 Major 27% chance of damaging wind over 30 yrs
- Air quality 2/10 Low 1 unhealthy d/yr today · 1 by 30 yrs out
Nearby sold comps map
Loading sold comps map…
Walkable amenities ~0.75 mi
Loading nearby amenities…
Taxation est. · year 1
- Rental income
- $14,594
- − Mortgage interest
- −$3,249
- − Property taxes
- −$870
- − Insurance
- −$290
- − Repairs & maintenance
- −$1,168
- − Management
- −$1,168
- − Depreciation
- −$1,687
- Taxable income
- $6,163
- Est. tax owed @ 24.0%
- −$1,479
- After-tax cash flow
- $5,240/yr
For passive investors: Depreciation is non-cash, so a rental often shows a tax loss while cash-flowing — sheltering income. Rental losses are passive: they offset passive income freely, and up to $25,000/yr can offset ordinary (W-2) income if you actively participate and your MAGI is under $100k (phasing out to $0 by $150k); unused losses carry forward. On sale, claimed depreciation is recaptured at up to 25%, and gains may owe capital-gains tax (a 1031 exchange can defer both). Figures are a year-1 estimate at your 24.0% rate — not tax advice; consult a CPA.
Schools (NCES district)
- District
- Rivercrest ISD
- NCES district ID
- 4842120
- Math proficiency
- 50% ▼ -7.00%
- Reading proficiency
- 48% ▲ 5.00%
- Median HH income
- $39,064
- Composite
- 40.93/100
- National rank
- #3611
- State rank
- #212 of 826 in TX
Livability — Talco
- Score
- 58/100
- State rank
- #1195
- US rank
- #20910
Category grades
Schools grade is shown separately in the Schools card above.
Census & demographics
- Census place
- Talco, TX
- Population (ZIP)
- 1,110
Population outlook (Titus County) Hauer SSP2
- Today (2025)
- 33,205 people
- By 2030
- 33,187 · -0.1%
- By 2040
- 32,931 · -0.8%
- By 2050
- 32,231 · -2.9%
- By 2075
- 29,507 · -11.1%
- By 2100
- 25,369 · -23.6%
Race, ethnicity, and origin ACS 2023
- Neighborhood character
- Diverse neighborhood (Simpson 0.56)
- Race & ethnicity
- White 58% Hispanic / Latino 31% Two or more races 18% Black 5%
- Hispanic origin (detail)
- Mexican 29%
- Common ancestry
- Romanian 8% European 1% Iranian 1%
- Foreign-born
- 18% · Canada
- Languages at home
- 79% English-only · Spanish 21%
Political lean MEDSL · Titus
- 2024 margin
- Solid R (+54.7) · D 22.3% · R 77.0%
- 2008→2024 swing
- -23.5pp toward R · 2008: -31.2pp · 2024: -54.7pp
- All cycles
- 2024: R+54.7 2020: R+44.7 2016: R+42.1 2012: R+39.0 2008: R+31.2
Not yet ingested
- Civics
- —
Market trends
- HPI YoY
- —
- Current HPI
- —
- Rent YoY
- —
- Metro
- —
- State GDP YoY
- ▲ 3.95%
- F500 in state
- 110
Industry mix (Fortune 500 HQ in TX)
| Industry | F500 HQs | Revenue |
|---|---|---|
| Energy | 16 | $1,198B |
|
||
| Technology | 5 | $198B |
|
||
| Engineering / Construction | 4 | $72B |
|
||
| Energy Services | 3 | $60B |
|
||
| Utilities | 3 | $41B |
|
||
| Healthcare | 2 | $330B |
|
||
Price history
+286.7% since first listed6 events — show timeline
- 2026-03-23 Sold (Public Records) — Public Records
- 2026-01-21 Pending — NTREIS
- 2025-11-11 Listed $58,000 NTREIS
- 2025-09-16 Listing Removed — NTREIS
- 2025-05-16 Listed $15,000 NTREIS
- 1998-09-18 Sold (Public Records) — Public Records
Property tax history
+4.9%/yrLatest (2025): $3,071 · +46.3% YoY. Source: county tax records.
Cash-flow waterfall
monthlySold comps — $/sqft
last 12 mo · ≤1 miLoading sold comps…