 Multi-family
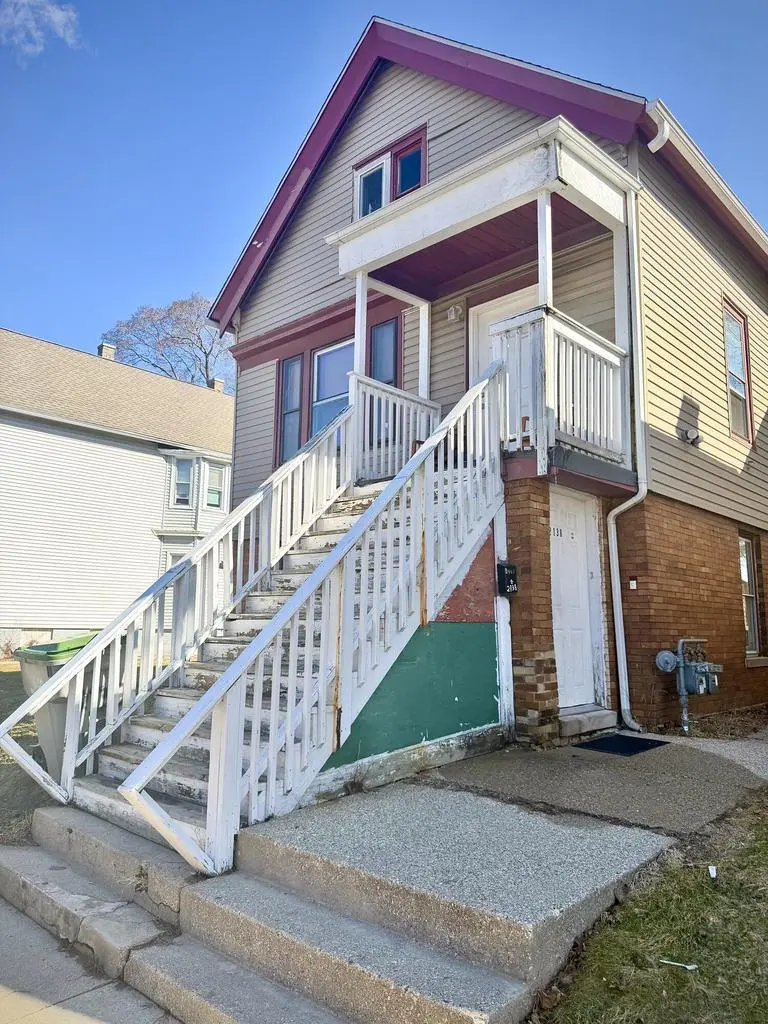
2136 S 16th St #2138 · Milwaukee, WI
Flood risk 1/10 · Minimal
- FEMA flood zone
- X (unshaded)
- Chance of flooding over 30 yrs
- 0.0%
- Est. flood insurance / yr
- $473 – $860
Fire risk 1/10 · Minimal
- Est. fire insurance / yr
- $636 – $1,182
Heat risk 2/10 · Minimal
- Hot days now (above 96°F)
- 7 days/yr
- Hot days in 30 yrs
- 13 days/yr
Wind risk 2/10 · Minimal
- Chance of severe wind over 30 yrs
- —
Air-quality risk 3/10 · Minor
- Unhealthy air days now
- 3 days/yr
- Unhealthy air days in 30 yrs
- 3 days/yr
Risk factors via First Street. Map © Google.
Why this score? — see what drove the D+ grade
The composite is a weighted blend of 9 inputs, each scored 0–100. Each bar is that input's sub-score; the figure is the points it added to the 100-point composite (weight × sub-score).
- Cash flow +19.5/30.0
- ARV discount +7.5/15.0
- DSCR +6.2/10.0
- 1% rule +5.2/10.0
- Livability +4.0/5.0
- Rent growth +3.8/5.0
- Condition / age +2.5/5.0
- Schools +1.2/10.0
- Appreciation +0.0/10.0
$220,000
🖨 Deal sheet 📄 Offer letter ✓ Due diligence
Multi-family units
County records classify this as Multi-Family (2-4 Unit). Listing-text estimate: 1 unit. estimate disagrees with records
Listing remarks MLS
Great Opportunity for Investors or/and Owner Occupied. Upper was fully renovated four years ago, it has 3 Bedrooms, big Dinning in Living room area. Lower has 3 Bedrooms, Living room and Dinning in Kitchen. The nice sized fenced backyard allow the kids play safety. Property is offered ''As-Is'' without repair or warranties. Tenants have a Mtm rent they will be likely to keep renting.
Key facts
- 3,920 sq ft lot
- Built 1888
- Listed 68 days
Neighborhood map
What this means for you Summary
Snapshot
- This is a 6-bed/2.0-bath multifamily listed at $220k.
Deal economics
- At list price, monthly cash flow is $248 ($3k/yr) — positive.
- The deal already cash-flows at list — no discount required.
- Meets the 1% rule at list price ($2k rent vs $220k).
- Recommended offer: $207k (6.0% below list) — sets the bar for market timing.
- Cap rate 7.6% vs local median 5.1% in Milwaukee — top-decile yield for the area; either an underpriced asset or a hidden risk that comps aren't pricing in. Stress-test before assuming the spread holds.
Location & tenants
- Location reads 81/100 on livability (#55 in WI, #1,534 nationally) — a professional / high-income tenant draw. Strengths: amenities A+, commute A+, cost of living A+; Watch: employment D+, schools F, crime F.
- Milwaukee School District (urban): math 10% / reading 18% proficiency, ranked #337 of 342 in WI (top 98%) — low school quality limits family demand, transient renter base, plan for 1-2y turnover; 77% free/reduced lunch — lower-income household profile, screen leases tightly.
- Market conditions: Rents rising fast (+5.0%/yr); 57 active listings in the ZIP; 1,017 units permitted in Milwaukee County in 2024 (803 in 5+ unit buildings).
- At $2,239/mo this rent would consume 49% of the median local household income ($54k/yr) (locally 2283% of renters already pay >50% of income on rent) — very limited rent-growth headroom before tenants either downsize or default.
Forward outlook
- Local home prices are declining (-3.0%/yr); year-one equity from $2k of loan paydown is wiped out by about $7k of value loss. Plan a longer hold.
- Milwaukee County population projected at +4% by 2050 — modest demand growth; plan on rents tracking national, not racing it.
Negotiation context
- It's been on market 69 days — a 6% lower offer ($207k) is reasonable based on typical stale-listing flexibility.
- 2 sale attempts since 4y ago with the ask held roughly flat each time — persistent listings suggest the price (not the market) is what's stuck; bring a comps-based counter.
Risks & watch-outs
- Watch-outs: built in 1888 — expect roof / HVAC / electrical / plumbing capex.
Questions for the listing agent
- It's been on market 69 days. Have you received any prior offers? Is the seller open to a 6% concession, seller financing, or rate buy-down credit?
- Built in 1888 — when were the roof, HVAC, electrical panel, plumbing, and water heater last replaced?
- Why hasn't it sold? Are there any deal-killer items the seller is aware of (foundation, flood, title, zoning, code violations)?
- Is there a deadline driving the sale (1031 exchange, divorce, estate, relocation)? That informs how much negotiation room exists.
- Schools are F-rated, which usually means shorter tenancies and higher turnover. Who's the typical renter profile here, and what's been the actual vacancy rate?
- Crime grade is F in this area — have there been break-ins, vandalism, or insurance claims at this property in the last 3 years? What carrier currently insures it and at what premium?
- The area grade is low — what's the realistic commute time and amenity access for the typical tenant pool here? Any planned neighborhood developments (good or bad) we should know about?
- What's the average days-on-market for RENTAL listings here right now (not sales)? A rising rental-DOM trend means longer vacancies and softer asking-rent achievability than the comps imply.
- What's the recent tenant-quality profile in this submarket — average credit score on applications, eviction rate, late-payment / NSF rate, and stable-employment percentage? A property-management company in the area should have these aggregated.
- How much new apartment / multifamily construction is in the pipeline within 1–3 miles? Heavy new supply (>2% of stock underway) typically softens rents 12–24 months out; light construction supports rent growth.
Investment metrics
- 1% rule
- 1.02% ✓
- Cap rate
- 7.65%
- Cash-on-cash
- 4.84%
- DSCR
- 1.22
- GRM
- 8.2
CMA / ARV
- ARV (median comp)
- $144,161
- List price
- $220,000
- Delta
- 52.61%
- Verdict
- OVERPRICED
- Comps
- 20 within 1.0 mi
Show comp detail 12 sales within ~0.75 mi
| Address | Dist | Beds/Ba | Sqft | Sold | Price | $/sf | Match |
|---|---|---|---|---|---|---|---|
| 2034 S 15th St Unit 2034A | 0.17mi | 6/2.0 | 2,146 (-3%) | 6mo | $217,900 | $102 | 82 |
| 2370 S 18th St | 0.32mi | 6/2.0 | 2,156 (-3%) | 5mo | $153,000 | $71 | 77 |
| 1939 S Winona Ln #1941 | 0.28mi | 7/2.5 (+1) | 2,286 (+3%) | 1mo | $220,000 | $96 | 74 |
| 2119 S 14th St | 0.15mi | 5/2.0 (-1) | 1,968 (-11%) | 3mo | $220,000 | $112 | 67 |
| 2509 S 15th St #2511 | 0.47mi | 6/2.0 | 2,352 (+6%) | 5mo | $259,000 | $110 | 64 |
| 2415 S 9th St Unit 2415A | 0.61mi | 5/2.0 (-1) | 2,124 (-4%) | 0mo | $190,000 | $89 | 59 |
| 2439 S 8th St | 0.68mi | 5/2.0 (-1) | 2,101 (-5%) | 3mo | $171,000 | $81 | 52 |
| 2053 S 25th St | 0.65mi | 5/3.0 (-1) | 2,095 (-5%) | 1mo | $300,000 | $143 | 51 |
| 2673 S 14th St | 0.67mi | 6/2.0 | 1,972 (-11%) | 1mo | $250,000 | $127 | 50 |
| 1560 S 15th St #1562 | 0.63mi | 7/2.0 (+1) | 2,442 (+10%) | 2mo | $235,000 | $96 | 47 |
| 1425 W Orchard St Unit 1425A | 0.72mi | 6/2.0 | 1,967 (-11%) | 3mo | $172,000 | $87 | 46 |
| 1600 S Muskego Ave | 0.59mi | 5/2.0 (-1) | 1,910 (-14%) | 3mo | $140,140 | $73 | 42 |
Match score weights: distance 35% · size 25% · config 20% · recency 20%. Top-matched comps best support the ARV.
Projected returns pro-forma
-3.0% appreciation · 5.02% rent growth · sell at horizon
- IRR
- -6.5%
- Equity multiple
- 0.75×
- Total profit
- $-15,150
- Equity at exit
- $32,803
- IRR
- 5.5%
- Equity multiple
- 1.44×
- Total profit
- $27,172
- Equity at exit
- $19,022
Cash invested: $61,600 (down + closing). Projections, not guarantees.
Landlord ↔ Tenant lean methodology
- Overall (STATE)
- 73 Landlord-Friendly
- State Wisconsin
- 73 Landlord-Friendly · R+2
- County
- — inherits STATE
- City
- — inherits STATE
ZIP-level market 53215
- Home prices YoY
- -13.6%
- Rents YoY
- 5.0%
- Active inventory
- 57
- Price-to-rent
- 16.4×
Monthly cashflow live
- Estimated rent
- $2,239 high interval (Pro) →
- Mortgage (P&I)
- −$1,154
- Tax est. 1.5%
- −$275 /mo · $3,300/yr
- Insurance
- −$92
- HOA
- −$0
- Vacancy / Maint / Mgmt
- −$470
- Net cashflow
- $248
Break-even live
2-unit breakdown (identical units grouped — click to expand)
| Units | Beds | Baths | Est. rent |
|---|---|---|---|
| 2× units | 3 | 1 | $2,240 |
| #1 | 3 | 1 | $1,120 |
| #2 | 3 | 1 | $1,120 |
| Total (2 units) | $2,239 | ||
UW: 25.0% down · 7.5% · 30yr · 1.5% tax · 5.0% vac · 8.0% maint · 8.0% mgmt
Financing live
Cash to close
- Down payment
- $55,000
- Closing costs
- $6,600
- Reserves months
- —
- Total cash needed
- —
Loan-product check · same deal, 3 products live
Conventional
25% down · 7.5% · 30yr
- Down + closing
- —
- Monthly P&I
- —
- Monthly cashflow
- —
- DSCR
- —
- Eligible?
- —
Personal DTI + credit; lowest rate.
DSCR
20% down · 8.5% · 30yr
- Down + closing
- —
- Monthly P&I
- —
- Monthly cashflow
- —
- DSCR
- —
- Eligible?
- —
No personal income docs; deal must DSCR.
Hard money
10% down · 12.0% · 12mo
- Down + closing
- —
- Monthly P&I
- —
- Monthly cashflow
- —
- DSCR
- —
- Eligible?
- —
Short-term bridge; refi at stabilization.
Listing history 9 events
-
2026-06-03days on market $220,000 Active 69 DOM
-
2026-06-02days on market $220,000 Active 68 DOM
-
2026-06-01days on market $220,000 Active 67 DOM
-
2026-05-31days on market $220,000 Active 66 DOM
-
2026-03-26$220,000 Active 386-char remark
Show marketing remark (386 chars)
Great Opportunity for Investors or/and Owner Occupied. Upper was fully renovated four years ago, it has 3 Bedrooms, big Dinning in Living room area. Lower has 3 Bedrooms, Living room and Dinning in Kitchen. The nice sized fenced backyard allow the kids play safety. Property is offered ''As-Is'' without repair or warranties. Tenants have a Mtm rent they will be likely to keep renting.
-
2022-10-25historical 96-char remark
Show marketing remark (96 chars)
Great investment opportunity, let your tenants pay you mortgage. 2/2BR duplex freshly remodeled.
-
2022-08-18price $165,000 96-char remark
Show marketing remark (96 chars)
Great investment opportunity, let your tenants pay you mortgage. 2/2BR duplex freshly remodeled.
-
2022-07-15price $177,000 96-char remark
Show marketing remark (96 chars)
Great investment opportunity, let your tenants pay you mortgage. 2/2BR duplex freshly remodeled.
-
2022-06-24$184,900 Active 96-char remark
Show marketing remark (96 chars)
Great investment opportunity, let your tenants pay you mortgage. 2/2BR duplex freshly remodeled.
ⓘ Source: listings_history table (triggers on properties + properties_extension) + one-shot
backfill from property_details.listing_events for pre-trigger history.
Climate risk First Street
- Flood 1/10 Low FEMA zone X (unshaded) · 0% chance over 30 yrs
- Wildfire 1/10 Low
- Heat 2/10 Low 7 d/yr ≥96°F today · 13 d/yr by 30 yrs out
- Wind 2/10 Low
- Air quality 3/10 Moderate 3 unhealthy d/yr today · 3 by 30 yrs out
Nearby sold comps map
Loading sold comps map…
Walkable amenities ~0.75 mi
Loading nearby amenities…
Taxation est. · year 1
- Rental income
- $26,868
- − Mortgage interest
- −$12,323
- − Property taxes
- −$3,300
- − Insurance
- −$1,100
- − Repairs & maintenance
- −$2,149
- − Management
- −$2,149
- − Depreciation
- −$6,400
- Taxable loss
- −$554
- Est. tax savings @ 24.0%
- +$133
- After-tax cash flow
- $3,114/yr
For passive investors: Depreciation is non-cash, so a rental often shows a tax loss while cash-flowing — sheltering income. Rental losses are passive: they offset passive income freely, and up to $25,000/yr can offset ordinary (W-2) income if you actively participate and your MAGI is under $100k (phasing out to $0 by $150k); unused losses carry forward. On sale, claimed depreciation is recaptured at up to 25%, and gains may owe capital-gains tax (a 1031 exchange can defer both). Figures are a year-1 estimate at your 24.0% rate — not tax advice; consult a CPA.
Schools (NCES district)
- District
- Milwaukee School District
- NCES district ID
- 5509600
- Math proficiency
- 10% ▼ -5.00%
- Reading proficiency
- 18% ▬ 0.00%
- Median HH income
- $36,339
- Composite
- 11.61/100
- National rank
- #9696
- State rank
- #337 of 342 in WI
Livability — Milwaukee
- Score
- 81/100
- State rank
- #55
- US rank
- #1534
Category grades
Schools grade is shown separately in the Schools card above.
Census & demographics
- Census place
- Milwaukee, WI
- County
- Milwaukee County · 926,379 people
- City population
- 573,768
- Metro
- Milwaukee-Waukesha, WI
- Population (ZIP)
- 58,146
- Household income
- $54,289
- Rent vs Own
- Severe rent burden
- 2283.0
Population outlook (Milwaukee County) Hauer SSP2
- Today (2025)
- 995,758 people
- By 2030
- 1,009,124 · +1.3%
- By 2040
- 1,028,128 · +3.3%
- By 2050
- 1,040,066 · +4.4%
- By 2075
- 1,057,849 · +6.2%
- By 2100
- 1,039,774 · +4.4%
Race, ethnicity, and origin ACS 2023
- Neighborhood character
- Predominantly Hispanic (69%)
- Race & ethnicity
- Hispanic / Latino 69% Two or more races 34% White 18% Asian 6% Black 5% Native American 2%
- Hispanic origin (detail)
- Mexican 52% Puerto Rican 12%
- Common ancestry
- Romanian 6% Portuguese 1%
- Foreign-born
- 31% · Canada, Philippines, Jamaica
- Languages at home
- 35% English-only · Spanish 59% Other Asian/Pacific 3% Other Indo-European 1%
Political lean MEDSL · Milwaukee
- 2024 margin
- Solid D (+38.5) · D 68.3% · R 29.8% · Other 1.8%
- 2008→2024 swing
- +2.7pp toward D · 2008: 35.9pp · 2024: 38.5pp
- All cycles
- 2024: D+38.5 2020: D+39.9 2016: D+37.5 2012: D+34.6 2008: D+35.9
Not yet ingested
- Civics
- —
Market trends
- HPI YoY
- ▼ -52.55%
- Current HPI
- 332.891
- Rent YoY
- ▲ 5.02%
- Metro
- Milwaukee-Waukesha, WI
- State GDP YoY
- ▲ 2.10%
- F500 in state
- 20
Industry mix (Fortune 500 HQ in WI)
| Industry | F500 HQs | Revenue |
|---|---|---|
| Industrial Machinery | 4 | $23B |
|
||
| Industrial Technology | 2 | $36B |
|
||
| Insurance | 1 | $36B |
|
||
| Professional Services | 1 | $19B |
|
||
| Utilities | 1 | $9B |
|
||
| Consumer Goods | 1 | $3B |
|
||
Price history
+19.0% since first listed5 events — show timeline
- 2026-03-26 Listed $220,000 METROMLS
- 2022-10-25 Listing Removed — METROMLS
- 2022-08-18 Price Changed $165,000 METROMLS
- 2022-07-15 Price Changed $177,000 METROMLS
- 2022-06-24 Listed $184,900 METROMLS
Cash-flow waterfall
monthlySold comps — $/sqft
last 12 mo · ≤1 miLoading sold comps…