 Triplex
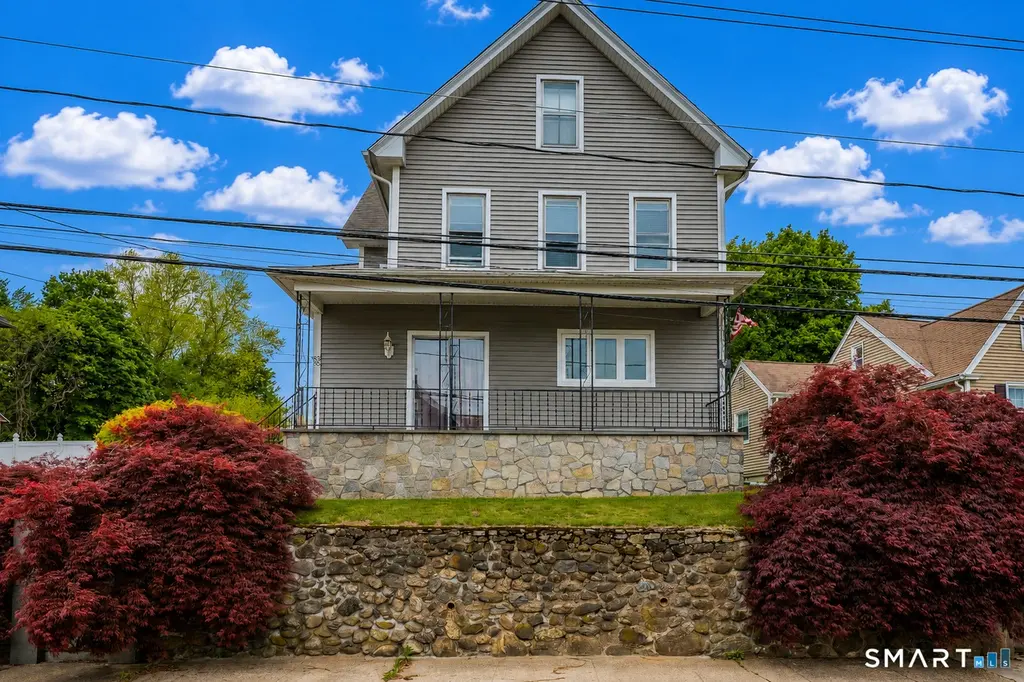
83-85 Ward St · Naugatuck, CT
Flood risk 1/10 · Minimal
- FEMA flood zone
- X (unshaded)
- Chance of flooding over 30 yrs
- 0.0%
- Est. flood insurance / yr
- $473 – $860
Fire risk 3/10 · Minor
- Est. fire insurance / yr
- $829 – $1,539
Heat risk 5/10 · Moderate
- Hot days now (above 96°F)
- 7 days/yr
- Hot days in 30 yrs
- 16 days/yr
Wind risk 6/10 · Moderate
- Chance of severe wind over 30 yrs
- 27.0%
Air-quality risk 3/10 · Minor
- Unhealthy air days now
- 2 days/yr
- Unhealthy air days in 30 yrs
- 4 days/yr
Risk factors via First Street. Map © Google.
Why this score? — see what drove the C+ grade
The composite is a weighted blend of 9 inputs, each scored 0–100. Each bar is that input's sub-score; the figure is the points it added to the 100-point composite (weight × sub-score).
- Cash flow +29.9/30.0
- DSCR +10.0/10.0
- 1% rule +8.4/10.0
- Rent growth +4.1/5.0
- Livability +3.9/5.0
- Schools +3.3/10.0
- Condition / age +2.5/5.0
- ARV discount +0.1/15.0
- Appreciation +0.0/10.0
$475,000
🖨 Deal sheet 📄 Offer letter ✓ Due diligence
Multi-family units
County records classify this as Multi-Family (2-4 Unit). Listing-text estimate: 3 units. confirmed
Listing remarks
WOW what a find! Exceptional multi-family opportunity at 83-85 Ward Street in Naugatuck, CT! This well-maintained 2-3 family property is ideal for investors or owner-occupants seeking strong income potential with added lifestyle perks. Each unit offers spacious layouts with bright living areas, generously sized bedrooms, and functional kitchens designed for comfortable everyday living. The property also features separate utilities enhancing convenience and efficiency. Standout feature is the oversized 4-car garage, providing ample parking, storage, or potential workshop space. Outside, enjoy a covered patio perfect for relaxing or entertaining. The yard includes mature fruit trees-adding ch
Key facts
- Separate utilities
- Mature fruit trees
- Garden area
Tags
Property features AI
Exterior
- Parking: Detached garage; 4 garage spaces
- Utilities: Public water connected; Public sewer connected; Electric hot water
- Home design: Multi-family (2-family); Multi-family property for sale
- Construction: Frame construction; Concrete foundation; Asphalt shingle roof; Vinyl siding; Built as multi-unit (2 units total)
- Exterior features: Porch; Garden area; Stone wall; Grill; Fruit trees; Kennel
Interior
- Bedrooms: 4 bedrooms
- Bathrooms: 2 full bathrooms
- Heating & cooling: Hot water heating (natural gas); Central air
- Interior features: Central air conditioning; Full unfinished basement with hatchway and interior access; Finished, floored attic with hatch access
Neighborhood map
What this means for you Summary
Snapshot
- This is a 3 × 4-bed/2.0-bath units multifamily listed at $475k.
Deal economics
- At list price, monthly cash flow is $2k ($21k/yr) — positive. Per door: $588/mo.
- The deal already cash-flows at list — no discount required.
- Meets the 1% rule at list price ($6k rent vs $475k).
- Cap rate 10.7% vs local median 3.4% in Naugatuck — top-decile yield for the area; either an underpriced asset or a hidden risk that comps aren't pricing in. Stress-test before assuming the spread holds.
Location & tenants
- Location reads 77/100 on livability (#42 in CT, #2,997 nationally) — a middle-class / working-renter tenant base. Strengths: crime A+, housing A+, health & safety A+; Watch: amenities F, commute D-.
- Naugatuck School District (suburban): math 32% / reading 43% proficiency, ranked #105 of 153 in CT (top 69%) — families likely to look elsewhere, expect single-tenant / working-renter base with shorter leases.
- Zoned schools: Naugatuck High School (math 20% / reading 44%, grade F, #129 of 194 statewide, top 69%, 1,288 students, 52% FRL) — zoned schools average 52% FRL vs 35% district-wide (18 pts higher); higher-poverty schools than district average — tighter screening recommended.
- Market conditions: Rents rising fast (+6.2%/yr); 112 active listings in the ZIP; 2 comparable units currently listed for rent nearby; solid renter incomes; 502 units permitted in Naugatuck Valley Planning Region in 2024 (171 in 5+ unit buildings).
- At $6,376/mo this rent would consume 80% of the median local household income ($96k/yr) (locally 788% of renters already pay >50% of income on rent) — very limited rent-growth headroom before tenants either downsize or default.
Forward outlook
- Local home prices are declining (-3.0%/yr); year-one equity from $3k of loan paydown is wiped out by about $14k of value loss. Plan a longer hold.
- At projected returns (-3.0% appreciation + 6.2% rent growth), your $133k cash investment doubles in ~7 years — after that, you're playing with house money.
Negotiation context
- Only 12 days on market — expect competitive offers; lowballing is unlikely to land.
- 2 sale attempts since 2y ago with the ask held roughly flat each time — persistent listings suggest the price (not the market) is what's stuck; bring a comps-based counter.
Risks & watch-outs
- Watch-outs: built in 1928 — expect roof / HVAC / electrical / plumbing capex.
- Climate carrying-cost: major wind risk, 27% chance of damaging wind over 30y; extreme-heat days projected 7→16/yr by 2055 (HVAC capex compounding) — expect insurance premiums to compound above CPI over the hold.
Questions for the listing agent
- Can we see the unit-by-unit rent roll, current vacancy, and any below-market leases? What's the average tenancy length?
- What capital expenditures (roof, boiler, parking lot, exteriors) have been made in the last 5 years, and what's planned in the next 2?
- Built in 1928 — when were the roof, HVAC, electrical panel, plumbing, and water heater last replaced?
- Is there a deadline driving the sale (1031 exchange, divorce, estate, relocation)? That informs how much negotiation room exists.
- What's the average days-on-market for RENTAL listings here right now (not sales)? A rising rental-DOM trend means longer vacancies and softer asking-rent achievability than the comps imply.
- What's the recent tenant-quality profile in this submarket — average credit score on applications, eviction rate, late-payment / NSF rate, and stable-employment percentage? A property-management company in the area should have these aggregated.
- How much new apartment / multifamily construction is in the pipeline within 1–3 miles? Heavy new supply (>2% of stock underway) typically softens rents 12–24 months out; light construction supports rent growth.
Investment metrics
- 1% rule
- 1.34% ✓
- Cap rate
- 10.75%
- Cash-on-cash
- 15.92%
- DSCR
- 1.71
- GRM
- 6.2
CMA / ARV
- ARV (median comp)
- $408,206
- List price
- $475,000
- Delta
- 16.36%
- Verdict
- OVERPRICED
- Comps
- 20 within 1.0 mi
Show comp detail 8 sales within ~0.75 mi
| Address | Dist | Beds/Ba | Sqft | Sold | Price | $/sf | Match |
|---|---|---|---|---|---|---|---|
| 23 Ward St | 0.11mi | 5/2.0 (+1) | 2,526 (+3%) | 7mo | $425,000 | $168 | 79 |
| 150 Scott St | 0.39mi | 4/2.0 | 2,416 (-2%) | 1mo | $294,900 | $122 | 78 |
| 48 High St | 0.32mi | 4/4.0 | 2,288 (-7%) | 5mo | $300,000 | $131 | 61 |
| 33 Aetna St | 0.56mi | 4/2.0 | 2,217 (-10%) | 8mo | $335,000 | $151 | 50 |
| 8 Cliff St | 0.59mi | 5/2.5 (+1) | 2,302 (-6%) | 11mo | $485,000 | $211 | 46 |
| 27 Frederick St | 0.71mi | 4/2.0 | 2,231 (-9%) | 16mo | $390,000 | $175 | 38 |
| 111 Irving St | 0.52mi | 4/3.0 | 2,198 (-11%) | 20mo | $440,000 | $200 | 37 |
| 23 Barnum Ct | 0.51mi | 5/2.5 (+1) | 2,196 (-11%) | 22mo | $375,000 | $171 | 33 |
Match score weights: distance 35% · size 25% · config 20% · recency 20%. Top-matched comps best support the ARV.
Projected returns pro-forma
-3.0% appreciation · 6.23% rent growth · sell at horizon
- IRR
- 10.4%
- Equity multiple
- 1.43×
- Total profit
- $56,872
- Equity at exit
- $70,824
- IRR
- 22.0%
- Equity multiple
- 3.17×
- Total profit
- $288,382
- Equity at exit
- $41,069
Cash invested: $133,000 (down + closing). Projections, not guarantees.
Landlord ↔ Tenant lean methodology
- Overall (STATE)
- 27 Tenant-Leaning
- State Connecticut
- 27 Tenant-Leaning · D+7
- County
- — inherits STATE
- City
- — inherits STATE
ZIP-level market 06770
- Home prices YoY
- -33.3%
- Rents YoY
- 6.2%
- Active inventory
- 112
- Price-to-rent
- 18.6×
Monthly cashflow live
- Estimated rent
- $6,376 medium interval (Pro) →
- Mortgage (P&I)
- −$2,491
- Tax from tax record
- −$584 /mo · $7,008/yr
- Insurance
- −$198
- HOA
- −$0
- Vacancy / Maint / Mgmt
- −$1,339
- Net cashflow
- $1,764
Break-even live
3-unit breakdown (identical units grouped — click to expand)
| Units | Beds | Baths | Est. rent |
|---|---|---|---|
| 3× units | 4 | 2 | $6,375 |
| #1 | 4 | 2 | $2,125 |
| #2 | 4 | 2 | $2,125 |
| #3 | 4 | 2 | $2,125 |
| Total (3 units) | $6,376 | ||
UW: 25.0% down · 7.5% · 30yr · 1.5% tax · 5.0% vac · 8.0% maint · 8.0% mgmt
Financing live
Cash to close
- Down payment
- $118,750
- Closing costs
- $14,250
- Reserves months
- —
- Total cash needed
- —
Loan-product check · same deal, 3 products live
Conventional
25% down · 7.5% · 30yr
- Down + closing
- —
- Monthly P&I
- —
- Monthly cashflow
- —
- DSCR
- —
- Eligible?
- —
Personal DTI + credit; lowest rate.
DSCR
20% down · 8.5% · 30yr
- Down + closing
- —
- Monthly P&I
- —
- Monthly cashflow
- —
- DSCR
- —
- Eligible?
- —
No personal income docs; deal must DSCR.
Hard money
10% down · 12.0% · 12mo
- Down + closing
- —
- Monthly P&I
- —
- Monthly cashflow
- —
- DSCR
- —
- Eligible?
- —
Short-term bridge; refi at stabilization.
Rent comps 2 comps
| Address | Beds | Baths | Sqft | Rent | $/sqft | DOM | Units | Dist |
|---|---|---|---|---|---|---|---|---|
| 43 Hoadley St Naugatuck, CT | 3.0 | 1.5 | 2816 | $2,000 | $0.71 | 23d | 1 | 0.90mi |
| 183 Osborn Rd Naugatuck, CT | 3.0 | 2.5 | 1850 | $3,400 | $1.84 | 2d | 1 | 1.30mi |
Listing history 3 events
-
2026-05-08$475,000 Active 1102-char remark
-
2024-03-12historical $1,200
-
2024-03-04$1,200
ⓘ Source: listings_history table (triggers on properties + properties_extension) + one-shot
backfill from property_details.listing_events for pre-trigger history.
Tax reassessment forecast CT · Partial reset (capped growth)
- Current annual tax
- $7,008 · $584/mo
- Projected year-2 tax
- $8,586 · $716/mo
- Expected delta
- +$1,578/yr (+$132/mo · 22.5%)
ⓘ Screening estimate from a state-policy table — verify with the county assessor before closing.
Climate risk First Street
- Flood 1/10 Low FEMA zone X (unshaded) · 0% chance over 30 yrs
- Wildfire 3/10 Moderate
- Heat 5/10 Major 7 d/yr ≥96°F today · 16 d/yr by 30 yrs out
- Wind 6/10 Major 27% chance of damaging wind over 30 yrs
- Air quality 3/10 Moderate 2 unhealthy d/yr today · 4 by 30 yrs out
Nearby sold comps map
Loading sold comps map…
Walkable amenities ~0.75 mi
Loading nearby amenities…
Taxation est. · year 1
- Rental income
- $76,512
- − Mortgage interest
- −$26,607
- − Property taxes
- −$7,008
- − Insurance
- −$2,375
- − Repairs & maintenance
- −$6,121
- − Management
- −$6,121
- − Depreciation
- −$13,818
- Taxable income
- $14,462
- Est. tax owed @ 24.0%
- −$3,471
- After-tax cash flow
- $17,699/yr
For passive investors: Depreciation is non-cash, so a rental often shows a tax loss while cash-flowing — sheltering income. Rental losses are passive: they offset passive income freely, and up to $25,000/yr can offset ordinary (W-2) income if you actively participate and your MAGI is under $100k (phasing out to $0 by $150k); unused losses carry forward. On sale, claimed depreciation is recaptured at up to 25%, and gains may owe capital-gains tax (a 1031 exchange can defer both). Figures are a year-1 estimate at your 24.0% rate — not tax advice; consult a CPA.
Schools (NCES district)
- District
- Naugatuck School District
- NCES district ID
- 0902640
- Math proficiency
- 32% ▼ -13.00%
- Reading proficiency
- 43% ▼ -11.00%
- Median HH income
- $61,060
- Composite
- 33.44/100
- National rank
- #5463
- State rank
- #105 of 153 in CT
Livability — Naugatuck
- Score
- 77/100
- State rank
- #42
- US rank
- #2997
Category grades
Schools grade is shown separately in the Schools card above.
Census & demographics
- Census place
- Naugatuck, CT
- County
- New Haven County · 688,236 people
- City population
- 31,823
- Metro
- New Haven-Milford, CT
- Population (ZIP)
- 31,823
- Household income
- $96,208
- Rent vs Own
- Severe rent burden
- 788.0
Population outlook (Naugatuck Valley County) Hauer SSP2
- By 2040
- 496,846
Race, ethnicity, and origin ACS 2023
- Neighborhood character
- Diverse neighborhood (Simpson 0.59)
- Race & ethnicity
- White 61% Hispanic / Latino 17% Two or more races 12% Black 11% Asian 4%
- Hispanic origin (detail)
- Puerto Rican 10% Dominican 1%
- Common ancestry
- Romanian 7% Russian 6% Lithuanian 4%
- Foreign-born
- 17% · Canada, Jamaica, China
- Languages at home
- 77% English-only · Spanish 10% Other Indo-European 7% Other Asian/Pacific 2%
Political lean MEDSL · Naugatuck Valley
- 2024 margin
- Lean R (+7.4) · D 45.6% · R 53.0% · Other 1.4%
- All cycles
- 2024: R+7.4
Not yet ingested
- Civics
- —
Market trends
- HPI YoY
- ▼ -108.73%
- Current HPI
- 217.6177
- Rent YoY
- ▲ 6.23%
- Metro
- New Haven-Milford, CT
- State GDP YoY
- ▲ 1.06%
- F500 in state
- 38
Industry mix (Fortune 500 HQ in CT)
| Industry | F500 HQs | Revenue |
|---|---|---|
| Industrial Machinery | 4 | $38B |
|
||
| Insurance | 3 | $71B |
|
||
| Financial Services | 2 | $25B |
|
||
| Transportation / Logistics | 2 | $18B |
|
||
| Healthcare | 1 | $247B |
|
||
| Telecommunications | 1 | $55B |
|
||
Price history
+39483.3% since first listed4 events — show timeline
- 2026-05-20 Pending — Smart MLS
- 2026-05-08 Listed $475,000 Smart MLS
- 2024-03-12 Rental Removed $1,200 SMARTMLS
- 2024-03-04 Listed for Rent $1,200 SMARTMLS
Property tax history
+3.6%/yrLatest (2022): $7,008 · +0.0% YoY. Source: county tax records.
Cash-flow waterfall
monthlySold comps — $/sqft
last 12 mo · ≤1 miLoading sold comps…