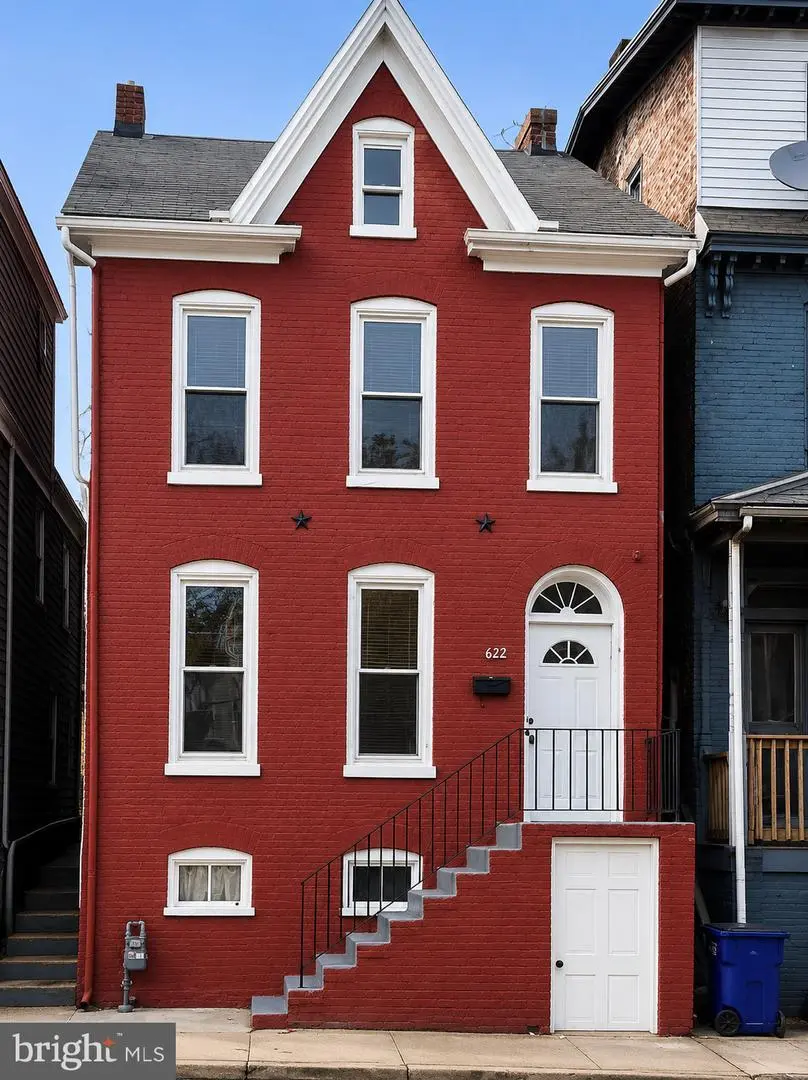
622 W Washington St · Hagerstown, MD
Flood risk 1/10 · Minimal
- FEMA flood zone
- X (unshaded)
- Chance of flooding over 30 yrs
- 0.0%
- Est. flood insurance / yr
- $473 – $860
Fire risk 1/10 · Minimal
- Est. fire insurance / yr
- $755 – $1,403
Heat risk 5/10 · Moderate
- Hot days now (above 101°F)
- 7 days/yr
- Hot days in 30 yrs
- 16 days/yr
Wind risk 2/10 · Minimal
- Chance of severe wind over 30 yrs
- 2.0%
Air-quality risk 2/10 · Minimal
- Unhealthy air days now
- 1 days/yr
- Unhealthy air days in 30 yrs
- 2 days/yr
Risk factors via First Street. Map © Google.
Why this score? — see what drove the D+ grade
The composite is a weighted blend of 9 inputs, each scored 0–100. Each bar is that input's sub-score; the figure is the points it added to the 100-point composite (weight × sub-score).
- Cash flow +16.1/30.0
- ARV discount +13.4/15.0
- DSCR +5.0/10.0
- Livability +3.9/5.0
- Rent growth +3.5/5.0
- 1% rule +3.4/10.0
- Condition / age +2.5/5.0
- Schools +2.3/10.0
- Appreciation +0.0/10.0
$195,000
🖨 Deal sheet (PDF) 📄 Offer letter ✓ Due diligence
Listing remarks MLS
Some renovations from when it was purchased in 2008. Large kitchen, separate dining room, fenced yard. Wells Fargo has approved $39,000. They need to net about $32,500 after closing costs. They are standing firm on this based on the appraisal.
Key facts
- 1,900 sq ft lot
- Built 1877
Property features AI
Exterior
- Parking: On-street parking
- Utilities: Public water; Public sewer; Natural gas heating and hot water
- Home design: Detached single-family home; Above-grade finished space and below-grade unfinished space
- Construction: Brick construction; Foundation described as other
- Exterior features: Detached structure; Not in a federal flood zone; Pets allowed on a case-by-case basis with pet addendum/deposit and size/weight restrictions
Interior
- Bedrooms: Three bedrooms on the lower level
- Bathrooms: One full bathroom (located on the lower level)
- Heating & cooling: Forced-air heating; Natural gas hot water
- Interior features: Finished above-grade living area reported by assessor; Unfinished lower-level area with interior access and outside entrance; Basement is unfinished
Neighborhood map
What this means for you Summary
Snapshot
- This is a 3-bed/1.0-bath single-family listed at $195k.
Deal economics
- At list price, monthly cash flow is $100 ($1k/yr) — positive.
- The deal already cash-flows at list — no discount required.
- To meet the 1% rule (rent ≥ 1% of price), the offer needs to be $164k (16.1% below list).
- Recommended offer: $164k (16.1% below list) — sets the bar for 1% rule.
- Cap rate 6.9% vs local median 4.4% in Hagerstown — top-decile yield for the area; either an underpriced asset or a hidden risk that comps aren't pricing in. Stress-test before assuming the spread holds.
Location & tenants
- Location reads 77/100 on livability (#83 in MD, #3,170 nationally) — a middle-class / working-renter tenant base. Strengths: commute A+, cost of living A+, health & safety A+; Watch: crime F, employment F.
- Washingtion County Public Schools (suburban): math 18% / reading 33% proficiency, ranked #13 of 24 in MD (top 54%) — low school quality limits family demand, transient renter base, plan for 1-2y turnover.
- Zoned schools: Western Heights Middle (math 6% / reading 30%, grade F, #165 of 225 statewide, top 75%, 903 students, 77% FRL); South Hagerstown High (math 30% / reading 63%, grade D-, #118 of 222 statewide, top 54%, 1,487 students, 78% FRL) — zoned schools average 78% FRL vs 39% district-wide (38 pts higher); higher-poverty schools than district average — tighter screening recommended.
- Market conditions: Rents rising fast (+4.0%/yr); 383 active listings in the ZIP; 40 comparable units currently listed for rent nearby; rentals lingering (median 46d on market — plan ~5-8 weeks vacancy on turnover, expect pricing pressure); 55% of comp listings sitting > 30 days — soft ceiling on asking rent; 232 units permitted in Washington County in 2024 (12 in 5+ unit buildings).
- This rent runs 31% of the median local income ($63k/yr) — at the standard rent-burdened threshold; future hikes will face affordability resistance.
Forward outlook
- Local home prices are declining (-3.0%/yr); year-one equity from $1k of loan paydown is wiped out by about $6k of value loss. Plan a longer hold.
Negotiation context
- Only 2 days on market — expect competitive offers; lowballing is unlikely to land.
- 10 sale attempts since 19y ago; this cycle's ask is 171% above the opening price — seller raised mid-cycle; expect resistance to lowballs.
- Current owner paid $39k; list at $195k implies a 400% gain — meaningful room to come down on a strong offer.
Risks & watch-outs
- Watch-outs: built in 1877 — expect roof / HVAC / electrical / plumbing capex.
- Climate carrying-cost: extreme-heat days projected 7→16/yr by 2055 (HVAC capex compounding) — expect insurance premiums to compound above CPI over the hold.
Questions for the listing agent
- Built in 1877 — when were the roof, HVAC, electrical panel, plumbing, and water heater last replaced?
- Is there a deadline driving the sale (1031 exchange, divorce, estate, relocation)? That informs how much negotiation room exists.
- Crime grade is F in this area — have there been break-ins, vandalism, or insurance claims at this property in the last 3 years? What carrier currently insures it and at what premium?
- The area grade is low — what's the realistic commute time and amenity access for the typical tenant pool here? Any planned neighborhood developments (good or bad) we should know about?
- What's the average days-on-market for RENTAL listings here right now (not sales)? A rising rental-DOM trend means longer vacancies and softer asking-rent achievability than the comps imply.
- What's the recent tenant-quality profile in this submarket — average credit score on applications, eviction rate, late-payment / NSF rate, and stable-employment percentage? A property-management company in the area should have these aggregated.
- How much new for-sale + rental construction is in the pipeline within 1–3 miles? Heavy new supply typically softens prices + rents 12–24 months out; constrained supply supports both.
Investment metrics
- 1% rule
- 0.84% ✗
- Cap rate
- 6.91%
- Cash-on-cash
- 2.19%
- DSCR
- 1.10
- GRM
- 9.9
CMA / ARV
- ARV (on-the-fly)
- $224,256
- Comps found
- 12
Show comp detail 12 sales within ~0.75 mi
| Address | Dist | Beds/Ba | Sqft | Sold | Price | $/sf | Match |
|---|---|---|---|---|---|---|---|
| 807 Washington Ave | 0.15mi | 4/1.0 (+1) | 1,544 (+0%) | 8mo | $165,000 | $107 | 80 |
| 527 W Church St | 0.25mi | 3/2.0 | 1,456 (-5%) | 4mo | $200,000 | $137 | 72 |
| 14 Avalon Ave | 0.27mi | 3/1.0 | 1,398 (-9%) | 4mo | $180,000 | $129 | 69 |
| 239 Devonshire Rd NE | 0.54mi | 3/1.0 | 1,544 (+0%) | 6mo | $226,000 | $146 | 69 |
| 116 Bethel St | 0.59mi | 3/2.0 | 1,538 (+0%) | 2mo | $87,500 | $57 | 67 |
| 217 James St | 0.29mi | 3/1.0 | 1,350 (-12%) | 1mo | $100,000 | $74 | 65 |
| 320 N Prospect St | 0.56mi | 4/1.5 (+1) | 1,558 (+1%) | 2mo | $163,000 | $105 | 63 |
| 426 Wyoming Ave | 0.59mi | 3/1.0 | 1,612 (+5%) | 8mo | $257,500 | $160 | 58 |
| 367 Devonshire Rd | 0.64mi | 3/1.5 | 1,390 (-10%) | 2mo | $328,000 | $236 | 50 |
| 432 Gandy Dancer Ct | 0.73mi | 4/2.5 (+1) | 1,514 (-1%) | 7mo | $250,000 | $165 | 47 |
| 70 Nottingham Rd | 0.49mi | 4/3.5 (+1) | 1,680 (+9%) | 2mo | $327,000 | $195 | 46 |
| 1114 W Washington St | 0.60mi | 2/2.0 (-1) | 1,762 (+15%) | 2mo | $269,900 | $153 | 37 |
Match score weights: distance 35% · size 25% · config 20% · recency 20%. Top-matched comps best support the ARV.
Projected returns pro-forma
-3.0% appreciation · 4.0% rent growth · sell at horizon
- IRR
- -11.9%
- Equity multiple
- 0.57×
- Total profit
- $-23,650
- Equity at exit
- $29,075
- IRR
- -1.5%
- Equity multiple
- 0.89×
- Total profit
- $-5,736
- Equity at exit
- $16,860
Cash invested: $54,600 (down + closing). Projections, not guarantees.
Landlord ↔ Tenant lean methodology
- Overall (STATE)
- 27 Tenant-Leaning
- State Maryland
- 27 Tenant-Leaning · D+14
- County
- — inherits STATE
- City
- — inherits STATE
ZIP-level market 21740
- Rents YoY
- 4.0%
- Active inventory
- 383
- Price-to-rent
- 9.9×
Monthly cashflow live
- Estimated rent
- $1,636 high interval (Pro) →
- Mortgage (P&I)
- −$1,023
- Tax from tax record
- −$88 /mo · $1,061/yr
- Insurance
- −$81
- HOA
- −$0
- Vacancy / Maint / Mgmt
- −$343
- Net cashflow
- $100
Break-even live
Sensitivity live
| Price | -10% $210 | -5% $155 | +0% $100 | +5% $45 | +10% $-11 |
|---|---|---|---|---|---|
| Rent | -10% $-29 | -5% $35 | +0% $100 | +5% $164 | +10% $229 |
| Rate | -1.0pp $198 | -0.5pp $149 | base $100 | +0.5pp $49 | +1.0pp $-2 |
UW: 25.0% down · 7.5% · 30yr · 1.5% tax · 5.0% vac · 8.0% maint · 8.0% mgmt
Financing live
Cash to close
- Down payment
- $48,750
- Closing costs
- $5,850
- Reserves months
- —
- Total cash needed
- —
Loan-product check · same deal, 3 products live
Conventional
25% down · 7.5% · 30yr
- Down + closing
- —
- Monthly P&I
- —
- Monthly cashflow
- —
- DSCR
- —
- Eligible?
- —
Personal DTI + credit; lowest rate.
DSCR
20% down · 8.5% · 30yr
- Down + closing
- —
- Monthly P&I
- —
- Monthly cashflow
- —
- DSCR
- —
- Eligible?
- —
No personal income docs; deal must DSCR.
Hard money
10% down · 12.0% · 12mo
- Down + closing
- —
- Monthly P&I
- —
- Monthly cashflow
- —
- DSCR
- —
- Eligible?
- —
Short-term bridge; refi at stabilization.
Rent comps 40 comps
| Address | Beds | Baths | Sqft | Rent | $/sqft | DOM | Units | Dist |
|---|---|---|---|---|---|---|---|---|
| 812 Dale St Hagerstown, MD | 3.0 | 1.0 | 1064 | $1,730 | $1.63 | 45d | 1 | 0.13mi |
| 625 George St Hagerstown, MD | 2.0 | 1.0 | 1856 | $1,400 | $0.75 | 15d | 1 | 0.16mi |
| 421 Salem Ave Hagerstown, MD | 3.0 | 1.0 | 1256 | $1,550 | $1.23 | 23d | 1 | 0.30mi |
| 607 Salem Ave Hagerstown, MD | 4.0 | 1.0 | 1344 | $1,775 | $1.32 | 45d | 1 | 0.31mi |
| 104 Buena Vista Ave Unit 104 Hagerstown, MD | 3.0 | 1.0 | 1100 | $1,400 | $1.27 | 45d | 1 | 0.43mi |
| 92 W Washington St Unit 405 Hagerstown, MD | 2.0 | 1.0 | 1083 | $1,650 | $1.52 | 45d | 1 | 0.53mi |
| 92 W Washington St Unit 410 Hagerstown, MD | 3.0 | 1.5 | 1415 | $1,795 | $1.27 | 45d | 1 | 0.53mi |
| 464 Peleton St Hagerstown, MD | 3.0 | 2.0 | 1253 | $2,025 | $1.62 | 15d | 1 | 0.56mi |
| 62 Bethel St Hagerstown, MD | 3.0 | 1.5 | 1088 | $1,700 | $1.56 | 45d | 1 | 0.63mi |
| 115 N Potomac St Unit 2 Hagerstown, MD | 2.0 | 1.0 | 1200 | $1,250 | $1.04 | 23d | 1 | 0.67mi |
| 409 Gandy Dancer Ct Hagerstown, MD | 4.0 | 3.5 | 2112 | $2,350 | $1.11 | 23d | 1 | 0.72mi |
| 409 Gandy Dancer Ct Unit 409 Hagerstown, MD | 4.0 | 3.5 | 2112 | $2,350 | $1.11 | 45d | 1 | 0.72mi |
| 440 Jonathan St Unit A Hagerstown, MD | 2.0 | 1.0 | 2244 | $1,000 | $0.45 | 45d | 1 | 0.73mi |
| 323 N Potomac St #1 Hagerstown, MD | 2.0 | 2.0 | 1800 | $1,505 | $0.84 | 23d | 1 | 0.73mi |
| 323 N Potomac St Unit 3 Hagerstown, MD | 3.0 | 2.0 | 2200 | $1,655 | $0.75 | 23d | 1 | 0.73mi |
| 323 N Potomac St Unit 2 Hagerstown, MD | 2.0 | 1.0 | 1700 | $1,380 | $0.81 | 23d | 1 | 0.73mi |
| 16 East Ave Hagerstown, MD | 4.0 | 1.0 | 2088 | $1,425 | $0.68 | 45d | 1 | 0.73mi |
| 42 E Franklin St Hagerstown, MD | 3.0 | 1.5 | 1200 | $1,350 | $1.12 | 45d | 1 | 0.77mi |
| 60 E Washington St Apt 1E Hagerstown, MD | 3.0 | 1.5 | 1300 | $1,500 | $1.15 | 23d | 1 | 0.79mi |
| 103 E Washington St Unit 1E Hagerstown, MD | 3.0 | 1.0 | 1200 | $1,200 | $1.00 | 15d | 1 | 0.83mi |
| 210 N Locust St Hagerstown, MD | 3.0 | 1.0 | 1476 | $1,275 | $0.86 | 23d | 1 | 0.86mi |
| 115 East Ave Unit 2 Hagerstown, MD | 2.0 | 1.0 | 1200 | $1,400 | $1.17 | 45d | 1 | 0.87mi |
| 307 N Locust St Hagerstown, MD | 3.0 | 1.0 | 1140 | $1,490 | $1.31 | 45d | 1 | 0.87mi |
| 629 Oak Hill Ave Unit 3 Hagerstown, MD | 2.0 | 1.0 | 1386 | $1,595 | $1.15 | 45d | 1 | 0.88mi |
| 326 S Potomac St #1 Hagerstown, MD | 2.0 | 1.0 | 1050 | $1,400 | $1.33 | 45d | 1 | 0.89mi |
| 326 S Potomac St #2 Hagerstown, MD | 2.0 | 1.0 | 1350 | $1,500 | $1.11 | 45d | 1 | 0.89mi |
| 338 S Locust St Hagerstown, MD | 3.0 | 1.5 | 1320 | $1,600 | $1.21 | 23d | 1 | 0.93mi |
| 235 East Ave Hagerstown, MD | 2.0 | 1.0 | 1200 | $1,200 | $1.00 | 15d | 1 | 1.00mi |
| 715 Oak Hill Ave Unit 2N Hagerstown, MD | 2.0 | 1.0 | 1500 | $1,595 | $1.06 | 45d | 1 | 1.01mi |
| 715 Oak Hill Ave Unit 3N Hagerstown, MD | 2.0 | 1.0 | 1200 | $1,395 | $1.16 | 15d | 1 | 1.01mi |
| 322 N Cannon Ave Hagerstown, MD | 3.0 | 1.5 | 1488 | $1,800 | $1.21 | 15d | 1 | 1.05mi |
| 311 Jefferson St Unit 311 Hagerstown, MD | 3.0 | 1.5 | 1200 | $1,550 | $1.29 | 45d | 1 | 1.06mi |
| 109 Fairground Ave Hagerstown, MD | 3.0 | 1.0 | 1470 | $1,600 | $1.09 | 15d | 1 | 1.10mi |
| 1026 Lindsay Ln Hagerstown, MD | 3.0 | 4.0 | 1920 | $2,200 | $1.15 | 45d | 1 | 1.14mi |
| 313 Frederick St Hagerstown, MD | 3.0 | 1.5 | 1650 | $2,500 | $1.52 | 45d | 1 | 1.15mi |
| 313 Frederick St Unit 313 Hagerstown, MD | 3.0 | 1.5 | 1650 | $2,500 | $1.52 | 45d | 1 | 1.15mi |
| 828 Hamilton Blvd Unit B Hagerstown, MD | 2.0 | 1.0 | 1512 | $1,495 | $0.99 | 45d | 1 | 1.18mi |
| 837 Virginia Ave Hagerstown, MD | 3.0 | 2.0 | 1400 | $2,000 | $1.43 | 15d | 1 | 1.19mi |
| 805 Mulberry Ave Hagerstown, MD | 3.0 | 1.5 | 1584 | $1,830 | $1.16 | 45d | 1 | 1.23mi |
| 612 Frederick St Hagerstown, MD | 4.0 | 2.0 | 1422 | $1,875 | $1.32 | 23d | 1 | 1.40mi |
Listing history 3 events
-
2026-06-10days on market $195,000 Coming Soon 2 DOM
-
2026-06-09remarks 500-char remark
-
2026-06-09$195,000 Coming Soon 1 DOM
ⓘ Source: listings_history table (triggers on properties + properties_extension) + one-shot
backfill from property_details.listing_events for pre-trigger history.
Tax reassessment forecast MD · Partial reset (capped growth)
- Current annual tax
- $1,061 · $88/mo
- Projected year-2 tax
- $1,593 · $133/mo
- Expected delta
- +$532/yr (+$44/mo · 50.1%)
ⓘ Screening estimate from a state-policy table — verify with the county assessor before closing.
Climate risk First Street
- Flood 1/10 Low FEMA zone X (unshaded) · 0% chance over 30 yrs
- Wildfire 1/10 Low
- Heat 5/10 Major 7 d/yr ≥101°F today · 16 d/yr by 30 yrs out
- Wind 2/10 Low 2% chance of damaging wind over 30 yrs
- Air quality 2/10 Low 1 unhealthy d/yr today · 2 by 30 yrs out
Nearby sold comps map
Loading sold comps map…
Walkable amenities ~0.75 mi
Loading nearby amenities…
Taxation est. · year 1
- Rental income
- $19,627
- − Mortgage interest
- −$10,923
- − Property taxes
- −$1,061
- − Insurance
- −$975
- − Repairs & maintenance
- −$1,570
- − Management
- −$1,570
- − Depreciation
- −$5,673
- Taxable loss
- −$2,146
- Est. tax savings @ 24.0%
- +$515
- After-tax cash flow
- $1,713/yr
For passive investors: Depreciation is non-cash, so a rental often shows a tax loss while cash-flowing — sheltering income. Rental losses are passive: they offset passive income freely, and up to $25,000/yr can offset ordinary (W-2) income if you actively participate and your MAGI is under $100k (phasing out to $0 by $150k); unused losses carry forward. On sale, claimed depreciation is recaptured at up to 25%, and gains may owe capital-gains tax (a 1031 exchange can defer both). Figures are a year-1 estimate at your 24.0% rate — not tax advice; consult a CPA.
Schools (NCES district)
- District
- Washingtion County Public Schools
- NCES district ID
- 2400660
- Math proficiency
- 18% ▼ -20.00%
- Reading proficiency
- 33% ▼ -17.00%
- Median HH income
- $54,784
- Composite
- 22.87/100
- National rank
- #8007
- State rank
- #13 of 24 in MD
Livability — Hagerstown
- Score
- 77/100
- State rank
- #83
- US rank
- #3170
Category grades
Schools grade is shown separately in the Schools card above.
Census & demographics
- Census place
- Hagerstown, MD
- County
- Washington County · 98,861 people
- City population
- 64,792
- Metro
- Hagerstown-Martinsburg, MD-WV
- Population (ZIP)
- 64,792
- Household income
- $62,873
- Rent vs Own
- Severe rent burden
- 2832.0
Population outlook (Washington County) Hauer SSP2
- Today (2025)
- 151,614 people
- By 2030
- 151,455 · -0.1%
- By 2040
- 150,097 · -1.0%
- By 2050
- 148,193 · -2.3%
- By 2075
- 146,581 · -3.3%
- By 2100
- 138,025 · -9.0%
Race, ethnicity, and origin ACS 2023
- Neighborhood character
- Majority White (64%)
- Race & ethnicity
- White 64% Black 18% Two or more races 10% Hispanic / Latino 10% Asian 2%
- Hispanic origin (detail)
- Mexican 2% Puerto Rican 2% Dominican 2%
- Common ancestry
- Romanian 2% Lithuanian 1% Slovak 1%
- Foreign-born
- 9% · Canada, China
- Languages at home
- 86% English-only · Spanish 9% French/Haitian/Cajun 1% Chinese 1%
Political lean MEDSL · Washington
- 2024 margin
- Strong R (+23.0) · D 37.3% · R 60.4% · Other 2.3%
- 2008→2024 swing
- -10.2pp toward R · 2008: -12.9pp · 2024: -23.0pp
- All cycles
- 2024: R+23.0 2020: R+20.9 2016: R+32.4 2012: R+18.5 2008: R+12.9
Not yet ingested
- Civics
- —
Market trends
- HPI YoY
- ▼ -248.38%
- Current HPI
- 264.8018
- Rent YoY
- ▲ 4.00%
- Metro
- Hagerstown-Martinsburg, MD-WV
- State GDP YoY
- ▲ 2.97%
- F500 in state
- 12
Industry mix (Fortune 500 HQ in MD)
| Industry | F500 HQs | Revenue |
|---|---|---|
| Aerospace / Defense | 1 | $71B |
|
||
| Utilities | 1 | $25B |
|
||
| Hotels | 1 | $24B |
|
||
| Consumer Goods | 1 | $7B |
|
||
| Real Estate | 1 | $6B |
|
||
| Chemicals | 1 | $2B |
|
||
Price history
+1118.8% since first listed45 events — show timeline
- 2026-06-08 Coming Soon $195,000 BRIGHT MLS
- 2018-06-26 Sold (MLS) $39,000 MRIS
- 2018-06-26 Sold (MLS) $39,000 BRIGHT MLS
- 2018-05-31 Contingent — BRIGHT MLS
- 2018-05-31 Pending — MRIS
- 2018-05-16 Relisted — MRIS
- 2018-05-16 Relisted — BRIGHT MLS
- 2018-05-14 Contingent — BRIGHT MLS
- 2018-05-14 Contingent — MRIS
- 2018-04-12 Price Changed $39,000 BRIGHT MLS
- 2018-04-12 Price Changed $39,000 MRIS
- 2018-04-09 Relisted — BRIGHT MLS
- 2018-04-09 Relisted — MRIS
- 2018-03-19 Pending — BRIGHT MLS
- 2018-03-02 Listed — BRIGHT MLS
- 2018-02-26 Pending — MRIS
- 2018-02-19 Price Changed $44,500 MRIS
- 2017-12-09 Price Changed $59,900 MRIS
- 2017-11-28 Listed $72,000 MRIS
- 2017-11-28 Listed $44,500 BRIGHT MLS
- 2009-11-12 Sold (Public Records) $99,900 Public Records
- 2009-01-05 Delisted — MRIS
- 2008-12-31 Price Changed — MRIS
- 2008-12-30 Price Changed — MRIS
- 2008-12-29 Price Changed — MRIS
- 2008-12-28 Price Changed — MRIS
- 2008-12-27 Price Changed — MRIS
- 2008-12-22 Price Changed — MRIS
- 2008-11-19 Price Changed — MRIS
- 2008-11-14 Price Changed — MRIS
- 2008-09-19 Price Changed — MRIS
- 2008-09-18 Price Changed — MRIS
- 2008-09-02 Price Changed — MRIS
- 2008-08-23 Price Changed — MRIS
- 2008-08-22 Delisted — MRIS
- 2008-08-22 Listed — MRIS
- 2008-08-19 Price Changed — MRIS
- 2008-08-13 Price Changed — MRIS
- 2008-07-19 Price Changed — MRIS
- 2008-06-26 Price Changed — MRIS
- 2008-02-16 Listed — MRIS
- 2007-09-01 Delisted — MRIS
- 2007-04-26 Listed — MRIS
- 2005-06-06 Sold (Public Records) $129,000 Public Records
- 1981-04-22 Sold (Public Records) $16,000 Public Records
Property tax history
-1.2%/yrLatest (2025): $1,061 · +11.2% YoY. Source: county tax records.
Cash-flow waterfall
monthlySold comps — $/sqft
last 12 mo · ≤1 miLoading sold comps…