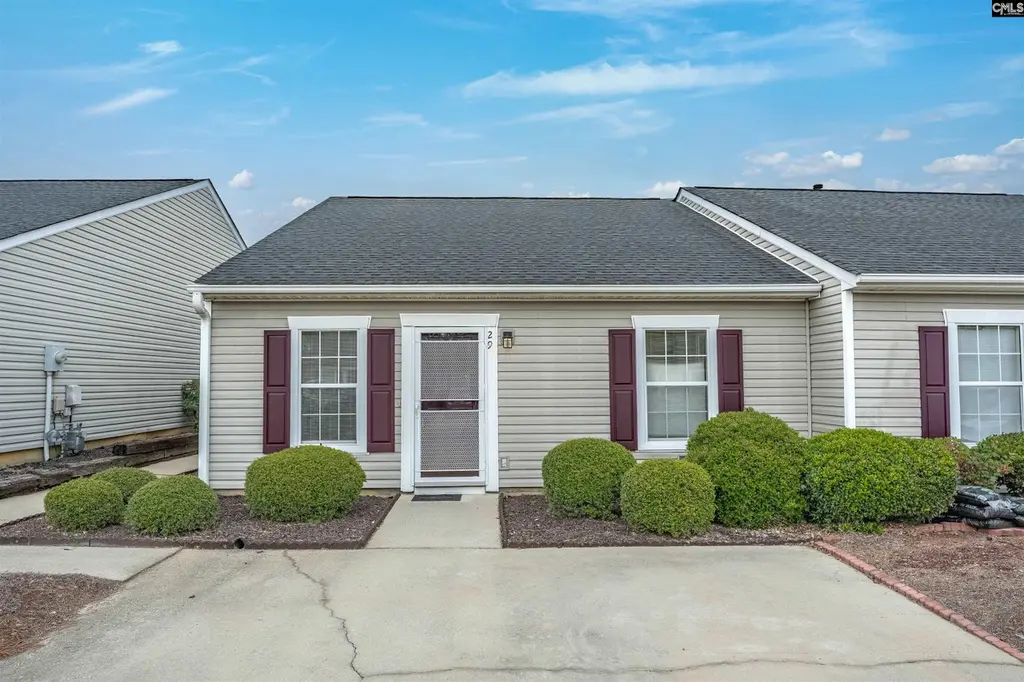
29 Hampton Oaks Pl · Columbia, SC
Flood risk 1/10 · Minimal
- FEMA flood zone
- X (unshaded)
- Chance of flooding over 30 yrs
- 0.0%
- Est. flood insurance / yr
- $507 – $1,088
Fire risk 3/10 · Minor
- Est. fire insurance / yr
- $783 – $1,453
Heat risk 7/10 · Major
- Hot days now (above 108°F)
- 7 days/yr
- Hot days in 30 yrs
- 16 days/yr
Wind risk 6/10 · Moderate
- Chance of severe wind over 30 yrs
- 59.0%
Air-quality risk 3/10 · Minor
- Unhealthy air days now
- 2 days/yr
- Unhealthy air days in 30 yrs
- 3 days/yr
Risk factors via First Street. Map © Google.
Why this score? — see what drove the D grade
The composite is a weighted blend of 9 inputs, each scored 0–100. Each bar is that input's sub-score; the figure is the points it added to the 100-point composite (weight × sub-score).
- Cash flow +10.2/30.0
- ARV discount +7.5/15.0
- Appreciation +5.0/10.0
- Livability +3.9/5.0
- 1% rule +3.8/10.0
- DSCR +2.9/10.0
- Schools +2.6/10.0
- Rent growth +2.5/5.0
- Condition / age +2.5/5.0
$170,000
🖨 Deal sheet (PDF) 📄 Offer letter ✓ Due diligence
Listing remarks
Keep it simple. This 2 bedroom 2 bath patio home is perfect. Great Location and Minutes to Harbison and I-26. This 2 bedroom 2 bath home has a nice open floor with dining area overlooking your living area and fireplace. Your galley kitchen is perfect for prepping meals and enjoying friends and family on your back covered patio. Your walk in closet has a pull down attic for all your storage needs. Bedroom 2 has a private entry to hall bath and makes it perfect for guests. This home is situated in a quiet residential neighborhood with easy access to local amenities. There is an additional association fee for the Harbsion Community Center. Which provides an indoor pool, gym, walking trails, la
Key facts
- $100 HOA
- 2 parking spots
- Built 2021
Property features AI
Finance
- HOA & community: Homeowners association present; Association fee covers common area maintenance
Exterior
- Parking: 2 parking spaces
- Utilities: Public water; Public sewer
- Home design: Single-story home
- Construction: Vinyl exterior; Slab foundation
- Exterior features: Partial gutters; Covered back porch; Paved road
Interior
- Kitchen: Formica countertops; Vinyl flooring; Glazed cabinets; Dishwasher; Refrigerator; Range (built-in and free-standing)
- Bedrooms: Master bedroom on the main level with a walk-in closet and carpeted floors; Second bedroom on the main level with carpeted floors and shared tub/shower bath
- Flooring: Carpet in bedrooms; Vinyl in the kitchen
- Bathrooms: Two full bathrooms
- Heating & cooling: Central heating; Central air conditioning
- Interior features: One fireplace; Built-in and free-standing range
- Laundry & utility: Laundry closet on the main level; Dryer; Tankless water heater
Neighborhood map
What this means for you Summary
Snapshot
- This is a 2-bed/2.0-bath townhouse listed at $170k.
Deal economics
- At list price, monthly cash flow is $-97 ($-1k/yr) — negative.
- To cash-flow at today's rent, offer at most $156k (8.2% below list).
- To meet the 1% rule (rent ≥ 1% of price), the offer needs to be $149k (12.3% below list).
- Recommended offer: $149k (12.3% below list) — sets the bar for 1% rule.
Location & tenants
- Location reads 78/100 on livability (#18 in SC, #2,436 nationally) — a middle-class / working-renter tenant base. Strengths: amenities A+, commute A+, cost of living A+; Watch: employment D, crime F.
- Richland 01 (urban): math 26% / reading 36% proficiency, ranked #54 of 80 in SC (top 68%) — families likely to look elsewhere, expect single-tenant / working-renter base with shorter leases; 64% free/reduced lunch — lower-income household profile, screen leases tightly.
- Zoned schools: Pine Grove Elementary (math 24% / reading 15%, grade F, #496 of 597 statewide, top 83%, 541 students, 100% FRL); St. Andrews Middle (math 9% / reading 18%, grade F, #207 of 229 statewide, top 91%, 706 students, 100% FRL); Columbia High (math 17% / reading 67%, grade F, #174 of 196 statewide, top 90%, 665 students, 100% FRL) — zoned schools average 100% FRL vs 64% district-wide (36 pts higher); higher-poverty schools than district average — tighter screening recommended.
- Market conditions: 1 active listings in the ZIP; 17 comparable units currently listed for rent nearby; rentals at typical pace (median 21d on market — plan ~3-4 weeks tenant-placement turnaround); 3,472 units permitted in Richland County in 2024 (1,096 in 5+ unit buildings).
Forward outlook
- In year one you build about $6k of equity ($1k loan paydown + $5k appreciation (3.0% local appreciation)).
- Richland County population projected at +30% by 2050 — long-run rental-demand tailwind backs the buy-and-hold thesis.
- By year 6, paydown + projected appreciation supports a ~$33k cash-out refi (75% LTV) — recoverable capital for the next deal without selling this one.
Negotiation context
- It's been on market 52 days — a 3% lower offer ($165k) is reasonable based on typical stale-listing flexibility.
- Current owner paid $89k; list at $170k implies a 91% gain — meaningful room to come down on a strong offer.
Risks & watch-outs
- Climate carrying-cost: major wind risk, 59% chance of damaging wind over 30y; extreme-heat days projected 7→16/yr by 2055 (HVAC capex compounding) — expect insurance premiums to compound above CPI over the hold.
Questions for the listing agent
- What do current leases actually rent for vs. the listed asking? Can we see a recent rent roll and the last 12 months of T-12 income?
- It's been on market 52 days. Have you received any prior offers? Is the seller open to a 12% concession, seller financing, or rate buy-down credit?
- What does the HOA fee cover, when was the last increase, and are there any pending special assessments or reserve-fund shortfalls?
- Is there a deadline driving the sale (1031 exchange, divorce, estate, relocation)? That informs how much negotiation room exists.
- Schools are D-rated, which usually means shorter tenancies and higher turnover. Who's the typical renter profile here, and what's been the actual vacancy rate?
- Crime grade is F in this area — have there been break-ins, vandalism, or insurance claims at this property in the last 3 years? What carrier currently insures it and at what premium?
- The area grade is low — what's the realistic commute time and amenity access for the typical tenant pool here? Any planned neighborhood developments (good or bad) we should know about?
- What's the average days-on-market for RENTAL listings here right now (not sales)? A rising rental-DOM trend means longer vacancies and softer asking-rent achievability than the comps imply.
- What's the recent tenant-quality profile in this submarket — average credit score on applications, eviction rate, late-payment / NSF rate, and stable-employment percentage? A property-management company in the area should have these aggregated.
- How much new for-sale + rental construction is in the pipeline within 1–3 miles? Heavy new supply typically softens prices + rents 12–24 months out; constrained supply supports both.
Investment metrics
- 1% rule
- 0.88% ✗
- Cap rate
- 5.61%
- Cash-on-cash
- -2.44%
- DSCR
- 0.89
- GRM
- 9.5
CMA / ARV
No comps found within radius.
Projected returns pro-forma
3.0% appreciation · 3.0% rent growth · sell at horizon
- IRR
- 5.3%
- Equity multiple
- 1.30×
- Total profit
- $14,391
- Equity at exit
- $76,439
- IRR
- 8.3%
- Equity multiple
- 2.26×
- Total profit
- $60,023
- Equity at exit
- $117,802
Cash invested: $47,600 (down + closing). Projections, not guarantees.
Landlord ↔ Tenant lean methodology
- Overall (STATE)
- 90 Strongly Landlord-Friendly
- State South Carolina
- 90 Strongly Landlord-Friendly · R+6
- County
- — inherits STATE
- City
- — inherits STATE
ZIP-level market 29212-3559
- Active inventory
- 1
- Price-to-rent
- 9.5×
Monthly cashflow live
- Estimated rent
- $1,491 high interval (Pro) →
- Mortgage (P&I)
- −$891
- Tax est. 1.5%
- −$212 /mo · $2,550/yr
- Insurance
- −$71
- HOA
- −$100
- Vacancy / Maint / Mgmt
- −$313
- Net cashflow
- $-97
Break-even live
Sensitivity live
| Price | -10% $21 | -5% $-38 | +0% $-97 | +5% $-156 | +10% $-214 |
|---|---|---|---|---|---|
| Rent | -10% $-215 | -5% $-156 | +0% $-97 | +5% $-38 | +10% $21 |
| Rate | -1.0pp $-11 | -0.5pp $-54 | base $-97 | +0.5pp $-141 | +1.0pp $-186 |
UW: 25.0% down · 7.5% · 30yr · 1.5% tax · 5.0% vac · 8.0% maint · 8.0% mgmt
Financing live
Cash to close
- Down payment
- $42,500
- Closing costs
- $5,100
- Reserves months
- —
- Total cash needed
- —
Loan-product check · same deal, 3 products live
Conventional
25% down · 7.5% · 30yr
- Down + closing
- —
- Monthly P&I
- —
- Monthly cashflow
- —
- DSCR
- —
- Eligible?
- —
Personal DTI + credit; lowest rate.
DSCR
20% down · 8.5% · 30yr
- Down + closing
- —
- Monthly P&I
- —
- Monthly cashflow
- —
- DSCR
- —
- Eligible?
- —
No personal income docs; deal must DSCR.
Hard money
10% down · 12.0% · 12mo
- Down + closing
- —
- Monthly P&I
- —
- Monthly cashflow
- —
- DSCR
- —
- Eligible?
- —
Short-term bridge; refi at stabilization.
Rent comps 17 comps
| Address | Beds | Baths | Sqft | Rent | $/sqft | DOM | Units | Dist |
|---|---|---|---|---|---|---|---|---|
| 51 Heritage Village Ln Unit 1 Columbia, SC | 2.0 | 2.0 | 1150 | $1,400 | $1.22 | 25d | 1 | 0.10mi |
| 14 Heritage Village Ln Columbia, SC | 2.0 | 2.0 | 1100 | $2,150 | $1.95 | 25d | 1 | 0.24mi |
| 801 Chinquapin Rd Columbia, SC | 1.0–2.0 | 1.0–1.5 | 729 | $1,200 | $1.64 | 5d | 7 | 0.35mi |
| 171 Winding Chestnut Dr Columbia, SC | 3.0 | 2.5 | 1335 | $1,975 | $1.48 | 25d | 1 | 0.43mi |
| 217 Wynn Way Unit B Columbia, SC | 2.0 | 1.5 | 1160 | $1,095 | $0.94 | 21d | 1 | 0.47mi |
| 846 Piney Grove Rd Columbia, SC | 3.0 | 2.5 | 1400 | $1,495 | $1.07 | 25d | 1 | 0.53mi |
| 135 Hunters Grove Dr Columbia, SC | 3.0 | 2.5 | 1428 | $1,595 | $1.12 | 23d | 1 | 0.55mi |
| 1335 Cactus Ave Columbia, SC | 3.0 | 2.0 | 1155 | $1,450 | $1.26 | 16d | 1 | 0.67mi |
| 100 Fairforest Rd Columbia, SC | 2.0 | 1.5 | 1150 | $1,224 | $1.06 | 5d | 3 | 0.80mi |
| 121 Manorwood Ct Unit C Columbia, SC | 2.0 | 1.5 | 1120 | $1,095 | $0.98 | 25d | 1 | 0.83mi |
| 105 Manorwood Ct Columbia, SC | 2.0 | 1.5 | 1000 | $1,150 | $1.15 | 25d | 1 | 0.89mi |
| 500 Harbison Blvd Columbia, SC | 2.0–3.0 | 2.0–3.0 | 1152 | $1,584 | $1.38 | 4d | 11 | 1.01mi |
| 408 Foxfire Dr Columbia, SC | 1.0–3.0 | 1.0–2.0 | 1016 | $1,092 | $1.08 | 5d | 7 | 1.03mi |
| 405 Harbison Blvd #123 Columbia, SC | 1.0 | 1.5 | 900 | $1,125 | $1.25 | 5d | 1 | 1.05mi |
| 4248 Donavan Dr Columbia, SC | 3.0 | 2.0 | 1231 | $1,586 | $1.29 | 21d | 1 | 1.14mi |
| 6 Forestgrove Ct Columbia, SC | 3.0 | 2.0 | 1066 | $1,599 | $1.50 | 23d | 1 | 1.19mi |
| 1473 Haviland Cir Columbia, SC | 3.0 | 2.0 | 1425 | $1,499 | $1.05 | 13d | 1 | 1.19mi |
HOA detail
- Monthly dues
- $100 · $1,200/yr
- Likely covers
- poolgym
Listing history 18 events
-
2026-06-21days on market $170,000 Active 52 DOM
-
2026-06-18days on market $170,000 Active 49 DOM
-
2026-06-17days on market $170,000 Active 48 DOM
-
2026-06-16days on market $170,000 Active 47 DOM
-
2026-06-15days on market $170,000 Active 46 DOM
-
2026-06-14days on market $170,000 Active 44 DOM
-
2026-06-10days on market $170,000 Active 41 DOM
-
2026-06-09days on market $170,000 Active 40 DOM
-
2026-06-08days on market $170,000 Active 39 DOM
-
2026-06-07days on market $170,000 Active 38 DOM
-
2026-06-03days on market $170,000 Active 34 DOM
-
2026-06-03days on market $170,000 Active 33 DOM
-
2026-06-01days on market $170,000 Active 32 DOM
-
2026-05-31days on market $170,000 Active 31 DOM
-
2026-04-30$170,000 Active
-
2007-07-03soldstatus $89,020
-
2001-03-22soldstatus $73,000
-
1999-10-05soldstatus $64,900
ⓘ Source: listings_history table (triggers on properties + properties_extension) + one-shot
backfill from property_details.listing_events for pre-trigger history.
Climate risk First Street
- Flood 1/10 Low FEMA zone X (unshaded) · 0% chance over 30 yrs
- Wildfire 3/10 Moderate
- Heat 7/10 Severe 7 d/yr ≥108°F today · 16 d/yr by 30 yrs out
- Wind 6/10 Major 59% chance of damaging wind over 30 yrs
- Air quality 3/10 Moderate 2 unhealthy d/yr today · 3 by 30 yrs out
Nearby sold comps map
Loading sold comps map…
Walkable amenities ~0.75 mi
Loading nearby amenities…
Taxation est. · year 1
- Rental income
- $17,893
- − Mortgage interest
- −$9,523
- − Property taxes
- −$2,550
- − Insurance
- −$850
- − Repairs & maintenance
- −$1,431
- − Management
- −$1,431
- − HOA
- −$1,200
- − Depreciation
- −$4,945
- Taxable loss
- −$4,038
- Est. tax savings @ 24.0%
- +$969
- After-tax cash flow
- $-194/yr
For passive investors: Depreciation is non-cash, so a rental often shows a tax loss while cash-flowing — sheltering income. Rental losses are passive: they offset passive income freely, and up to $25,000/yr can offset ordinary (W-2) income if you actively participate and your MAGI is under $100k (phasing out to $0 by $150k); unused losses carry forward. On sale, claimed depreciation is recaptured at up to 25%, and gains may owe capital-gains tax (a 1031 exchange can defer both). Figures are a year-1 estimate at your 24.0% rate — not tax advice; consult a CPA.
Schools (NCES district)
- District
- Richland 01
- NCES district ID
- 4503360
- Math proficiency
- 26% ▼ -7.00%
- Reading proficiency
- 36% ▼ -5.00%
- Median HH income
- $38,931
- Composite
- 25.94/100
- National rank
- #7335
- State rank
- #54 of 80 in SC
Livability — Columbia
- Score
- 78/100
- State rank
- #18
- US rank
- #2436
Category grades
Schools grade is shown separately in the Schools card above.
Census & demographics
- Census place
- Columbia, SC
Population outlook (Richland County) Hauer SSP2
- Today (2025)
- 459,667 people
- By 2030
- 487,524 · +6.1%
- By 2040
- 542,035 · +17.9%
- By 2050
- 595,371 · +29.5%
- By 2075
- 732,998 · +59.5%
- By 2100
- 820,415 · +78.5%
Not yet ingested
- Political lean
- —
- Race & ethnicity
- —
- Common origin
- —
- Civics
- —
Market trends
- HPI YoY
- —
- Current HPI
- —
- Rent YoY
- —
- Metro
- —
- State GDP YoY
- ▲ 4.51%
- F500 in state
- 2
Industry mix (Fortune 500 HQ in SC)
| Industry | F500 HQs | Revenue |
|---|---|---|
| Packaging | 1 | $7B |
|
||
Price history
+161.9% since first listed4 events — show timeline
- 2026-04-30 Listed $170,000 Consolidated MLS
- 2007-07-03 Sold (Public Records) $89,020 Public Records
- 2001-03-22 Sold (Public Records) $73,000 Public Records
- 1999-10-05 Sold (Public Records) $64,900 Public Records
Property tax history
-6.4%/yrLatest (2025): $297 · +3.5% YoY. Source: county tax records.
Cash-flow waterfall
monthlySold comps — $/sqft
last 12 mo · ≤1 miLoading sold comps…