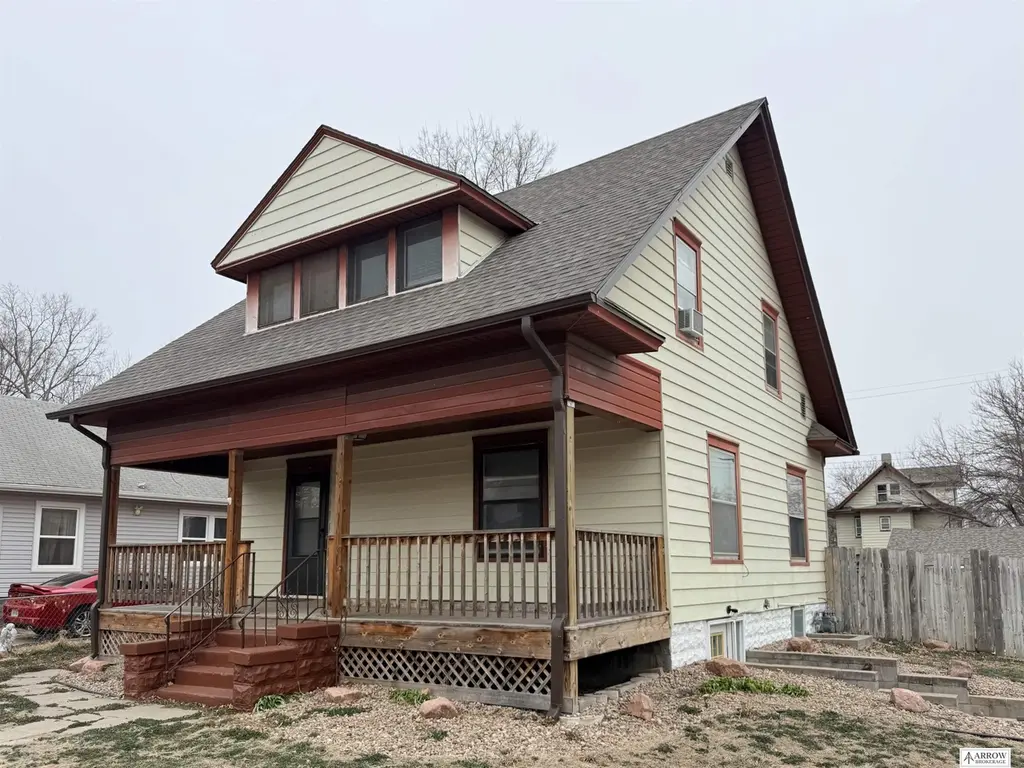
2840 Starr St · Lincoln, NE
Flood risk 1/10 · Minimal
- FEMA flood zone
- X (unshaded)
- Chance of flooding over 30 yrs
- 0.0%
- Est. flood insurance / yr
- $473 – $860
Fire risk 1/10 · Minimal
- Est. fire insurance / yr
- $1,161 – $2,155
Heat risk 3/10 · Minor
- Hot days now (above 104°F)
- 7 days/yr
- Hot days in 30 yrs
- 16 days/yr
Wind risk 2/10 · Minimal
- Chance of severe wind over 30 yrs
- —
Air-quality risk 1/10 · Minimal
- Unhealthy air days now
- 0 days/yr
- Unhealthy air days in 30 yrs
- 0 days/yr
Risk factors via First Street. Map © Google.
Why this score? — see what drove the D+ grade
The composite is a weighted blend of 9 inputs, each scored 0–100. Each bar is that input's sub-score; the figure is the points it added to the 100-point composite (weight × sub-score).
- Cash flow +15.8/30.0
- ARV discount +7.5/15.0
- DSCR +4.9/10.0
- Schools +4.4/10.0
- Livability +4.2/5.0
- 1% rule +3.8/10.0
- Rent growth +3.1/5.0
- Condition / age +2.5/5.0
- Appreciation +0.0/10.0
$199,900
🖨 Deal sheet 📄 Offer letter ✓ Due diligence
Listing remarks
Exceptional investment opportunity with this vacant duplex situated on a corner lot! Offering flexibility for both investors and owner-occupants, this property features a fenced backyard and convenient off-street parking accessible from the alley. Unit 1 showcases timeless charm with beautiful original woodwork and character throughout. Enjoy a spacious front porch along with a well-designed layout featuring a large living room, formal dining area, kitchen, and full bathroom on the main level. Upstairs, you’ll find three comfortable bedrooms and an additional full bathroom. The unit also includes access to the basement and backyard, adding to its functionality and appeal. Unit 2 offer
Key facts
- Spacious front porch
- Vacant duplex
- Original woodwork
Tags
Neighborhood map
What this means for you Summary
Snapshot
- This is a 3-bed/3.0-bath other listed at $200k.
Deal economics
- At list price, monthly cash flow is $91 ($1k/yr) — positive.
- The deal already cash-flows at list — no discount required.
- To meet the 1% rule (rent ≥ 1% of price), the offer needs to be $175k (12.2% below list).
- Recommended offer: $175k (12.2% below list) — sets the bar for 1% rule.
- Cap rate 6.8% vs local median 3.0% in Lincoln — top-decile yield for the area; either an underpriced asset or a hidden risk that comps aren't pricing in. Stress-test before assuming the spread holds.
Location & tenants
- Location reads 85/100 on livability (#5 in NE, #545 nationally) — a professional / high-income tenant draw. Strengths: amenities A+, cost of living A+, housing A+; Watch: crime D+.
- Lincoln Public Schools (urban): math 50% / reading 53% proficiency, ranked #59 of 111 in NE (top 53%) — acceptable for families but not a draw, mixed tenant base, ~2y average lease.
- Zoned schools: Clinton Elementary School (math 32% / reading 32%, grade F, #405 of 502 statewide, top 84%, 407 students, 0% FRL); Culler Middle School (math 30% / reading 33%, grade F, #109 of 128 statewide, top 85%, 703 students, 74% FRL); Lincoln Northeast High School (math 34% / reading 36%, grade F, #207 of 261 statewide, top 79%, 1,812 students, 62% FRL).
- Zoned-school proficiency averages 33% at this address vs 52% district-wide (-19 pts) — the specific schools serving this property underperform the Lincoln Public Schools average; the district grade overstates school quality for this exact location.
- Market conditions: Rents rising (+2.4%/yr); 56 active listings in the ZIP; 12 comparable units currently listed for rent nearby; rentals lingering (median 44d on market — plan ~5-8 weeks vacancy on turnover, expect pricing pressure); 75% of comp listings sitting > 30 days — soft ceiling on asking rent; 1,940 units permitted in Lancaster County in 2024 (895 in 5+ unit buildings).
- This rent runs 39% of the median local income ($54k/yr) — at the standard rent-burdened threshold; future hikes will face affordability resistance.
Forward outlook
- Local home prices are declining (-3.0%/yr); year-one equity from $1k of loan paydown is wiped out by about $6k of value loss. Plan a longer hold.
- Lancaster County population projected at +37% by 2050 — long-run rental-demand tailwind backs the buy-and-hold thesis.
Negotiation context
- It's been on market 15 days — a 2% lower offer ($197k) is reasonable based on typical stale-listing flexibility.
- Current owner paid $93k; list at $200k implies a 115% gain — meaningful room to come down on a strong offer.
Risks & watch-outs
- Watch-outs: built in 1926 — expect roof / HVAC / electrical / plumbing capex.
Questions for the listing agent
- Built in 1926 — when were the roof, HVAC, electrical panel, plumbing, and water heater last replaced?
- Is there a deadline driving the sale (1031 exchange, divorce, estate, relocation)? That informs how much negotiation room exists.
- Schools are A-rated — typically a magnet for longer-tenancy family renters. What's the average tenant stay here, and is there a school-zone premium baked into asking?
- Crime grade is D in this area — have there been break-ins, vandalism, or insurance claims at this property in the last 3 years? What carrier currently insures it and at what premium?
- The area grade is low — what's the realistic commute time and amenity access for the typical tenant pool here? Any planned neighborhood developments (good or bad) we should know about?
- What's the average days-on-market for RENTAL listings here right now (not sales)? A rising rental-DOM trend means longer vacancies and softer asking-rent achievability than the comps imply.
- What's the recent tenant-quality profile in this submarket — average credit score on applications, eviction rate, late-payment / NSF rate, and stable-employment percentage? A property-management company in the area should have these aggregated.
- How much new for-sale + rental construction is in the pipeline within 1–3 miles? Heavy new supply typically softens prices + rents 12–24 months out; constrained supply supports both.
Investment metrics
- 1% rule
- 0.88% ✗
- Cap rate
- 6.84%
- Cash-on-cash
- 1.95%
- DSCR
- 1.09
- GRM
- 9.5
CMA / ARV
No comps found within radius.
Projected returns pro-forma
-3.0% appreciation · 2.39% rent growth · sell at horizon
- IRR
- -13.9%
- Equity multiple
- 0.50×
- Total profit
- $-27,708
- Equity at exit
- $29,806
- IRR
- -6.0%
- Equity multiple
- 0.62×
- Total profit
- $-21,129
- Equity at exit
- $17,284
Cash invested: $55,972 (down + closing). Projections, not guarantees.
Landlord ↔ Tenant lean methodology
- Overall (STATE)
- 83 Strongly Landlord-Friendly
- State Nebraska
- 83 Strongly Landlord-Friendly · R+13
- County
- — inherits STATE
- City
- — inherits STATE
ZIP-level market 68503
- Rents YoY
- 2.4%
- Active inventory
- 56
- Price-to-rent
- 9.5×
Monthly cashflow live
- Estimated rent
- $1,755 high interval (Pro) →
- Mortgage (P&I)
- −$1,048
- Tax from tax record
- −$164 /mo · $1,967/yr
- Insurance
- −$83
- HOA
- −$0
- Vacancy / Maint / Mgmt
- −$369
- Net cashflow
- $91
Break-even live
UW: 25.0% down · 7.5% · 30yr · 1.5% tax · 5.0% vac · 8.0% maint · 8.0% mgmt
Financing live
Cash to close
- Down payment
- $49,975
- Closing costs
- $5,997
- Reserves months
- —
- Total cash needed
- —
Loan-product check · same deal, 3 products live
Conventional
25% down · 7.5% · 30yr
- Down + closing
- —
- Monthly P&I
- —
- Monthly cashflow
- —
- DSCR
- —
- Eligible?
- —
Personal DTI + credit; lowest rate.
DSCR
20% down · 8.5% · 30yr
- Down + closing
- —
- Monthly P&I
- —
- Monthly cashflow
- —
- DSCR
- —
- Eligible?
- —
No personal income docs; deal must DSCR.
Hard money
10% down · 12.0% · 12mo
- Down + closing
- —
- Monthly P&I
- —
- Monthly cashflow
- —
- DSCR
- —
- Eligible?
- —
Short-term bridge; refi at stabilization.
Rent comps 12 comps
| Address | Beds | Baths | Sqft | Rent | $/sqft | DOM | Units | Dist |
|---|---|---|---|---|---|---|---|---|
| 2245 Holdrege St Lincoln, NE | 4.0 | 1.0 | 1422 | $1,900 | $1.34 | 44d | 1 | 0.45mi |
| 2253 Orchard St Unit 1 Lincoln, NE | 4.0 | 3.0 | 2000 | $2,400 | $1.20 | 44d | 1 | 0.46mi |
| 2239 Dudley St Lincoln, NE | 2.0 | 1.0 | 1241 | $1,100 | $0.89 | 44d | 1 | 0.46mi |
| 2608 Q St Unit 2 Lincoln, NE | 4.0 | 2.0 | 1575 | $1,550 | $0.98 | 44d | 1 | 0.77mi |
| 3548 R St Unit A Lincoln, NE | 4.0 | 3.5 | 1328 | $2,550 | $1.92 | 44d | 1 | 0.87mi |
| 2039 Q St Unit 102 Lincoln, NE | 3.0 | 3.0 | 1450 | $1,595 | $1.10 | 44d | 1 | 0.99mi |
| 2039 Q St Unit 103 Lincoln, NE | 3.0 | 3.0 | 1450 | $1,695 | $1.17 | 44d | 1 | 0.99mi |
| 3811 Baldwin Ave Lincoln, NE | 1.0–3.0 | 1.0–2.0 | 1015 | $1,489 | $1.47 | 14d | 14 | 1.03mi |
| 4630 Starr St Unit 4630 Lincoln, NE | 3.0 | 1.0 | 1460 | $1,250 | $0.86 | 44d | 1 | 1.28mi |
| 1018 Charleston St Unit 1 Lincoln, NE | 3.0 | 2.0 | 1292 | $1,195 | $0.92 | 14d | 1 | 1.38mi |
| 420 S 18th St Lincoln, NE | 1.0–3.0 | 1.0–2.0 | 996 | $1,499 | $1.51 | 14d | 8 | 1.42mi |
| 4904 Holdrege St Lincoln, NE | 2.0 | 1.0 | 1282 | $1,299 | $1.01 | 44d | 1 | 1.46mi |
Listing history 3 events
-
2026-04-01status Pending
-
2026-03-17$199,900 New
-
2005-03-18soldstatus $93,000
ⓘ Source: listings_history table (triggers on properties + properties_extension) + one-shot
backfill from property_details.listing_events for pre-trigger history.
Tax reassessment forecast NE · Resets to sale price
- Current annual tax
- $1,967 · $164/mo
- Projected year-2 tax
- $3,458 · $288/mo
- Expected delta
- +$1,491/yr (+$124/mo · 75.8%)
ⓘ Screening estimate from a state-policy table — verify with the county assessor before closing.
Climate risk First Street
- Flood 1/10 Low FEMA zone X (unshaded) · 0% chance over 30 yrs
- Wildfire 1/10 Low
- Heat 3/10 Moderate 7 d/yr ≥104°F today · 16 d/yr by 30 yrs out
- Wind 2/10 Low
- Air quality 1/10 Low 0 unhealthy d/yr today · 0 by 30 yrs out
Nearby sold comps map
Loading sold comps map…
Walkable amenities ~0.75 mi
Loading nearby amenities…
Taxation est. · year 1
- Rental income
- $21,058
- − Mortgage interest
- −$11,198
- − Property taxes
- −$1,967
- − Insurance
- −$1,000
- − Repairs & maintenance
- −$1,685
- − Management
- −$1,685
- − Depreciation
- −$5,815
- Taxable loss
- −$2,291
- Est. tax savings @ 24.0%
- +$550
- After-tax cash flow
- $1,639/yr
For passive investors: Depreciation is non-cash, so a rental often shows a tax loss while cash-flowing — sheltering income. Rental losses are passive: they offset passive income freely, and up to $25,000/yr can offset ordinary (W-2) income if you actively participate and your MAGI is under $100k (phasing out to $0 by $150k); unused losses carry forward. On sale, claimed depreciation is recaptured at up to 25%, and gains may owe capital-gains tax (a 1031 exchange can defer both). Figures are a year-1 estimate at your 24.0% rate — not tax advice; consult a CPA.
Schools (NCES district)
- District
- Lincoln Public Schools
- NCES district ID
- 3172840
- Math proficiency
- 50% ▼ -6.00%
- Reading proficiency
- 53% ▼ -3.00%
- Median HH income
- $50,273
- Composite
- 44.05/100
- National rank
- #2880
- State rank
- #59 of 111 in NE
Livability — Lincoln
- Score
- 85/100
- State rank
- #5
- US rank
- #545
Category grades
Schools grade is shown separately in the Schools card above.
Census & demographics
- Census place
- Lincoln, NE
- County
- Lancaster County · 291,509 people
- City population
- 291,509
- Metro
- Lincoln, NE
- Population (ZIP)
- 15,867
- Household income
- $54,232
- Rent vs Own
- Severe rent burden
- 820.0
Population outlook (Lancaster County) Hauer SSP2
- Today (2025)
- 352,806 people
- By 2030
- 377,899 · +7.1%
- By 2040
- 428,582 · +21.5%
- By 2050
- 483,103 · +36.9%
- By 2075
- 632,390 · +79.2%
- By 2100
- 759,513 · +115.3%
Race, ethnicity, and origin ACS 2023
- Neighborhood character
- Diverse neighborhood (Simpson 0.62)
- Race & ethnicity
- White 59% Hispanic / Latino 12% Black 12% Two or more races 10% Asian 10%
- Hispanic origin (detail)
- Mexican 8%
- Common ancestry
- Lithuanian 2% Romanian 2% Portuguese 2%
- Foreign-born
- 19% · Canada, Vietnam, China
- Languages at home
- 73% English-only · Spanish 7% Other Indo-European 5% Vietnamese 5%
Political lean MEDSL · Lancaster
- 2024 margin
- Toss-up / Even · D 51.4% · R 47.1% · Other 1.5%
- 2008→2024 swing
- -0.7pp no change · 2008: 5.0pp · 2024: 4.3pp
- All cycles
- 2024: D+4.3 2020: D+7.8 2016: D+0.1 2012: R+1.0 2008: D+5.0
Not yet ingested
- Civics
- —
Market trends
- HPI YoY
- ▼ -145.46%
- Current HPI
- 260.3421
- Rent YoY
- ▲ 2.39%
- Metro
- Lincoln, NE
- State GDP YoY
- ▲ 0.68%
- F500 in state
- 2
Industry mix (Fortune 500 HQ in NE)
| Industry | F500 HQs | Revenue |
|---|---|---|
| Conglomerate | 1 | $371B |
|
||
Price history
+114.9% since first listed3 events — show timeline
- 2026-04-01 Pending — GPRMLS
- 2026-03-17 Listed $199,900 GPRMLS
- 2005-03-18 Sold (Public Records) $93,000 Public Records
Property tax history
+3.7%/yrLatest (2025): $1,967 · -7.9% YoY. Source: county tax records.
Cash-flow waterfall
monthlySold comps — $/sqft
last 12 mo · ≤1 miLoading sold comps…