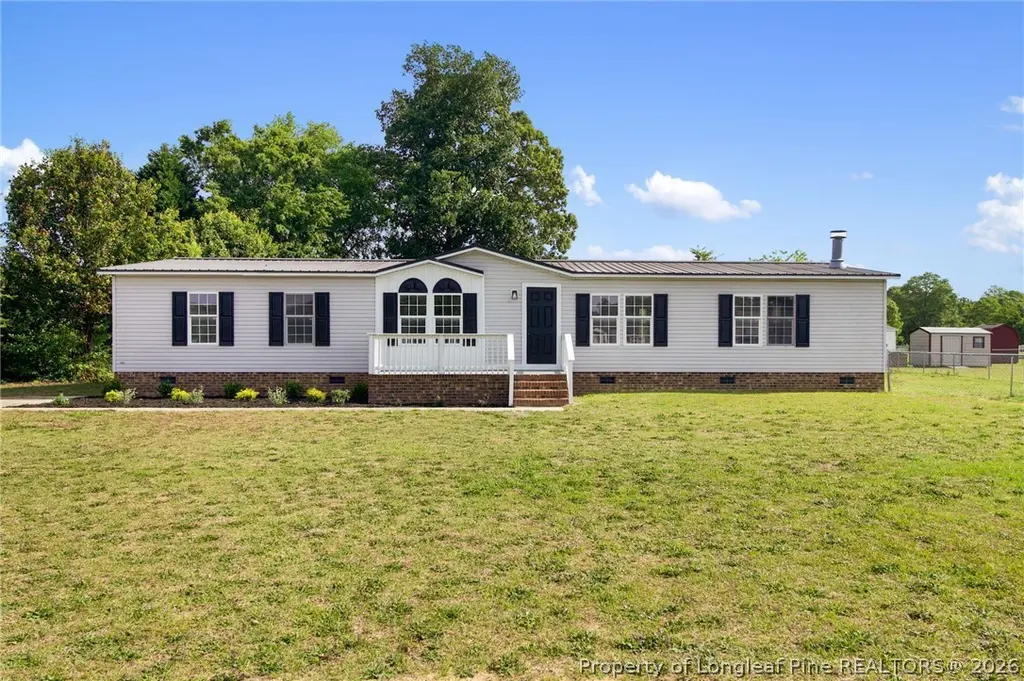
4133 Frontier Ave · Vander, NC
Flood risk 1/10 · Minimal
- FEMA flood zone
- X (unshaded)
- Chance of flooding over 30 yrs
- 0.0%
- Est. flood insurance / yr
- $507 – $1,088
Fire risk 6/10 · Moderate
- Est. fire insurance / yr
- $906 – $1,684
Heat risk 8/10 · Major
- Hot days now (above 106°F)
- 7 days/yr
- Hot days in 30 yrs
- 16 days/yr
Wind risk 8/10 · Major
- Chance of severe wind over 30 yrs
- 80.0%
Air-quality risk 1/10 · Minimal
- Unhealthy air days now
- 0 days/yr
- Unhealthy air days in 30 yrs
- 0 days/yr
Risk factors via First Street. Map © Google.
Why this score? — see what drove the C grade
The composite is a weighted blend of 9 inputs, each scored 0–100. Each bar is that input's sub-score; the figure is the points it added to the 100-point composite (weight × sub-score).
- Cash flow +20.3/30.0
- Appreciation +10.0/10.0
- DSCR +6.4/10.0
- ARV discount +6.4/15.0
- 1% rule +4.5/10.0
- Schools +3.1/10.0
- Livability +2.8/5.0
- Rent growth +2.5/5.0
- Condition / age +2.5/5.0
$209,900
🖨 Deal sheet 📄 Offer letter ✓ Due diligence
Listing remarks
This 3 bedroom, 2 bathroom home has such a comfortable feel and a layout that flows naturally from room to room. Between the den and formal living room, there’s plenty of space to spread out while still keeping that connected feel throughout the home. One of the details that really gives this home character is the oval opening between the den and living room, adding charm and openness to the main living areas. The eat in kitchen offers a welcoming space for everyday living and features quartz countertops along with a functional setup that works well for both daily routines and entertaining. Luxury vinyl plank flooring runs throughout the main living spaces, while the bedrooms have sof
Key facts
- 0.47 acre lot
- Built 1997
- Listed 42 days
Property features AI
Exterior
- Utilities: Water from spring and well; Septic tank and holding tank
- Home design: Manufactured home (residential); Single-story / One level; Rural Residential (RR) zoning
- Construction: Vinyl siding; Crawl space foundation
- Exterior features: Private yard; Front porch; Porch; Fenced yard; Lot is cleared
Interior
- Kitchen: Dishwasher; Range; Refrigerator; Eat-in kitchen layout
- Bedrooms: Total of 5 rooms (includes bedrooms and living areas)
- Flooring: Carpet; Vinyl
- Bathrooms: 2 full bathrooms
- Heating & cooling: Heat pump heating; Central air conditioning; Ceiling fan cooling
- Interior features: Ceiling fans; Entrance foyer; Eat-in kitchen; Open floor plan; Skylight(s); Wood-burning fireplace
- Laundry & utility: Washer hookup on the main level
Neighborhood map
What this means for you Summary
Snapshot
- This is a 3-bed/3.0-bath manufactured listed at $210k.
Deal economics
- At list price, monthly cash flow is $268 ($3k/yr) — positive.
- The deal already cash-flows at list — no discount required.
- To meet the 1% rule (rent ≥ 1% of price), the offer needs to be $200k (4.8% below list).
- Recommended offer: $200k (4.8% below list) — sets the bar for 1% rule.
- Cap rate 7.8% vs local median 3.9% in Vander — top-decile yield for the area; either an underpriced asset or a hidden risk that comps aren't pricing in. Stress-test before assuming the spread holds.
Location & tenants
- Location reads 55/100 on livability (#645 in NC) — a working-class tenant base; expect higher turnover. Strengths: cost of living A+, crime A, employment B+; Watch: amenities F, commute F, housing F.
- Cumberland County Schools (urban): math 32% / reading 41% proficiency, ranked #126 of 178 in NC (top 71%) — families likely to look elsewhere, expect single-tenant / working-renter base with shorter leases.
- Zoned schools: Mac Williams Middle (math 40% / reading 50%, grade D, #160 of 475 statewide, top 35%, 1,151 students, 58% FRL); Cape Fear High (math 75% / reading 47%, grade C+, #202 of 535 statewide, top 39%, 1,529 students, 50% FRL) — zoned schools at 54% FRL track the district average.
- Zoned-school proficiency averages 53% at this address vs 36% district-wide (+16 pts) — the actual schools serving this property are materially stronger than the Cumberland County Schools average implies; a family-tenant draw the district grade alone would hide.
- Market conditions: 222 active listings in the ZIP; 6 comparable units currently listed for rent nearby; rentals leasing fast (median 14d on market — plan ~1-2 weeks tenant-placement turnaround); 1,125 units permitted in Cumberland County in 2024 (104 in 5+ unit buildings).
Forward outlook
- In year one you build about $22k of equity ($1k loan paydown + $21k appreciation (10.0% local appreciation)).
- At projected returns (10.0% appreciation + 3.0% rent growth), your $59k cash investment doubles in ~3 years — after that, you're playing with house money.
- By year 2, paydown + projected appreciation supports a ~$36k cash-out refi (75% LTV) — recoverable capital for the next deal without selling this one.
Negotiation context
- It's been on market 42 days — a 3% lower offer ($204k) is reasonable based on typical stale-listing flexibility.
Risks & watch-outs
- Climate carrying-cost: severe wind risk, 80% chance of damaging wind over 30y; major wildfire risk; extreme-heat days projected 7→16/yr by 2055 (HVAC capex compounding) — expect insurance premiums to compound above CPI over the hold.
Questions for the listing agent
- It's been on market 42 days. Have you received any prior offers? Is the seller open to a 5% concession, seller financing, or rate buy-down credit?
- Is there a deadline driving the sale (1031 exchange, divorce, estate, relocation)? That informs how much negotiation room exists.
- Schools are F-rated, which usually means shorter tenancies and higher turnover. Who's the typical renter profile here, and what's been the actual vacancy rate?
- What's the average days-on-market for RENTAL listings here right now (not sales)? A rising rental-DOM trend means longer vacancies and softer asking-rent achievability than the comps imply.
- What's the recent tenant-quality profile in this submarket — average credit score on applications, eviction rate, late-payment / NSF rate, and stable-employment percentage? A property-management company in the area should have these aggregated.
- How much new for-sale + rental construction is in the pipeline within 1–3 miles? Heavy new supply typically softens prices + rents 12–24 months out; constrained supply supports both.
Investment metrics
- 1% rule
- 0.95% ✗
- Cap rate
- 7.82%
- Cash-on-cash
- 5.47%
- DSCR
- 1.24
- GRM
- 8.8
CMA / ARV
- ARV (on-the-fly)
- $204,930
- Comps found
- 5
Show comp detail 5 sales within ~0.75 mi
| Address | Dist | Beds/Ba | Sqft | Sold | Price | $/sf | Match |
|---|---|---|---|---|---|---|---|
| 4209 Frontier Ave | 0.09mi | 4/2.0 (+1) | 1,736 (-3%) | 18mo | $200,000 | $115 | 68 |
| 4120 Bonfield Dr | 0.18mi | 4/2.0 (+1) | 2,019 (+13%) | 1mo | $246,000 | $122 | 60 |
| 305 Schiller St | 0.21mi | 3/2.0 | 1,649 (-8%) | 23mo | $165,000 | $100 | 54 |
| 237 Schiller St | 0.24mi | 3/2.0 | 1,572 (-12%) | 18mo | $179,000 | $114 | 50 |
| 421 Cabrini Ct | 0.12mi | 3/2.0 | 1,516 (-15%) | 22mo | $185,000 | $122 | 47 |
Match score weights: distance 35% · size 25% · config 20% · recency 20%. Top-matched comps best support the ARV.
Projected returns pro-forma
10.0% appreciation · 3.0% rent growth · sell at horizon
- IRR
- 28.2%
- Equity multiple
- 3.23×
- Total profit
- $131,318
- Equity at exit
- $189,095
- IRR
- 24.6%
- Equity multiple
- 7.35×
- Total profit
- $373,184
- Equity at exit
- $407,790
Cash invested: $58,772 (down + closing). Projections, not guarantees.
Landlord ↔ Tenant lean methodology
- Overall (STATE)
- 85 Strongly Landlord-Friendly
- State North Carolina
- 85 Strongly Landlord-Friendly · R+3
- County
- — inherits STATE
- City
- — inherits STATE
ZIP-level market 28312
- Home prices YoY
- 6.9%
- Active inventory
- 222
- Price-to-rent
- 8.8×
Monthly cashflow live
- Estimated rent
- $1,998 high interval (Pro) →
- Mortgage (P&I)
- −$1,101
- Tax from tax record
- −$122 /mo · $1,466/yr
- Insurance
- −$87
- HOA
- −$0
- Vacancy / Maint / Mgmt
- −$420
- Net cashflow
- $268
Break-even live
UW: 25.0% down · 7.5% · 30yr · 1.5% tax · 5.0% vac · 8.0% maint · 8.0% mgmt
Financing live
Cash to close
- Down payment
- $52,475
- Closing costs
- $6,297
- Reserves months
- —
- Total cash needed
- —
Loan-product check · same deal, 3 products live
Conventional
25% down · 7.5% · 30yr
- Down + closing
- —
- Monthly P&I
- —
- Monthly cashflow
- —
- DSCR
- —
- Eligible?
- —
Personal DTI + credit; lowest rate.
DSCR
20% down · 8.5% · 30yr
- Down + closing
- —
- Monthly P&I
- —
- Monthly cashflow
- —
- DSCR
- —
- Eligible?
- —
No personal income docs; deal must DSCR.
Hard money
10% down · 12.0% · 12mo
- Down + closing
- —
- Monthly P&I
- —
- Monthly cashflow
- —
- DSCR
- —
- Eligible?
- —
Short-term bridge; refi at stabilization.
Rent comps 6 comps
| Address | Beds | Baths | Sqft | Rent | $/sqft | DOM | Units | Dist |
|---|---|---|---|---|---|---|---|---|
| 4211 Cherry Hill Ln Fayetteville, NC | 4.0 | 2.5 | 2341 | $2,145 | $0.92 | 13d | 1 | 0.94mi |
| 4066 Hummingbird Pl Fayetteville, NC | 3.0 | 2.0 | 1324 | $1,650 | $1.25 | 23d | 1 | 0.96mi |
| 4243 Cinder Ln Fayetteville, NC | 4.0 | 3.0 | 2144 | $2,085 | $0.97 | 13d | 1 | 1.02mi |
| 4233 Pleasantburg Dr Fayetteville, NC | 4.0 | 2.5 | 2252 | $2,300 | $1.02 | 13d | 1 | 1.09mi |
| 903 Penguin Dr Fayetteville, NC | 4.0 | 2.0 | 1865 | $2,100 | $1.13 | 21d | 1 | 1.25mi |
| 470 Shelton Beard Rd Stedman, NC | 3.0 | 2.0 | 1296 | $1,600 | $1.23 | 13d | 1 | 1.32mi |
Listing history 16 events
-
2026-06-18days on market $209,900 Active 42 DOM
-
2026-06-17days on market $209,900 Active 41 DOM
-
2026-06-16days on market $209,900 Active 40 DOM
-
2026-06-15days on market $209,900 Active 39 DOM
-
2026-06-14days on market $209,900 Active 37 DOM
-
2026-06-13days on market $209,900 Active 36 DOM
-
2026-06-10days on market $209,900 Active 34 DOM
-
2026-06-09days on market $209,900 Active 33 DOM
-
2026-06-08days on market $209,900 Active 32 DOM
-
2026-06-07pricedays on market $209,900 Active 31 DOM
-
2026-06-03days on market $218,900 Active 27 DOM
-
2026-06-02days on market $218,900 Active 26 DOM
-
2026-06-01days on market $218,900 Active 25 DOM
-
2026-05-31days on market $218,900 Active 24 DOM
-
2026-05-30days on market $218,900 Active 23 DOM
-
2026-05-07$219,900 Active
ⓘ Source: listings_history table (triggers on properties + properties_extension) + one-shot
backfill from property_details.listing_events for pre-trigger history.
Tax reassessment forecast NC · Resets to sale price
- Current annual tax
- $1,466 · $122/mo
- Projected year-2 tax
- $1,721 · $143/mo
- Expected delta
- +$255/yr (+$21/mo · 17.4%)
ⓘ Screening estimate from a state-policy table — verify with the county assessor before closing.
Climate risk First Street
- Flood 1/10 Low FEMA zone X (unshaded) · 0% chance over 30 yrs
- Wildfire 6/10 Major
- Heat 8/10 Severe 7 d/yr ≥106°F today · 16 d/yr by 30 yrs out
- Wind 8/10 Severe 80% chance of damaging wind over 30 yrs
- Air quality 1/10 Low 0 unhealthy d/yr today · 0 by 30 yrs out
Nearby sold comps map
Loading sold comps map…
Walkable amenities ~0.75 mi
Loading nearby amenities…
Taxation est. · year 1
- Rental income
- $23,972
- − Mortgage interest
- −$11,758
- − Property taxes
- −$1,466
- − Insurance
- −$1,050
- − Repairs & maintenance
- −$1,918
- − Management
- −$1,918
- − Depreciation
- −$6,106
- Taxable loss
- −$243
- Est. tax savings @ 24.0%
- +$58
- After-tax cash flow
- $3,272/yr
For passive investors: Depreciation is non-cash, so a rental often shows a tax loss while cash-flowing — sheltering income. Rental losses are passive: they offset passive income freely, and up to $25,000/yr can offset ordinary (W-2) income if you actively participate and your MAGI is under $100k (phasing out to $0 by $150k); unused losses carry forward. On sale, claimed depreciation is recaptured at up to 25%, and gains may owe capital-gains tax (a 1031 exchange can defer both). Figures are a year-1 estimate at your 24.0% rate — not tax advice; consult a CPA.
Schools (NCES district)
- District
- Cumberland County Schools
- NCES district ID
- 3700011
- Math proficiency
- 32% ▼ -2.00%
- Reading proficiency
- 41% ▼ -1.00%
- Median HH income
- $44,168
- Composite
- 31.0/100
- National rank
- #6096
- State rank
- #126 of 178 in NC
Livability — Vander
- Score
- 55/100
- State rank
- #645
- US rank
- #23450
Category grades
Schools grade is shown separately in the Schools card above.
Census & demographics
- Population (ZIP)
- 19,889
Population outlook (Cumberland County) Hauer SSP2
- Today (2025)
- 330,855 people
- By 2030
- 333,523 · +0.8%
- By 2040
- 335,583 · +1.4%
- By 2050
- 335,325 · +1.4%
- By 2075
- 342,853 · +3.6%
- By 2100
- 340,698 · +3.0%
Race, ethnicity, and origin ACS 2023
- Neighborhood character
- Diverse neighborhood (Simpson 0.61)
- Race & ethnicity
- White 55% Black 29% Two or more races 8% Hispanic / Latino 8% Native American 2%
- Hispanic origin (detail)
- Mexican 4% Puerto Rican 2%
- Common ancestry
- Slovak 3% Serbian 2% Italian 2%
- Foreign-born
- 4% · Canada
- Languages at home
- 93% English-only · Spanish 5% French/Haitian/Cajun 1%
Political lean MEDSL · Cumberland
- 2024 margin
- D (+13.4) · D 56.1% · R 42.7% · Other 1.2%
- 2008→2024 swing
- -4.3pp toward R · 2008: 17.7pp · 2024: 13.4pp
- All cycles
- 2024: D+13.4 2020: D+16.6 2016: D+16.0 2012: D+19.7 2008: D+17.7
Not yet ingested
- Civics
- —
Market trends
- HPI YoY
- ▲ 19.75%
- Current HPI
- 306.7749
- Rent YoY
- —
- Metro
- —
- State GDP YoY
- ▲ 3.28%
- F500 in state
- 26
Industry mix (Fortune 500 HQ in NC)
| Industry | F500 HQs | Revenue |
|---|---|---|
| Financial Services | 2 | $213B |
|
||
| Retail | 2 | $95B |
|
||
| Industrial Conglomerate | 1 | $38B |
|
||
| Metals / Steel | 1 | $35B |
|
||
| Utilities | 1 | $30B |
|
||
| Industrial Machinery | 1 | $19B |
|
||
Price history
1 event — show timeline
- 2026-05-07 Listed $219,900 LPRMLS
Property tax history
+7.0%/yrLatest (2025): $1,466 · +78.3% YoY. Source: county tax records.
Cash-flow waterfall
monthlySold comps — $/sqft
last 12 mo · ≤1 miLoading sold comps…