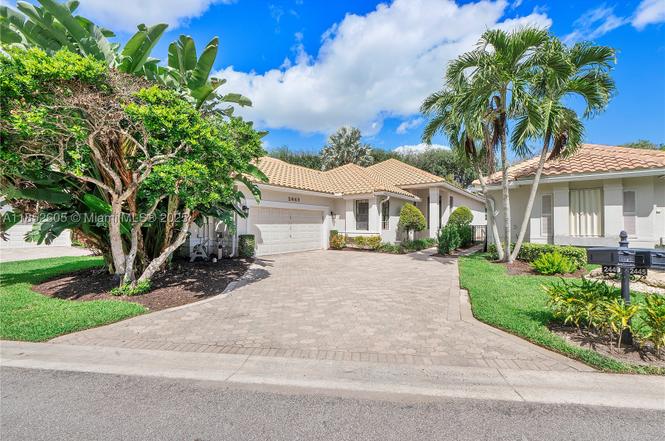
2449 NW 64th St · Boca Raton, FL
Flood risk 1/10 · Minimal
- FEMA flood zone
- X (unshaded)
- Chance of flooding over 30 yrs
- 0.0%
- Est. flood insurance / yr
- $507 – $1,088
Fire risk 1/10 · Minimal
- Est. fire insurance / yr
- $947 – $1,759
Heat risk 9/10 · Severe
- Hot days now (above 106°F)
- 7 days/yr
- Hot days in 30 yrs
- 26 days/yr
Wind risk 10/10 · Severe
- Chance of severe wind over 30 yrs
- 99.0%
Air-quality risk 3/10 · Minor
- Unhealthy air days now
- 2 days/yr
- Unhealthy air days in 30 yrs
- 3 days/yr
Risk factors via First Street. Map © Google.
Why this score? — see what drove the B grade
The composite is a weighted blend of 9 inputs, each scored 0–100. Each bar is that input's sub-score; the figure is the points it added to the 100-point composite (weight × sub-score).
- Cash flow +23.1/30.0
- ARV discount +13.5/15.0
- Appreciation +10.0/10.0
- DSCR +7.4/10.0
- 1% rule +6.8/10.0
- Schools +4.3/10.0
- Livability +3.9/5.0
- Rent growth +3.1/5.0
- Condition / age +2.5/5.0
$692,000
🖨 Deal sheet 📄 Offer letter ✓ Due diligence
Listing remarks MLS
THIS WONDERFUL LIGHT AND BRIGHT HOME IS A REAL GEM. FEATURING A PRIVATE SCREENED PATIO OVERLOOKING A WONDERFUL POOL AND SPA AREA. NEW A/C AND VERY CLEAN. SELLER WANTS TO SELL NOW!!!
Key facts
- 6,634 sq ft lot
- 2 garage spots
- Community pool
Property features AI
Finance
- Other: Pets allowed with conditions/restrictions
- HOA & community: Monthly association fee ($500/month); Gated community with clubhouse; Golf and golf-course community; Community pool; Tennis courts
Exterior
- Parking: 2-car garage; Driveway; Paver block driveway; Garage door opener; 2 covered parking spaces
- Security: Security gate; Gated community; Smoke detectors
- Utilities: Public water; Public sewer
- Home design: Single-story home; East-facing
- Construction: Block construction; Barrel roof; Resale property
- Exterior features: Balcony; Open balcony/porch; Fence; Fruit trees; Exterior lighting; Storm/security shutters; Community in-ground pool; Community spa (in-ground); In-ground private pool features (if applicable)
Interior
- Kitchen: Dishwasher; Electric range; Microwave; Refrigerator; Garbage disposal; Icemaker; Trash compactor
- Bedrooms: Primary and other bedrooms on the main level
- Flooring: Ceramic tile; Hardwood; Laminate; Wood
- Bathrooms: 2 full bathrooms; 1 half bathroom
- Heating & cooling: Central heating (electric); Central air conditioning (electric)
- Interior features: First-floor entry; Main-level primary bedroom; Bedroom on main level; Dual sinks; Tub with shower; Handicap access
- Laundry & utility: Washer; Dryer; Electric water heater
Neighborhood map
What this means for you Summary
Snapshot
- This is a 3-bed/2.5-bath single-family listed at $692k.
Deal economics
- At list price, monthly cash flow is $1k ($15k/yr) — positive.
- The deal already cash-flows at list — no discount required.
- Meets the 1% rule at list price ($8k rent vs $692k).
- Recommended offer: $609k (12.0% below list) — sets the bar for market timing.
- Cap rate 8.5% vs local median 2.8% in Boca Raton — top-decile yield for the area; either an underpriced asset or a hidden risk that comps aren't pricing in. Stress-test before assuming the spread holds.
Location & tenants
- Location reads 77/100 on livability (#192 in FL, #3,070 nationally) — a middle-class / working-renter tenant base. Strengths: schools A+, employment A+, health & safety A+; Watch: amenities D, cost of living F.
- Palm Beach (suburban): math 46% / reading 53% proficiency, ranked #34 of 73 in FL (top 47%) — families likely to look elsewhere, expect single-tenant / working-renter base with shorter leases.
- Market conditions: Rents rising (+2.3%/yr); 324 active listings in the ZIP; 23 comparable units currently listed for rent nearby; rentals at typical pace (median 24d on market — plan ~3-4 weeks tenant-placement turnaround); high-income renter base; 3,974 units permitted in Palm Beach County in 2024 (1,012 in 5+ unit buildings).
- At $8,197/mo this rent would consume 86% of the median local household income ($115k/yr) (locally 464% of renters already pay >50% of income on rent) — very limited rent-growth headroom before tenants either downsize or default.
Forward outlook
- In year one you build about $74k of equity ($5k loan paydown + $69k appreciation (10.0% local appreciation)).
- Palm Beach County population projected at +30% by 2050 — long-run rental-demand tailwind backs the buy-and-hold thesis.
- At projected returns (10.0% appreciation + 2.3% rent growth), your $194k cash investment doubles in ~3 years — after that, you're playing with house money.
- By year 2, paydown + projected appreciation supports a ~$119k cash-out refi (75% LTV) — recoverable capital for the next deal without selling this one.
Negotiation context
- It's been on market 212 days — a 12% lower offer ($609k) is reasonable based on typical stale-listing flexibility.
- 5 sale attempts since 25y ago; this cycle's ask has dropped $59k (8%) from the opening price — seller is motivated, your offer sets the floor, not the list.
- Current owner paid $260k; list at $692k implies a 166% gain — meaningful room to come down on a strong offer.
Risks & watch-outs
- Climate carrying-cost: severe wind risk, 99% chance of damaging wind over 30y; extreme-heat days projected 7→26/yr by 2055 (HVAC capex compounding) — expect insurance premiums to compound above CPI over the hold.
Questions for the listing agent
- It's been on market 212 days. Have you received any prior offers? Is the seller open to a 12% concession, seller financing, or rate buy-down credit?
- What does the HOA fee cover, when was the last increase, and are there any pending special assessments or reserve-fund shortfalls?
- Why hasn't it sold? Are there any deal-killer items the seller is aware of (foundation, flood, title, zoning, code violations)?
- Is there a deadline driving the sale (1031 exchange, divorce, estate, relocation)? That informs how much negotiation room exists.
- Schools are A-rated — typically a magnet for longer-tenancy family renters. What's the average tenant stay here, and is there a school-zone premium baked into asking?
- What's the average days-on-market for RENTAL listings here right now (not sales)? A rising rental-DOM trend means longer vacancies and softer asking-rent achievability than the comps imply.
- What's the recent tenant-quality profile in this submarket — average credit score on applications, eviction rate, late-payment / NSF rate, and stable-employment percentage? A property-management company in the area should have these aggregated.
- How much new for-sale + rental construction is in the pipeline within 1–3 miles? Heavy new supply typically softens prices + rents 12–24 months out; constrained supply supports both.
Investment metrics
- 1% rule
- 1.18% ✓
- Cap rate
- 8.45%
- Cash-on-cash
- 7.72%
- DSCR
- 1.34
- GRM
- 7.0
CMA / ARV
- ARV (on-the-fly)
- $799,140
- Comps found
- 2
Show comp detail 2 sales within ~0.75 mi
| Address | Dist | Beds/Ba | Sqft | Sold | Price | $/sf | Match |
|---|---|---|---|---|---|---|---|
| 2492 NW 66th Dr | 0.13mi | 3/2.5 | 2,343 (+11%) | 2mo | $830,000 | $354 | 74 |
| 2187 NW 59th St | 0.74mi | 3/2.5 | 2,104 (0%) | 2mo | $800,000 | $380 | 64 |
Match score weights: distance 35% · size 25% · config 20% · recency 20%. Top-matched comps best support the ARV.
Projected returns pro-forma
10.0% appreciation · 2.31% rent growth · sell at horizon
- IRR
- 29.6%
- Equity multiple
- 3.33×
- Total profit
- $451,006
- Equity at exit
- $623,408
- IRR
- 25.5%
- Equity multiple
- 7.48×
- Total profit
- $1,255,359
- Equity at exit
- $1,344,404
Cash invested: $193,760 (down + closing). Projections, not guarantees.
Landlord ↔ Tenant lean methodology
- Overall (STATE)
- 87 Strongly Landlord-Friendly
- State Florida
- 87 Strongly Landlord-Friendly · R+3
- County
- — inherits STATE
- City
- — inherits STATE
ZIP-level market 33496
- Home prices YoY
- 3.5%
- Rents YoY
- 2.3%
- Active inventory
- 324
- Price-to-rent
- 7.0×
Monthly cashflow live
- Estimated rent
- $8,197 high interval (Pro) →
- Mortgage (P&I)
- −$3,629
- Tax from tax record
- −$812 /mo · $9,741/yr
- Insurance
- −$288
- HOA
- −$500
- Vacancy / Maint / Mgmt
- −$1,721
- Net cashflow
- $1,246
Break-even live
UW: 25.0% down · 7.5% · 30yr · 1.5% tax · 5.0% vac · 8.0% maint · 8.0% mgmt
Financing live
Cash to close
- Down payment
- $173,000
- Closing costs
- $20,760
- Reserves months
- —
- Total cash needed
- —
Loan-product check · same deal, 3 products live
Conventional
25% down · 7.5% · 30yr
- Down + closing
- —
- Monthly P&I
- —
- Monthly cashflow
- —
- DSCR
- —
- Eligible?
- —
Personal DTI + credit; lowest rate.
DSCR
20% down · 8.5% · 30yr
- Down + closing
- —
- Monthly P&I
- —
- Monthly cashflow
- —
- DSCR
- —
- Eligible?
- —
No personal income docs; deal must DSCR.
Hard money
10% down · 12.0% · 12mo
- Down + closing
- —
- Monthly P&I
- —
- Monthly cashflow
- —
- DSCR
- —
- Eligible?
- —
Short-term bridge; refi at stabilization.
Rent comps 23 comps
| Address | Beds | Baths | Sqft | Rent | $/sqft | DOM | Units | Dist |
|---|---|---|---|---|---|---|---|---|
| 2464 NW 66th Dr Boca Raton, FL | 3.0 | 3.5 | 2568 | $10,000 | $3.89 | 24d | 1 | 0.08mi |
| 2485 NW 66th Dr Boca Raton, FL | 3.0 | 2.5 | 2472 | $9,500 | $3.84 | 24d | 1 | 0.13mi |
| 2485 NW 66th Dr Boca Raton, FL | 3.0 | 2.5 | 2472 | $9,500 | $3.84 | 10d | 1 | 0.13mi |
| 5801 NW 24th Ave #1001 Boca Raton, FL | 3.0 | 2.5 | 1957 | $13,000 | $6.64 | 16d | 1 | 0.38mi |
| 2431 NW 59th St #404 Boca Raton, FL | 3.0 | 2.5 | 1957 | $10,000 | $5.11 | 24d | 1 | 0.47mi |
| 6213 NW 21st Ct Boca Raton, FL | 3.0 | 4.0 | 2746 | $10,000 | $3.64 | 24d | 1 | 0.63mi |
| 3151 Clint Moore Rd #103 Boca Raton, FL | 3.0 | 2.0 | 1497 | $3,145 | $2.10 | 24d | 1 | 0.69mi |
| 3143 Clint Moore Rd #105 Boca Raton, FL | 3.0 | 2.0 | 1497 | $3,250 | $2.17 | 24d | 1 | 0.77mi |
| 6503 N Military Trl Boca Raton, FL | 1.0–2.0 | 1.0–2.0 | 1155 | $3,211 | $2.78 | 1d | 52 | 0.87mi |
| 2237 NW 53rd St Boca Raton, FL | 3.0 | 3.5 | 2305 | $25,000 | $10.85 | 24d | 1 | 0.96mi |
| 2771 NW 49th St Boca Raton, FL | 4.0 | 3.0 | 2596 | $6,195 | $2.39 | 17d | 1 | 0.96mi |
| 5555 N Military Trl Boca Raton, FL | 2.0–3.0 | 2.0–3.0 | 1282 | $5,069 | $3.95 | 1d | 21 | 1.01mi |
| 2218 NW 52nd St Boca Raton, FL | 2.0 | 2.5 | 1482 | $13,000 | $8.77 | 24d | 1 | 1.03mi |
| 2093 NW 52nd St Unit 2093 Boca Raton, FL | 3.0 | 2.5 | 1835 | $13,000 | $7.08 | 24d | 1 | 1.07mi |
| 2011 NW 53rd St Boca Raton, FL | 3.0 | 2.5 | 2461 | $11,000 | $4.47 | 12d | 1 | 1.13mi |
| 2034 NW 52nd St Boca Raton, FL | 2.0 | 2.5 | 1527 | $12,000 | $7.86 | 24d | 1 | 1.13mi |
| 2683 NW 45th St Boca Raton, FL | 4.0 | 2.5 | 2371 | $6,750 | $2.85 | 4d | 1 | 1.13mi |
| 5500 N Military Trl Boca Raton, FL | 1.0–3.0 | 1.0–2.0 | 1053 | $5,719 | $5.43 | 3d | 27 | 1.20mi |
| 17099 Ryton Ln Boca Raton, FL | 3.0 | 2.5 | 2492 | $18,000 | $7.22 | 24d | 1 | 1.23mi |
| 4695 Brandywine Dr Boca Raton, FL | 3.0 | 3.0 | 1974 | $4,750 | $2.41 | 24d | 1 | 1.32mi |
| 5605 Forest Oaks Ter Delray Beach, FL | 3.0 | 3.0 | 2092 | $10,000 | $4.78 | 13d | 1 | 1.45mi |
| 16850 Colchester Ct Delray Beach, FL | 3.0 | 3.5 | 2715 | $8,000 | $2.95 | 18d | 1 | 1.46mi |
| 16843 Boca Delray Dr Delray Beach, FL | 2.0 | 2.0 | 1533 | $4,900 | $3.20 | 22d | 1 | 1.49mi |
HOA detail
- Monthly dues
- $500 · $6,000/yr
- Likely covers
- pool
Listing history 25 events
-
2026-06-18days on market $692,000 Active 212 DOM
-
2026-06-17days on market $692,000 Active 211 DOM
-
2026-06-16days on market $692,000 Active 210 DOM
-
2026-06-15days on market $692,000 Active 209 DOM
-
2026-06-13days on market $692,000 Active 207 DOM
-
2026-06-09days on market $692,000 Active 203 DOM
-
2026-06-07days on market $692,000 Active 201 DOM
-
2026-06-04days on market $692,000 Active 198 DOM
-
2026-06-03days on market $692,000 Active 197 DOM
-
2026-06-01days on market $692,000 Active 195 DOM
-
2026-05-31days on market $692,000 Active 194 DOM
-
2026-03-13price $692,000
-
2026-03-13status Active
-
2026-02-27status Pending
-
2026-01-14price $728,999
-
2025-07-21$750,999 Active
-
2003-05-01soldstatus $260,000
-
2003-04-28soldstatus $260,000 181-char remark
Show marketing remark (181 chars)
THIS WONDERFUL LIGHT AND BRIGHT HOME IS A REAL GEM. FEATURING A PRIVATE SCREENED PATIO OVERLOOKING A WONDERFUL POOL AND SPA AREA. NEW A/C AND VERY CLEAN. SELLER WANTS TO SELL NOW!!!
-
2003-03-15historical 181-char remark
Show marketing remark (181 chars)
THIS WONDERFUL LIGHT AND BRIGHT HOME IS A REAL GEM. FEATURING A PRIVATE SCREENED PATIO OVERLOOKING A WONDERFUL POOL AND SPA AREA. NEW A/C AND VERY CLEAN. SELLER WANTS TO SELL NOW!!!
-
2002-09-12historical
Show marketing remark (181 chars)
THIS WONDERFUL LIGHT AND BRIGHT HOME IS A REAL GEM. FEATURING A PRIVATE SCREENED PATIO OVERLOOKING A WONDERFUL POOL AND SPA AREA. NEW A/C AND VERY CLEAN. SELLER WANTS TO SELL NOW!!!
-
2002-09-12$275,000 181-char remark
Show marketing remark (181 chars)
THIS WONDERFUL LIGHT AND BRIGHT HOME IS A REAL GEM. FEATURING A PRIVATE SCREENED PATIO OVERLOOKING A WONDERFUL POOL AND SPA AREA. NEW A/C AND VERY CLEAN. SELLER WANTS TO SELL NOW!!!
-
2002-05-04historical
-
2002-05-03$279,000
-
2001-11-09$299,000
-
1990-08-02soldstatus $245,000
ⓘ Source: listings_history table (triggers on properties + properties_extension) + one-shot
backfill from property_details.listing_events for pre-trigger history.
Tax reassessment forecast FL · Resets to sale price
- Current annual tax
- $9,741 · $812/mo
- Projected year-2 tax
- $9,741 · $812/mo
- Expected delta
- $0/yr ($0/mo · 0.0%)
ⓘ Screening estimate from a state-policy table — verify with the county assessor before closing.
Climate risk First Street
- Flood 1/10 Low FEMA zone X (unshaded) · 0% chance over 30 yrs
- Wildfire 1/10 Low
- Heat 9/10 Extreme 7 d/yr ≥106°F today · 26 d/yr by 30 yrs out
- Wind 10/10 Extreme 99% chance of damaging wind over 30 yrs
- Air quality 3/10 Moderate 2 unhealthy d/yr today · 3 by 30 yrs out
Nearby sold comps map
Loading sold comps map…
Walkable amenities ~0.75 mi
Loading nearby amenities…
Taxation est. · year 1
- Rental income
- $98,359
- − Mortgage interest
- −$38,763
- − Property taxes
- −$9,741
- − Insurance
- −$3,460
- − Repairs & maintenance
- −$7,869
- − Management
- −$7,869
- − HOA
- −$6,000
- − Depreciation
- −$20,131
- Taxable income
- $4,527
- Est. tax owed @ 24.0%
- −$1,087
- After-tax cash flow
- $13,869/yr
For passive investors: Depreciation is non-cash, so a rental often shows a tax loss while cash-flowing — sheltering income. Rental losses are passive: they offset passive income freely, and up to $25,000/yr can offset ordinary (W-2) income if you actively participate and your MAGI is under $100k (phasing out to $0 by $150k); unused losses carry forward. On sale, claimed depreciation is recaptured at up to 25%, and gains may owe capital-gains tax (a 1031 exchange can defer both). Figures are a year-1 estimate at your 24.0% rate — not tax advice; consult a CPA.
Schools (NCES district)
- District
- Palm Beach
- NCES district ID
- 1201500
- Math proficiency
- 46% ▼ -16.00%
- Reading proficiency
- 53% ▼ -4.00%
- Median HH income
- $53,943
- Composite
- 42.72/100
- National rank
- #3160
- State rank
- #34 of 73 in FL
Livability — Boca Raton
- Score
- 77/100
- State rank
- #192
- US rank
- #3070
Category grades
Schools grade is shown separately in the Schools card above.
Census & demographics
- Census place
- Boca Raton, FL
- County
- Palm Beach County · 1,438,312 people
- City population
- 250,102
- Metro
- Miami-Fort Lauderdale-Pompano Beach, FL
- Population (ZIP)
- 26,579
- Household income
- $114,885
- Rent vs Own
- Severe rent burden
- 464.0
Population outlook (Palm Beach County) Hauer SSP2
- Today (2025)
- 1,637,487 people
- By 2030
- 1,743,255 · +6.5%
- By 2040
- 1,948,712 · +19.0%
- By 2050
- 2,132,979 · +30.3%
- By 2075
- 2,530,027 · +54.5%
- By 2100
- 2,706,979 · +65.3%
Race, ethnicity, and origin ACS 2023
- Neighborhood character
- Predominantly White (79%)
- Race & ethnicity
- White 79% Hispanic / Latino 11% Two or more races 8% Asian 5% Black 2%
- Hispanic origin (detail)
- Puerto Rican 3%
- Common ancestry
- Scotch-Irish 13% Romanian 9% Italian 3%
- Foreign-born
- 24% · Canada, Jamaica, Dominican Republic
- Languages at home
- 75% English-only · Spanish 9% Other Indo-European 5% Russian/Polish/Slavic 4%
Political lean MEDSL · Palm Beach
- 2024 margin
- Toss-up / Even · D 50.0% · R 49.2%
- 2008→2024 swing
- -22.1pp toward R · 2008: 22.9pp · 2024: 0.8pp
- All cycles
- 2024: D+0.8 2020: D+12.8 2016: D+15.3 2012: D+17.0 2008: D+22.9
Not yet ingested
- Civics
- —
Market trends
- HPI YoY
- ▲ 10.48%
- Current HPI
- 313.9058
- Rent YoY
- ▲ 2.31%
- Metro
- Miami-Fort Lauderdale-Pompano Beach, FL
- State GDP YoY
- ▲ 3.28%
- F500 in state
- 36
Industry mix (Fortune 500 HQ in FL)
| Industry | F500 HQs | Revenue |
|---|---|---|
| Industrial Technology | 2 | $29B |
|
||
| Insurance | 2 | $17B |
|
||
| Retail | 1 | $60B |
|
||
| Technology Distribution | 1 | $58B |
|
||
| Homebuilding | 1 | $35B |
|
||
| Technology Manufacturing | 1 | $35B |
|
||
Price history
+182.4% since first listed14 events — show timeline
- 2026-03-13 Price Changed $692,000 MARMLS
- 2026-03-13 Relisted — MARMLS
- 2026-02-27 Pending — MARMLS
- 2026-01-14 Price Changed $728,999 MARMLS
- 2025-07-21 Listed $750,999 MARMLS
- 2003-05-01 Sold (Public Records) $260,000 Public Records
- 2003-04-28 Sold (MLS) $260,000 Beaches MLS
- 2003-03-15 Listing Removed — Beaches MLS
- 2002-09-12 Listed $275,000 Beaches MLS
- 2002-09-12 Listing Removed — Beaches MLS
- 2002-05-04 Listing Removed — Beaches MLS
- 2002-05-03 Listed $279,000 Beaches MLS
- 2001-11-09 Listed $299,000 Beaches MLS
- 1990-08-02 Sold (Public Records) $245,000 Public Records
Property tax history
+6.9%/yrLatest (2025): $9,741 · +214.7% YoY. Source: county tax records.
Cash-flow waterfall
monthlySold comps — $/sqft
last 12 mo · ≤1 miLoading sold comps…