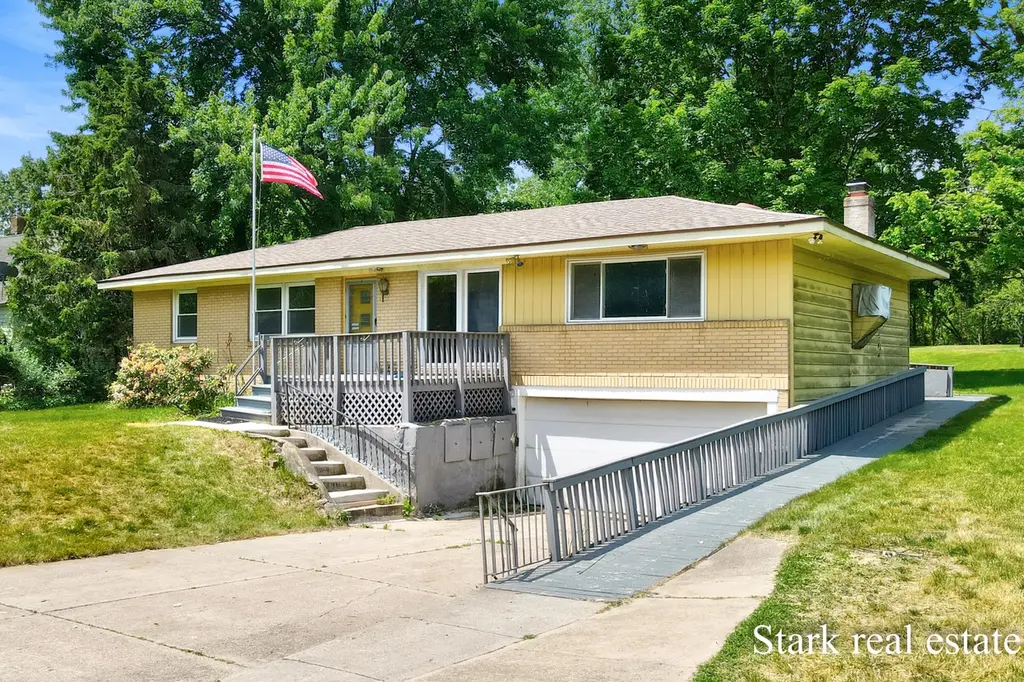
225 Sunset Hills Ave NW · Walker, MI
Flood risk 7/10 · Major
- FEMA flood zone
- X (unshaded)
- Chance of flooding over 30 yrs
- 0.77%
- Est. flood insurance / yr
- $473 – $860
Fire risk 3/10 · Minor
- Est. fire insurance / yr
- $784 – $1,456
Heat risk 2/10 · Minimal
- Hot days now (above 96°F)
- 7 days/yr
- Hot days in 30 yrs
- 16 days/yr
Wind risk 2/10 · Minimal
- Chance of severe wind over 30 yrs
- —
Air-quality risk 2/10 · Minimal
- Unhealthy air days now
- 2 days/yr
- Unhealthy air days in 30 yrs
- 2 days/yr
Risk factors via First Street. Map © Google.
Why this score? — see what drove the C+ grade
The composite is a weighted blend of 9 inputs, each scored 0–100. Each bar is that input's sub-score; the figure is the points it added to the 100-point composite (weight × sub-score).
- Cash flow +20.7/30.0
- ARV discount +15.0/15.0
- DSCR +6.6/10.0
- 1% rule +4.8/10.0
- Schools +4.8/10.0
- Rent growth +4.5/5.0
- Livability +3.7/5.0
- Condition / age +2.5/5.0
- Appreciation +0.0/10.0
$249,900
🖨 Deal sheet (PDF) 📄 Offer letter ✓ Due diligence
Listing remarks MLS
Major investment opportunity with this 3 bedroom walk-out ranch in the City of Walker on a half acre lot. Bonus bath in basement and attached garage under the home. Most rooms have real original hardwood floors, dining room and large living room with doors to fully enclosed rear screen porch. Grandville Schools and minutes from John Ball Park Zoo and Millennium Park. Additional lot available for sale also. So much potential!
Key facts
- Walk-out ranch
- Half acre lot
- Millennium park
Tags
Property features AI
Exterior
- Parking: Attached 2-car garage
- Utilities: Public water
- Home design: Ranch-style single family home; One-story
- Construction: Built in 1954; Aluminum siding and brick exterior
- Exterior features: Public water; Lot approximately 0.52 acres
Interior
- Bathrooms: One full bathroom; One half bathroom
- Heating & cooling: Forced air heating
- Interior features: Five total rooms; Fireplace; Partial basement
Neighborhood map
What this means for you Summary
Snapshot
- This is a 3-bed/1.0-bath single-family listed at $250k.
Deal economics
- At list price, monthly cash flow is $282 ($3k/yr) — positive.
- The deal already cash-flows at list — no discount required.
- To meet the 1% rule (rent ≥ 1% of price), the offer needs to be $245k (2.1% below list).
- Recommended offer: $245k (2.1% below list) — sets the bar for 1% rule.
- Cap rate 7.9% vs local median 4.1% in Walker — top-decile yield for the area; either an underpriced asset or a hidden risk that comps aren't pricing in. Stress-test before assuming the spread holds.
Location & tenants
- Location reads 74/100 on livability (#188 in MI, #4,765 nationally) — a middle-class / working-renter tenant base. Strengths: cost of living A+, housing A+, employment B+; Watch: amenities F, health & safety F.
- Grandville Public Schools (suburban): math 49% / reading 61% proficiency, ranked #70 of 540 in MI (top 13%) — acceptable for families but not a draw, mixed tenant base, ~2y average lease.
- Market conditions: Rents rising fast (+7.9%/yr); 111 active listings in the ZIP; 2 comparable units currently listed for rent nearby; solid renter incomes; 2,253 units permitted in Kent County in 2024 (969 in 5+ unit buildings).
- This rent runs 36% of the median local income ($82k/yr) — at the standard rent-burdened threshold; future hikes will face affordability resistance.
Forward outlook
- Local home prices are declining (-3.0%/yr); year-one equity from $2k of loan paydown is wiped out by about $7k of value loss. Plan a longer hold.
- Kent County population projected at +22% by 2050 — long-run rental-demand tailwind backs the buy-and-hold thesis.
- At projected returns (-3.0% appreciation + 7.9% rent growth), your $70k cash investment doubles in ~10 years — after that, you're playing with house money.
Negotiation context
- Only 3 days on market — expect competitive offers; lowballing is unlikely to land.
- 3 sale attempts with the ask held roughly flat each time — persistent listings suggest the price (not the market) is what's stuck; bring a comps-based counter.
Risks & watch-outs
- Watch-outs: flood insurance adds $56/mo; built in 1954 — expect roof / HVAC / electrical / plumbing capex.
- Climate carrying-cost: major flood risk — expect insurance premiums to compound above CPI over the hold.
Questions for the listing agent
- Built in 1954 — when were the roof, HVAC, electrical panel, plumbing, and water heater last replaced?
- What's the actual annual flood-insurance premium (NFIP or private), and is the property in a SFHA with mandatory coverage?
- Is there a deadline driving the sale (1031 exchange, divorce, estate, relocation)? That informs how much negotiation room exists.
- What's the average days-on-market for RENTAL listings here right now (not sales)? A rising rental-DOM trend means longer vacancies and softer asking-rent achievability than the comps imply.
- What's the recent tenant-quality profile in this submarket — average credit score on applications, eviction rate, late-payment / NSF rate, and stable-employment percentage? A property-management company in the area should have these aggregated.
- How much new for-sale + rental construction is in the pipeline within 1–3 miles? Heavy new supply typically softens prices + rents 12–24 months out; constrained supply supports both.
Investment metrics
- 1% rule
- 0.98% ✗
- Cap rate
- 7.92%
- Cash-on-cash
- 5.79%
- DSCR
- 1.26
- GRM
- 8.5
CMA / ARV
- ARV (on-the-fly)
- $302,848
- Comps found
- 7
Show comp detail 7 sales within ~0.75 mi
| Address | Dist | Beds/Ba | Sqft | Sold | Price | $/sf | Match |
|---|---|---|---|---|---|---|---|
| 592 Lincoln Lawns Dr NW | 0.43mi | 3/2.5 | 1,500 (+3%) | 1mo | $499,900 | $333 | 68 |
| 591 Fairway Dr NW | 0.47mi | 3/1.0 | 1,496 (+3%) | 7mo | $280,000 | $187 | 68 |
| 654 Westway Dr NW | 0.55mi | 3/1.5 | 1,358 (-7%) | 5mo | $338,000 | $249 | 56 |
| 3612 Lake Michigan Dr NW | 0.18mi | 2/2.0 (-1) | 1,526 (+5%) | 23mo | $293,000 | $192 | 55 |
| 616 Westway Dr NW | 0.51mi | 4/1.0 (+1) | 1,398 (-4%) | 13mo | $333,000 | $238 | 54 |
| 605 Lincoln Lawns Dr NW | 0.47mi | 2/1.0 (-1) | 1,560 (+7%) | 16mo | $293,000 | $188 | 48 |
| 90 Maynard Ave SW | 0.69mi | 4/1.5 (+1) | 1,632 (+12%) | 8mo | $340,000 | $208 | 34 |
Match score weights: distance 35% · size 25% · config 20% · recency 20%. Top-matched comps best support the ARV.
Projected returns pro-forma
-3.0% appreciation · 7.87% rent growth · sell at horizon
- IRR
- -3.6%
- Equity multiple
- 0.86×
- Total profit
- $-9,948
- Equity at exit
- $37,261
- IRR
- 10.8%
- Equity multiple
- 2.02×
- Total profit
- $71,534
- Equity at exit
- $21,607
Cash invested: $69,972 (down + closing). Projections, not guarantees.
Landlord ↔ Tenant lean methodology
- Overall (STATE)
- 62 Landlord-Friendly
- State Michigan
- 62 Landlord-Friendly · EVEN
- County
- — inherits STATE
- City
- — inherits STATE
ZIP-level market 49534
- Home prices YoY
- -28.4%
- Rents YoY
- 7.9%
- Active inventory
- 111
- Price-to-rent
- 8.5×
Monthly cashflow live
- Estimated rent
- $2,447 medium interval (Pro) →
- Mortgage (P&I)
- −$1,311
- Tax from tax record
- −$180 /mo · $2,164/yr
- Insurance
- −$104
- Flood insurance flood zone
- −$56 /mo · $666/yr
- HOA
- −$0
- Vacancy / Maint / Mgmt
- −$514
- Net cashflow
- $282
Break-even live
Sensitivity live
| Price | -10% $424 | -5% $353 | +0% $282 | +5% $212 | +10% $141 |
|---|---|---|---|---|---|
| Rent | -10% $89 | -5% $186 | +0% $282 | +5% $379 | +10% $476 |
| Rate | -1.0pp $408 | -0.5pp $346 | base $282 | +0.5pp $218 | +1.0pp $152 |
UW: 25.0% down · 7.5% · 30yr · 1.5% tax · 5.0% vac · 8.0% maint · 8.0% mgmt
Financing live
Cash to close
- Down payment
- $62,475
- Closing costs
- $7,497
- Reserves months
- —
- Total cash needed
- —
Loan-product check · same deal, 3 products live
Conventional
25% down · 7.5% · 30yr
- Down + closing
- —
- Monthly P&I
- —
- Monthly cashflow
- —
- DSCR
- —
- Eligible?
- —
Personal DTI + credit; lowest rate.
DSCR
20% down · 8.5% · 30yr
- Down + closing
- —
- Monthly P&I
- —
- Monthly cashflow
- —
- DSCR
- —
- Eligible?
- —
No personal income docs; deal must DSCR.
Hard money
10% down · 12.0% · 12mo
- Down + closing
- —
- Monthly P&I
- —
- Monthly cashflow
- —
- DSCR
- —
- Eligible?
- —
Short-term bridge; refi at stabilization.
Rent comps 2 comps
| Address | Beds | Baths | Sqft | Rent | $/sqft | DOM | Units | Dist |
|---|---|---|---|---|---|---|---|---|
| 1001 Kusterer Dr NW Grand Rapids, MI | 4.0 | 1.5 | 1788 | $2,600 | $1.45 | 44d | 1 | 0.96mi |
| 410 Fairfield Ave NW #1 Grand Rapids, MI | 3.0 | 2.0 | 1200 | $2,095 | $1.75 | 3d | 1 | 1.39mi |
Listing history 4 events
-
2026-06-09status $249,900 Pending 3 DOM
-
2026-06-08days on market $249,900 Active 3 DOM
-
2026-06-07remarks 428-char remark
-
2026-06-07$249,900 Active 2 DOM
ⓘ Source: listings_history table (triggers on properties + properties_extension) + one-shot
backfill from property_details.listing_events for pre-trigger history.
Tax reassessment forecast MI · Partial reset (capped growth)
- Current annual tax
- $2,164 · $180/mo
- Projected year-2 tax
- $3,006 · $250/mo
- Expected delta
- +$842/yr (+$70/mo · 38.9%)
ⓘ Screening estimate from a state-policy table — verify with the county assessor before closing.
Climate risk First Street
- Flood 7/10 Severe FEMA zone X (unshaded) · 77% chance over 30 yrs
- Wildfire 3/10 Moderate
- Heat 2/10 Low 7 d/yr ≥96°F today · 16 d/yr by 30 yrs out
- Wind 2/10 Low
- Air quality 2/10 Low 2 unhealthy d/yr today · 2 by 30 yrs out
Nearby sold comps map
Loading sold comps map…
Walkable amenities ~0.75 mi
Loading nearby amenities…
Taxation est. · year 1
- Rental income
- $29,358
- − Mortgage interest
- −$13,998
- − Property taxes
- −$2,164
- − Insurance
- −$1,916
- − Repairs & maintenance
- −$2,349
- − Management
- −$2,349
- − Depreciation
- −$7,270
- Taxable loss
- −$687
- Est. tax savings @ 24.0%
- +$165
- After-tax cash flow
- $3,552/yr
For passive investors: Depreciation is non-cash, so a rental often shows a tax loss while cash-flowing — sheltering income. Rental losses are passive: they offset passive income freely, and up to $25,000/yr can offset ordinary (W-2) income if you actively participate and your MAGI is under $100k (phasing out to $0 by $150k); unused losses carry forward. On sale, claimed depreciation is recaptured at up to 25%, and gains may owe capital-gains tax (a 1031 exchange can defer both). Figures are a year-1 estimate at your 24.0% rate — not tax advice; consult a CPA.
Schools (NCES district)
- District
- Grandville Public Schools
- NCES district ID
- 2616470
- Math proficiency
- 49% ▼ -5.00%
- Reading proficiency
- 61% ▼ -1.00%
- Median HH income
- $58,935
- Composite
- 47.74/100
- National rank
- #2234
- State rank
- #70 of 540 in MI
Livability — Walker
- Score
- 74/100
- State rank
- #188
- US rank
- #4765
Category grades
Schools grade is shown separately in the Schools card above.
Census & demographics
- Census place
- Walker, MI
- County
- Kent County · 533,805 people
- City population
- 33,350
- Metro
- Grand Rapids-Kentwood, MI
- Population (ZIP)
- 23,719
- Household income
- $81,657
- Rent vs Own
- Severe rent burden
- 415.0
Population outlook (Kent County) Hauer SSP2
- Today (2025)
- 712,484 people
- By 2030
- 748,618 · +5.1%
- By 2040
- 814,777 · +14.4%
- By 2050
- 868,556 · +21.9%
- By 2075
- 966,487 · +35.7%
- By 2100
- 967,975 · +35.9%
Race, ethnicity, and origin ACS 2023
- Neighborhood character
- Predominantly White (87%)
- Race & ethnicity
- White 87% Two or more races 5% Hispanic / Latino 4% Black 2% Asian 2%
- Common ancestry
- Iranian 20% Romanian 12% Lithuanian 2%
- Foreign-born
- 4% · Canada, China
- Languages at home
- 95% English-only · Spanish 1% Other Indo-European 1% Tagalog/Filipino 1%
Political lean MEDSL · Kent
- 2024 margin
- Lean D (+5.4) · D 51.8% · R 46.5% · Other 1.7%
- 2008→2024 swing
- +4.8pp toward D · 2008: 0.5pp · 2024: 5.4pp
- All cycles
- 2024: D+5.4 2020: D+6.1 2016: R+3.1 2012: R+7.9 2008: D+0.5
Not yet ingested
- Civics
- —
Market trends
- HPI YoY
- ▼ -107.59%
- Current HPI
- 270.866
- Rent YoY
- ▲ 7.87%
- Metro
- Grand Rapids-Kentwood, MI
- State GDP YoY
- ▲ 1.37%
- F500 in state
- 28
Industry mix (Fortune 500 HQ in MI)
| Industry | F500 HQs | Revenue |
|---|---|---|
| Automotive Parts | 3 | $48B |
|
||
| Automotive | 2 | $372B |
|
||
| Chemicals | 1 | $45B |
|
||
| Automotive Retail | 1 | $29B |
|
||
| Healthcare / Medical Devices | 1 | $23B |
|
||
| Automotive Technology | 1 | $20B |
|
||
Price history
+0.0% since first listed3 events — show timeline
- 2026-06-05 Listed $249,900 REALCOMP
- 2026-06-05 Listed $249,900 MiRealSource-MiMLS
- 2026-06-05 Listed $249,900 SW Michigan MLS
Property tax history
+3.3%/yrLatest (2025): $2,164 · +2.6% YoY. Source: county tax records.
Cash-flow waterfall
monthlySold comps — $/sqft
last 12 mo · ≤1 miLoading sold comps…